TBL1XR1 induces cell proliferation and inhibit cell apoptosis by the PI3K/AKT pathway in pancreatic ductal adenocarcinoma
2020-08-18JianFengGuWeiFuHaiXinQianWenXiuGuYangZongQianChenLongLu
Jian-Feng Gu, Wei Fu, Hai-Xin Qian, Wen-Xiu Gu, Yang Zong, Qian Chen, Long Lu
Abstract
Key words: Pancreatic ductal adenocarcinoma; TBL1XR1; Proliferation; PI3K/AKT pathway
INTRODUCTION
Pancreatic carcinoma is one of the deadliest solid tumors. Currently, pancreatic carcinoma is the fourth leading cause of cancer-related death in the United States, and there were approximately 48960 new cases confirmed and 40560 deaths in 2015[1,2]. The best chance for survival is early surgical detection. However, due to the lack of effective screening tests for pancreatic carcinoma, local invasion and early metastasis, only 10%–20% of patients are diagnosed at a stage amenable to resection and curative treatment[3,4]. Therefore, the overall 5-year survival rate is lower than 5%[5]. Despite decades of efforts, there has been no significant improvement in the long-term survival of pancreatic carcinoma patients[6]. Pancreatic ductal adenocarcinoma (PDAC) is the most common type of pancreatic carcinoma. Therefore, identification of efficacious early tumor markers for the early diagnosis and treatment of PDAC has clinical value and significance[7].
As a member of the TBL1 family, transducin (β)-like 1 X-linked receptor 1 (TBL1XR1) is the key element of the SMRT/N-CoR corepressor complex[8]. TBL1XR1 is located on chromosome 3 at 3q26 and has a high degree of homology to the TBL1 protein. Recently, studies have demonstrated that TBL1XR1 could react to transcriptional regulators such as nuclear receptors by switching from gene inhibition to gene activation[9]. Moreover, TBL1XR1 plays a vital role in cell growth, cell apoptosis, inflammation and transcriptional activation, which involve estrogen receptor, androgen receptor, thyroid hormone receptor β, peroxisome proliferatoractivated receptor γ, nuclear factor kappa-light-chain-enhancer of activated B cells (NF-κb), Notch and β-catenin[10]. Currently, studies focus on the effect and mechanism of TBL1XR1 in carcinogenesis and tumor progression, including those of nasopharyngeal carcinoma, colon cancer, osteosarcoma cancer, prostate cancer, breast cancer, and hepatocellular carcinoma[11-16]. Nevertheless, the role and molecular mechanism of TBL1XR1 in the progression of PDAC remain unclear.
In this study, we aimed to explore the effect of TBL1XR1 in PDAC. We found that TBL1XR1 expression was closely associated with the clinicopathologic features of PDAC, which might provide a new diagnostic and therapeutic target for PDAC.
MATERIALS AND METHODS
Patients and tissue specimens
This study was performed in 90 PDAC patients. The patients all underwent radical pancreaticoduodenectomy and were histopathologically and clinically diagnosed at Changshu No. 1 People’s Hospital Affiliated with Soochow University from 2011 to 2015. Our study complied with the ethical standards of the Declaration of Helsinki and was approved by the Ethics Committee of Changshu No. 1 People’s Hospital. Ninety pairs of PDAC and normal pancreatic epithelial samples were promptly fixed in 4% formalin and embedded in paraffin for immunohistochemical (IHC) staining after removal.
Immunohistochemical analysis
After obtaining fresh isolated specimens, we immediately fixed the specimens in 4% formalin and then embedded them in paraffin. Next, we cut them into 5 mm sections and mounted them on slides. IHC and HE staining were performed to examine the expression of TBL1XR1[17].
Immunohistochemical staining score
Immunohistochemical staining of TBL1XR1 expression in PDAC and normal pancreatic epithelial specimens was performed as described by Liet al[17]. The TBL1XR1 staining score was the summation of the staining strength and the ratio of positively stained cells. We defined TBL1XR1 staining strength as follows: 0% immunoreactive cells are scored 0; less than 5% immunoreactive cells are scored 1; 5%–50% immunoreactive cells are scored 2; and more than 50% immunoreactive cells are scored 3. Staining intensity was scored as follows: negative was scored 0; weak was scored 1; intermediate was scored 2; and strong was scored 3. For statistical convenience, we set intermediate and strong scores to be positive, and the negative and weak scores were considered to be negative[18].
Cell lines and cell cultures
The PDAC cell lines (Panc1, MiaPaCa-2, Capan1 and Aspc-1) were purchased from the Cell Bank of the Chinese Academy of Science. Panc1 and Capan1 cells were cultured in DMEM, and MiaPaCa-2 and Aspc-1 cells were cultured in RPMI-1640 medium. Streptomycin (100 μg/mL) and penicillin (100 U/ml) and 10% fetal bovine serum were added to DMEM or RPMI-1640 medium. The cells were cultivated at 37 °C in a humidified incubator with 5% CO2.
Cell transfection
Five hundred thousand cells were inoculated into 6-well plates, and after the cells attached, we performed a cell transfection assay according to the manufacturer’s instructions. In short, 50 nmol siRNA and 6 μL of Lipofectamine 2000 were added to 200 μl of Opti-MEM medium and incubated for 5 min. Then, the two suspensions were mixed and incubated for 15 min. The suspension was added to 6-well plates and incubated for 4 h. After incubation, we replaced the medium and harvested fresh culture medium every 2 d. The siRNA sequences were as follows: CTRL siRNA: 5’-TTCTCCGAACGTGTCACGT-3’;TBL1XR1: 5’-GGAGUAGACAAGACUACAA-3’.
Quantitative real-time PCR
We performed the assay using the methods described by Liet al[17]. Total RNA was extracted from different treated cells with TRIzol reagent (Invitrogen) in accordance with the manufacturer’s instructions. The expression of TBL1XR1 and GAPDH was determined by the primers shown below: TBL1XR1: 5’-GAG GTG TTT ATT TGT GCT TGG-3’; 5’-TGC ACT TAA TAT GAA GTT GCC-3’. GAPDH: 5’-GCCGCATCTTCTTTTGCGTCGC-3’; 5’-TCCCGTTCTCAGCCTTGACGGT-3’.
The expression of TBL1XR1 was determined by normalization to the expression of the housekeeping gene GAPDH.
Lentivirus-mediated RNA interference
The lentivirus vector was constructed by the Shanghai GeneChem Company. Lentivirus-mediated RNA interference was performed in accordance with the manufacturer’s instructions. After cell adherence, a considerable volume of virus was added to the cells for 6-8 h. Then, fresh complete medium was added, and the cells were harvested for 2 d. Cells were continuously cultured and used for subsequent studies.
Cell viability assay
A CCK-8 (Beyotime, Shanghai) assay was performed to determine the viability of PDCA cells. CCK-8 is widely used in the rapid and highly sensitive detection of cell proliferation and cytotoxicity based on WST-8. PDAC cells at 1000 cells/well were inoculated into 96-well plates after the corresponding treatment and incubated for the indicated times. Then, 10 μL of CCK-8 was added to the medium and cultured for 2 h in the dark. A microplate reader (Bio-Tek, United States) was used to measure the absorbance of PDCA cells at 450 nm.
Colony formation assay
PDAC cells with different treatments (approximately 500 cells/well) were seeded in 6-well plates. The culture medium was changed every 3 d. After approximately 2 wk of culture, the cells were cleaned with PBS and fixed with 10% formalin for 20 min at ordinary temperature. Then, 0.1% crystal violet (Sigma-Aldrich) was used to stain the cells for 20 min at room temperature. After staining, the plates were washed and dried. The colonies (with more than 50 cells) were observed under a microscope (Leica, Germany).
Western blot analysis
Proteins were extracted using RIPA buffer mixed with 1% protease inhibitor cocktail (Beyotime, Shanghai, China). Ten percent sodium dodecyl sulfate polyacrylamide gel electrophoresis (SDS-PAGE) was applied to separate the cell proteins, and polyvinylidene difluoride (PVDF) membranes were used for transfer. Five percent skim milk was used to block the membranes for 2 h. Then, the membranes were incubated with primary antibodies against TBL1XR1 (Abcam, ab228940), p-AKT (CST, 9271), p-PI3K (CST, 17366) and GAPDH (Abclonal, A19056) at 4 °C overnight. The second day, secondary antibodies were added and incubated with the PVDF membranes for 1 h at room temperature. A Gel Doc 2000 system (Bio-Rad, United States) was used to detect protein expression.
Cell cycle and apoptosis analyses
For cell cycle analysis, PDAC cells with different treatments were fixed with 75% ethanol at 4°C overnight. Then, the cells were centrifuged for precipitation and incubated with 5 μL of RNase and 5 μL of PI at room temperature. For cell apoptosis analysis, PDAC cells with different treatments were resuspended with 1 × Annexin V binding buffer and Annexin V and PI at 37 °C. After incubation for half an hour, the apoptotic cell and cell cycle ratios were detected with ow cytometric analysis.
Animal study
Four- to six-week-old nu/nu nude mice were purchased from the Shanghai Laboratory Animal Centre of the Chinese Academy of Sciences (Shanghai, China). The mice were randomly divided into the Lv-shCTRL group and the Lv-shTBL1XR1 group. One hundred thousand Panc1 cells were resuspended in 0.1 mL of serum-free medium and hypodermically inoculated into the right axilla of the mice. After approximately 4 wk, the mice were sacrificed, and the subcutaneous tumors were measured and weighed. The volume of the tumors was calculated by the following formula: Volume = length (mm) × width2(mm2)/2.
Statistical analysis
All experiments were repeated at least 3 times, and the results are expressed as the mean ± standard deviation unless otherwise stated. Student’sttest was used to compare differences between the treated groups and the corresponding control groups;P< 0.05 was considered statistically significant.
RESULTS
Clinicopathological significance of TBL1XR1 expression in patients with PDAC
The clinicopathological features of the 90 PDAC patients are shown in Table 1. As illustrated in Table 1, the overexpression of TBL1XR1 was associated with TNM stage (P= 0.006) but not with patient age (P= 0.652), gender (P= 1.000), histopathological subtype (P= 0.929), tumor size (P= 0.465), tumor location (P= 0.065) or lymph node metastasis (P= 0.050). To additionally confirm the importance of TBL1XR1 in PDAC, we analyzed the overall survival (OS) of 90 patients by the Kaplan-Meier method (Table 2).Table 2 and Figure 1A show that patients with TBL1XR1-negative expression displayed a longer OS than those with TBL1XR1-positive expression (P< 0.001). Moreover, TNM stage (P< 0.001) and lymph node metastasis (P= 0.047) were obviously related to the average survival time. Furthermore, the Cox proportional hazards model was used in multivariate analysis. As shown in Table 3, TBL1XR1 expression, TNM stage and lymph node metastasis were found to be significant independent prognostic factors for patients with PDAC, suggesting that TBL1XR1 expression is a risk factor for PDAC.
Enhanced expression of TBL1XR1 in PDAC tissues and cell lines
To investigate the possible role of TBL1XR1 in PDAC, we used IHC staining to investigate the relationship between TBL1XR1 expression and the clinicopathological features of the patients with PDAC (Figure 1B). IHC staining revealed that TBL1XR1 was mainly localized in the PDAC cell nucleus. The positive rate of TBL1XR1 staining in the tumor cells was approximately 70% (63/90) of the PDAC patients. Only 30% (27/90) of the patients possessed positive staining in the corresponding control tissues (Figure 1C,P< 0.001).
To determine the expression of TBL1XR1 in the PDAC tumor tissues and the adjacent normal tissues, we performed quantitative RT-PCR (qRT-PCR) and western blot assays. As illustrated in Figure 2A and B, enhanced expression of TBL1XR1 was observed in the PDAC tissues compared with the adjacent tissues. Then, we used MiaPaCa-2, Panc1, Aspc-1, and Capan1 cell lines to evaluate the role of TBL1XR1 in PDAC cell lines. TBL1XR1 expression at the mRNA and protein levels was examinedviaqRT-PCR and western blotting . We observed that TBL1XR1 was overexpressed in the PDAC cell lines, particularly in the Aspc-1 and Panc1 lines, at the mRNA (Figure 2C) and protein (Figure 2D) levels. Taken together, these data suggest that TBL1XR1 is upregulated in PDAC.
Effects of TBL1XR1 on the proliferation and apoptosis of PDAC cells
We performed CCK-8 and colony formation assays to further evaluate the effect of TBL1XR1 on the proliferation of PDAC cells. We knocked down the expression of TBL1XR1 in the Aspc-1 and Panc1 cells, and the knockdown efficiency is shown in Figure 3A and B. The CCK-8 assay showed that the downregulation of TBL1XR1 prominently suppressed PDAC cell viability compared with that of the control cells (P< 0.05, Figure 3C and D). Moreover, colony formation analysis showed that the colony formation capacity was significantly reduced in the TBL1XR1-knockdown cells compared to that of the control group (P< 0.05, Figure 3E). These results suggested that TBL1XR1 may play a vital role in PDAC cell proliferationin vitro. Furthermore, we investigated whether TBL1XR1 played a role in the proliferation of PDAC cellsin vivousing xenograft mouse models. As shown, the tumor volume and weight of the TBL1XR1-knockdown group were distinctly decreased compared to those of the control group (Figure 3F and G).
To explore the probable molecular mechanism of TBL1XR1 in PDAC cells, we detected the cell cycle and apoptotic profile of the Lv-shCTRL and Lv-shTBL1XR1 groups. As shown in Figure 4A, cell cycle analysis demonstrated that the cells treated with Lv-shTBL1XR1 exhibited cell arrest at the G0/G1 phase (Figure 4A). Moreover, we examined the protein expression of cell cycle-related regulatory genes to determine the impact of TBL1XR1 on the cell cycle by western blot assays. As depicted in Figure 4B, the protein expression levels of CDK2, CDC25A, or cyclin D1 in the LvshTBL1XR1 group were obviously lower than those in the control group. Therefore, we concluded that downregulation of TBL1XR1 induced PDAC cell cycle arrest at the G0/G1 phase by regulating the expression of cell cycle-related regulatory genes.
Furthermore, we performed an apoptosis assay to explore the effect of TBL1XR1 on apoptosis in PDAC cells. As shown in Figure 4C, an obvious increase in the percentage of apoptotic cells was observed in the TBL1XR1 knockdown group compared with the Lv-shCTRL group. Moreover, the knockdown of TBL1XR1 significantly enhanced theexpression of Bax and Bad and reduced the expression of Bcl-2 (Figure 4D). Taken together, these results suggest that TBL1XR1 might regulate PDAC cell apoptosis and cell cycle progression.
TBL1XR1 regulated the proliferation and apoptosis of PDAC cells via the PI3K/AKT pathway
To explore the potential mechanism by which TBL1XR1 influences proliferation and apoptosis in PDAC cells, we examined the expression changes of relevant proteins by western blotting. As shown in Figure 5A, the expression levels of p-AKT and p-PI3K were obviously reduced, while no significant effect on p-STAT3 and p-MEK was observed in the TBL1XR1 downregulation group, which indicated that TBL1XR1 might regulate PDAC cell proliferation and apoptosisviathe phosphatidylinositol 3-kinase/protein kinase B (PI3K/AKT) pathway. To determine whether TBL1XR1 knockdown-induced inhibition of proliferation was regulated by the PI3K/AKT pathway, we assessed the effect of the presence or absence of LY294002 (a PI3K/Akt inhibitor) on the TBL1XR1-overexpressing cells. Unsurprisingly, overexpression of TBL1XR1 promoted proliferation and suppressed apoptosis in PDAC cells, which was consistent with previous results. LY294002 treatment reversed the TBL1XR1-mediated promotion of proliferation and inhibition of apoptosis (Figure 5B-D). Moreover, LY294002 inhibited the TBL1XR1 overexpression-induced increases in Bcl-2 and decreases in Bad and Bax (Figure 5E). Therefore, we deduced that TBL1XR1 induces PDAC cell proliferation, cell cycle arrest and apoptosisviathe PI3K/AKT signaling pathway.
DISCUSSION
Although many studies have attempted to elucidate its pathogenesis, PDAC remains a deadly malignancy[19]. Hence, identification of efficacious early tumor markers for the early diagnosis and treatment of PDAC will have clinical value and significance.
TBL1XR1 (TBLR1) was first identified as a gene transcript in human CD34+CD38- cells; moreover, researchers discovered that TBL1XR1 has an F-box/WD40-repeatsequence[20]. A growing body of research has revealed that TBL1XR1 can play a vital role in tumorigenesis, invasion, metastasis, and the development of resistance to therapies[15,21]. Moreover, TBL1XR1 mRNA is highly expressed in many human tissues, such as thyroid, prostate and breast tissues[22], which indicates that TBL1XR1 may function as an oncogene. TBL1XR1 functions by activating many signal transduction pathways, such as Wnt-β-catenin, NF-κB, and Notch23. Nevertheless, it remains unclear how TBL1XR1 functions in the development of PDAC.
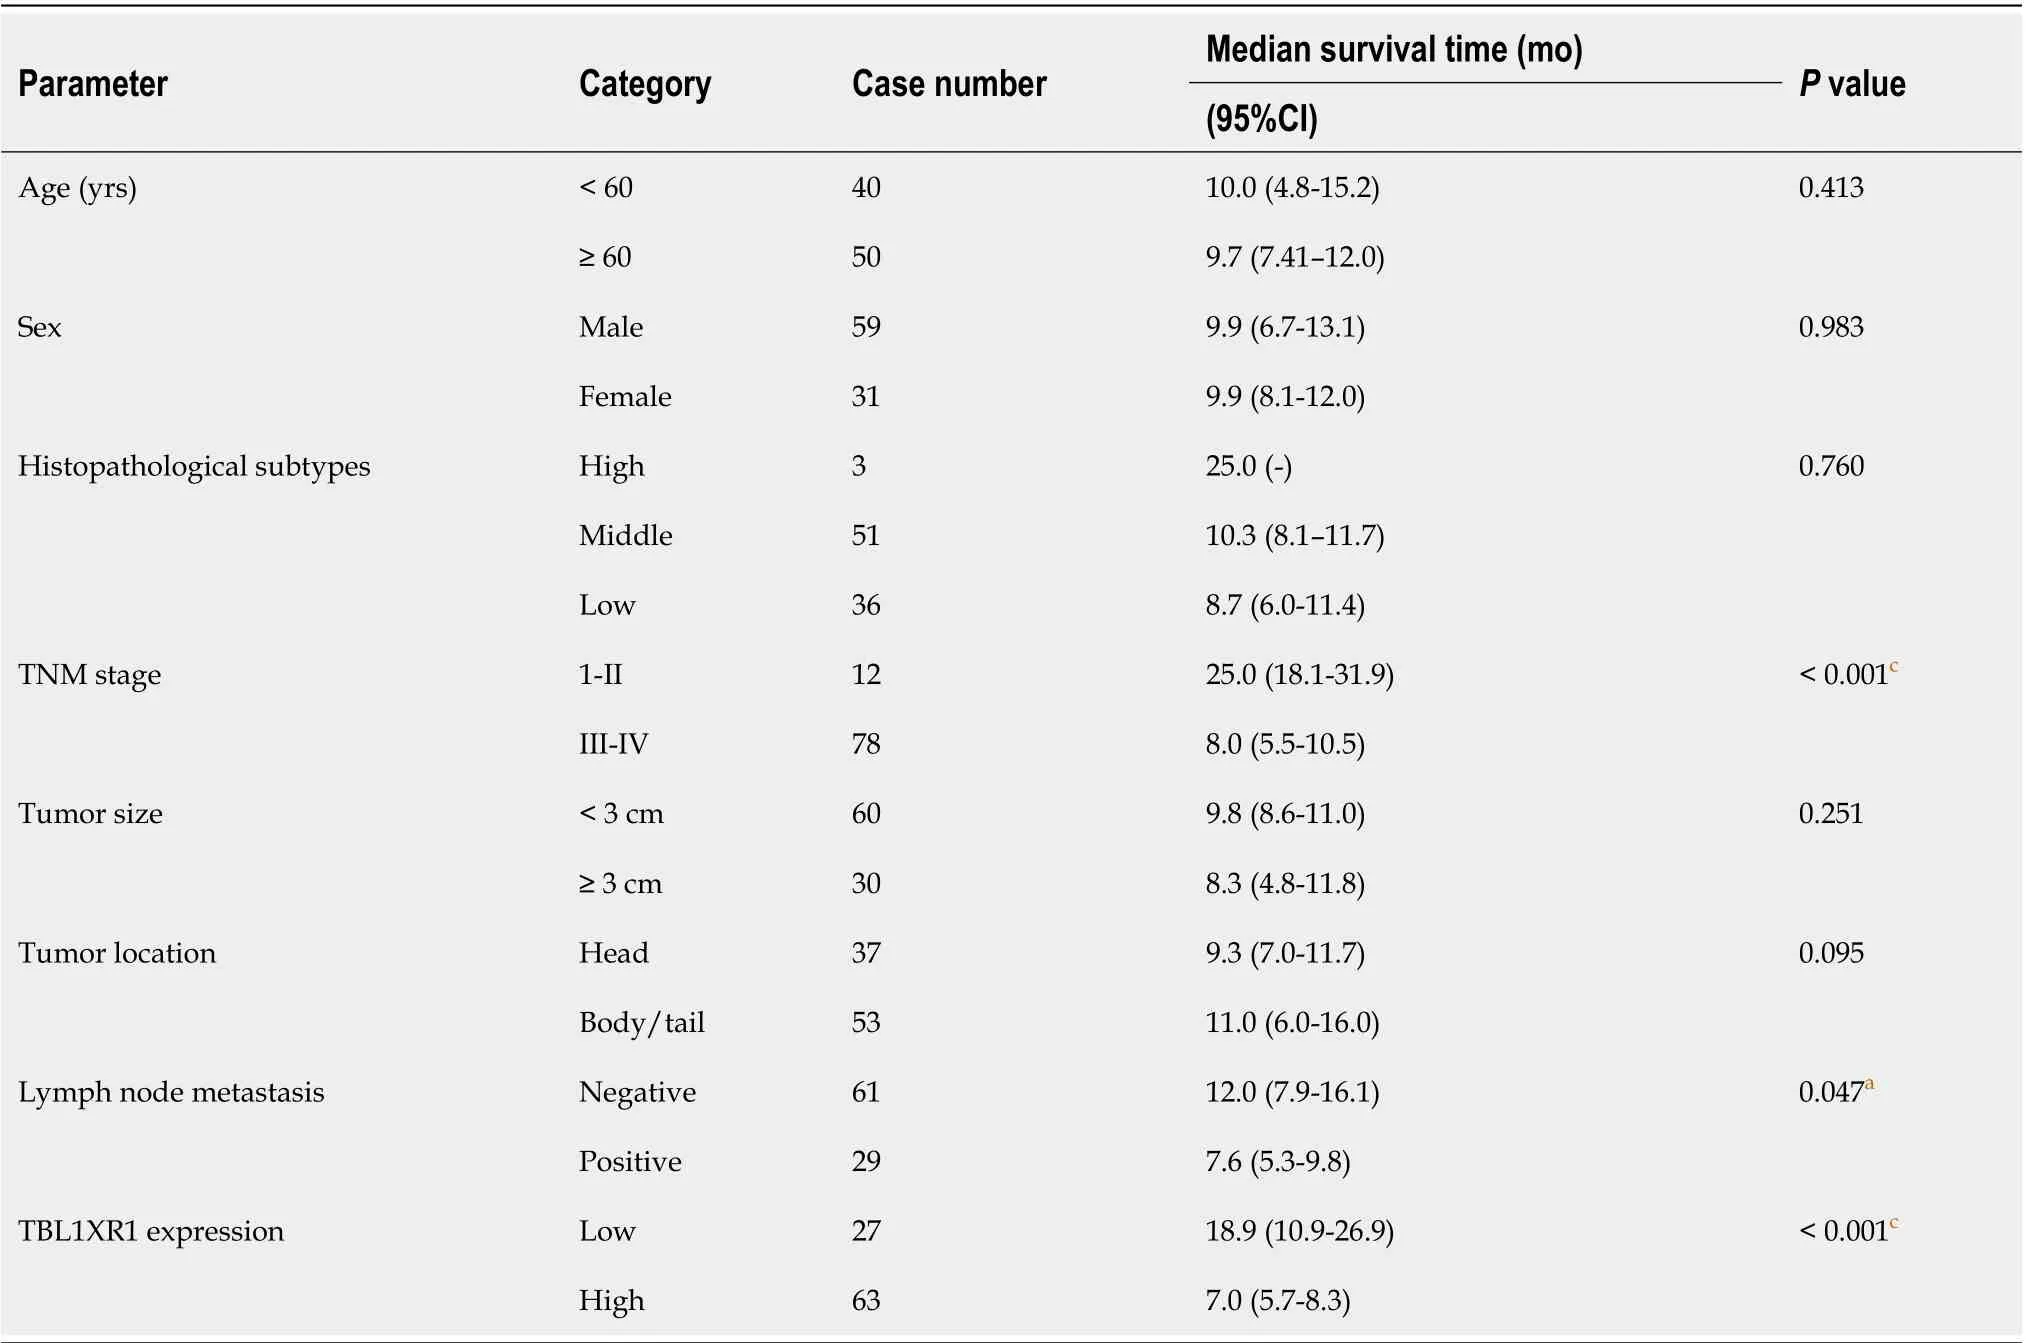
Table 2 Univariate log-rank analysis of overall survival
In this research, we discovered that the expression of TBL1XR1 was obviously enhanced in PDAC tissues compared with adjacent tissues. Moreover, we revealed that TBL1XR1 expression, TNM stage and lymph node metastasis were significant independent prognostic factors for patients with PDAC, suggesting that TBL1XR1 expression is a risk factor for PDAC. To further evaluate the function of TBL1XR1 in PDAC, we performed CCK-8 and colony formation assays, and the results showed that the downregulation of TBL1XR1 significantly suppressed PDAC cell proliferation. Moreover, we found that TBL1XR1 knockdown induced PDAC cell cycle arrest in G0/G1 phase and inhibited PDAC cell apoptosisin vitro. Additionally, the results of thein vivoanimal analysis were consistent with thein vitroanalysis, which indicated that TBL1XR1 might be a potential diagnostic target for PDAC.
The PI3K/AKT signaling pathway has a key impact on multiple cell processes, including cell growth, cell proliferation, angiopoiesis and survival, in both normal and tumor cells[23]. In our study, we found that TBL1XR1 can induce PDAC cell proliferation and inhibit PDAC cell apoptosis. However, whether the PI3K/AKT signaling pathway is involved in the TBL1XR1-induced promotion of PDAC cell proliferation and inhibition of apoptosis is unknown. Thus, we explored the potential mechanism by which TBL1XR1 influences proliferation and apoptosis in PDAC cells, and we found that inhibition of the PI3K/AKT pathway reversed the TBL1XR1 promotion of proliferation and inhibition of apoptosis, indicating that TBL1XR1 might play an important role in regulating PDAC cell proliferation and apoptosis. In addition, the activity of Akt could be regulated through S-nitrosylation at the kinase cysteine residues, and it was reported to be associated with reduced kinaseactivity[24,25], which provides us with another research direction. Overall, we illuminated the effect and mechanism of TBL1XR1 in human PDAC, and we believe that TBL1XR1 could be a promising diagnostic and therapeutic target for treating patients with advanced PDAC. Targeted therapy is an important aspect of precision therapy. We concluded that TBL1XR1 inhibitors might be promising therapeutic measures for PDAC; however, there are no inhibitors targeting TBL1XR1, which is worth investigating in the future.
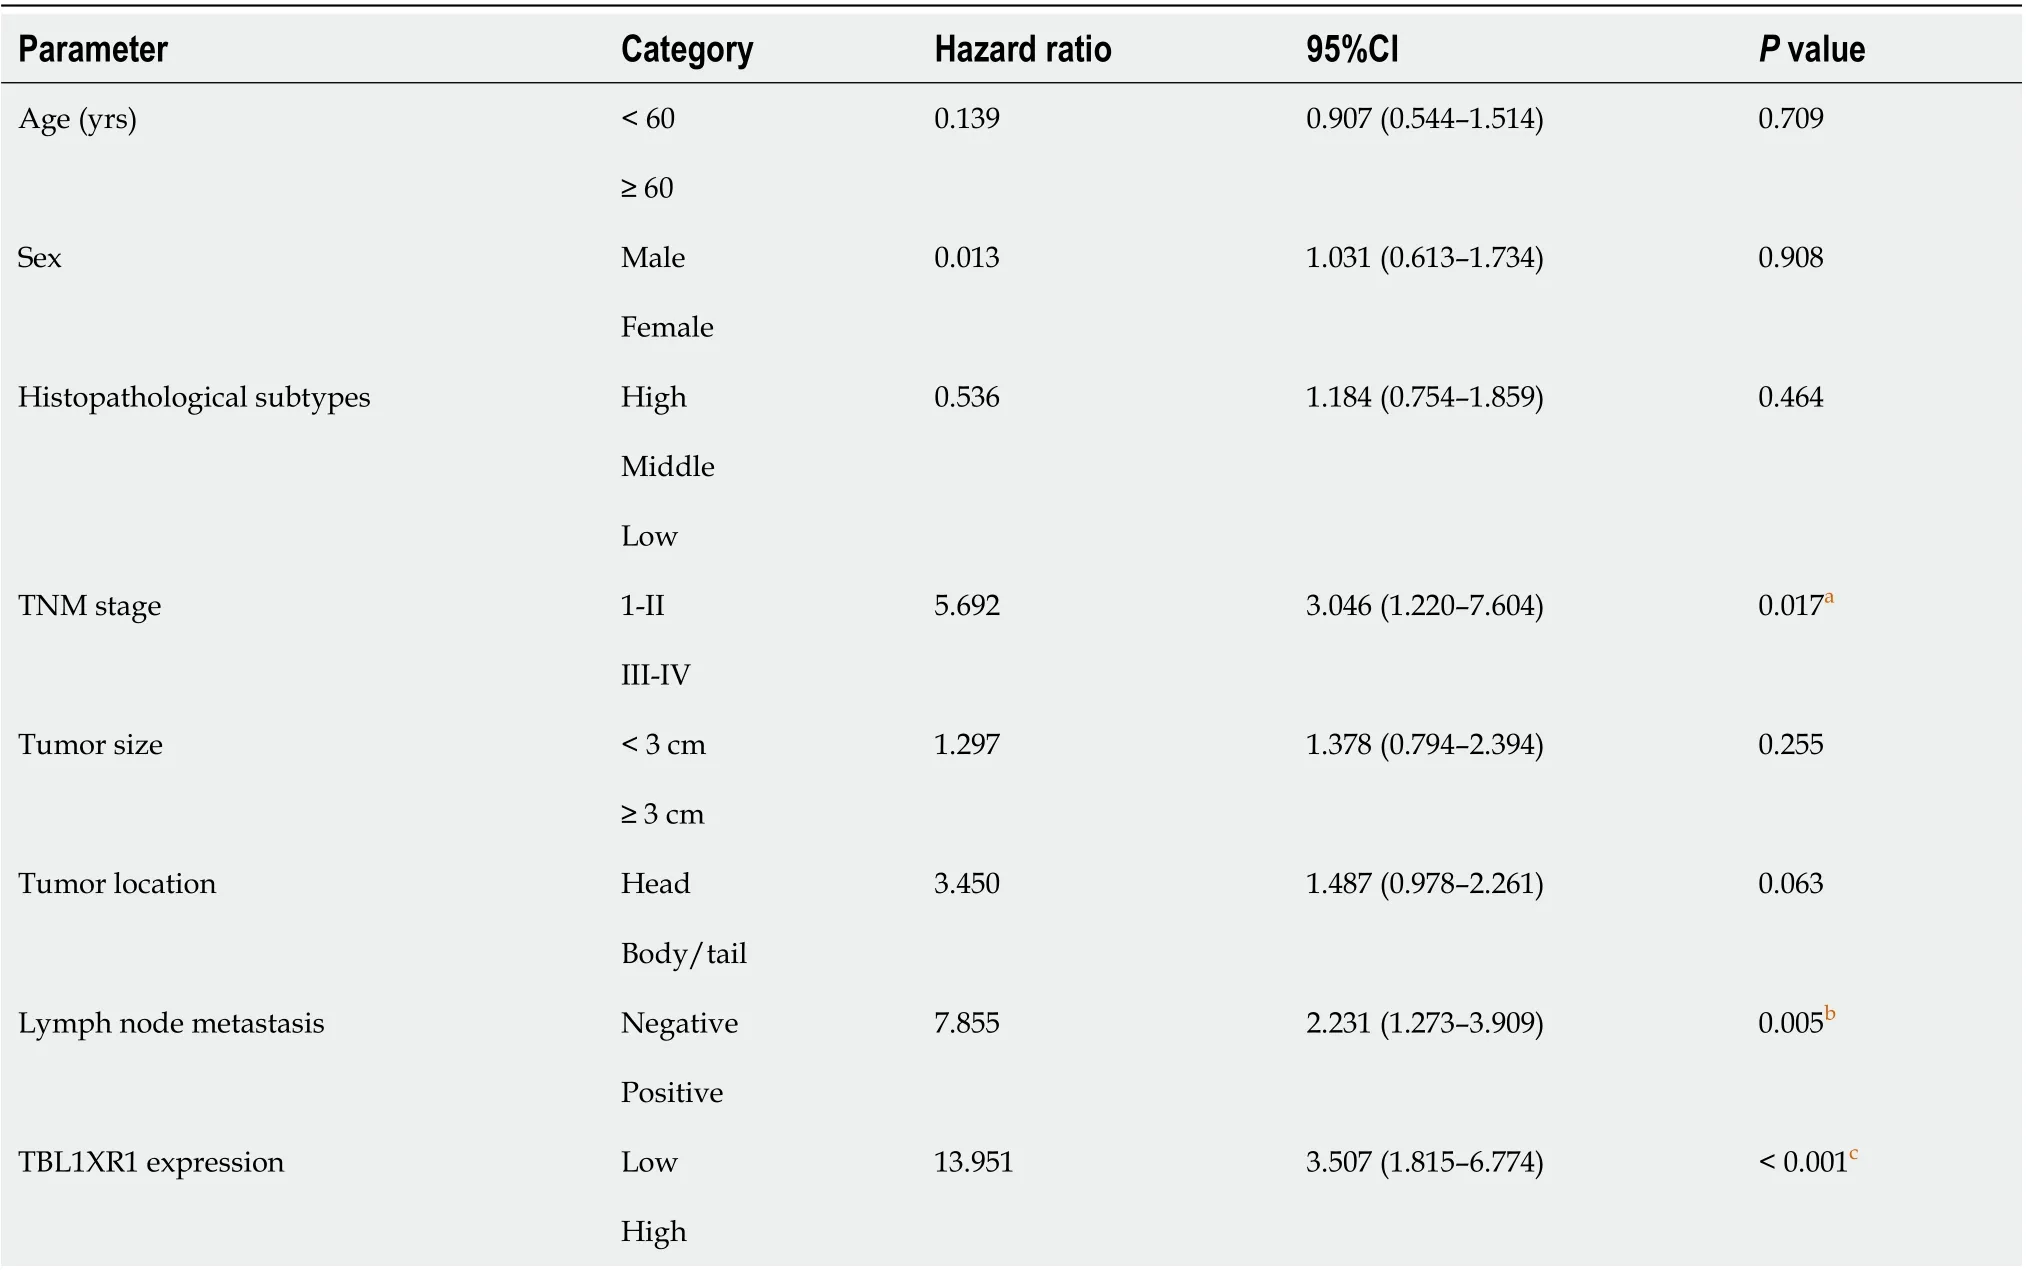
Table 3 Multivariate analysis of overall survival
In summary, our study showed that TBL1XR1 might regulate PDAC cell proliferation and apoptosisviathe PI3K/AKT signaling pathway. Therefore, TBL1XR1 may be a promising diagnostic and therapeutic biomarker for patients with advanced PDAC.
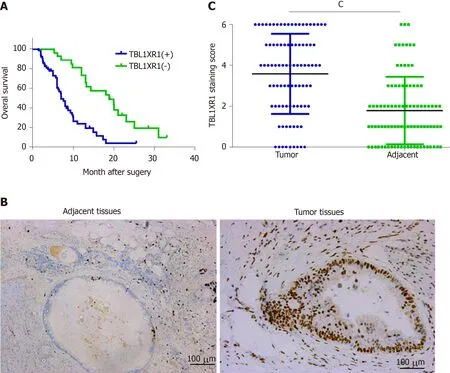
Figure 1 Clinicopathological significance of transducin (β)-like 1 X-linked receptor 1 expression in patients with pancreatic ductal adenocarcinoma. A: Kaplan–Meier plots of overall survival of pancreatic ductal adenocarcinoma (PDAC) patients with positive and negative transducin (β)-like 1 X-linked receptor 1 (TBL1XR1) expression scores; B: Negative and positive staining of TBL1XR1 in PDAC; C: The average staining scores of TBL1XR1 expression in PDAC tissues and adjacent tissues. cP < 0.001. Scale bar, 100 µm. TBL1XR1: Transducin (β)-like 1 X-linked receptor 1.
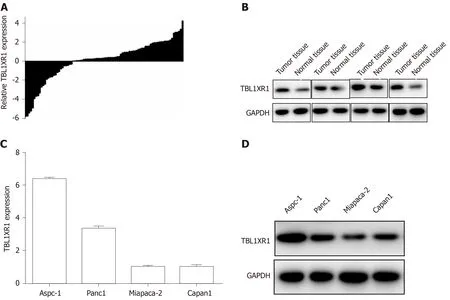
Figure 2 Enhanced expression of transducin (β)-like 1 X-linked receptor 1 in pancreatic ductal adenocarcinoma tissues and cell lines. A and B: The mRNA and protein expression of transducin (β)-like 1 X-linked receptor 1 (TBL1XR1) in pancreatic ductal adenocarcinoma tissues and adjacent nontumor tissues; C and D: The mRNA and protein expression of TBL1XR1 in pancreatic ductal adenocarcinoma cells. GAPDH: Glyceraldehyde-3-phosphate dehydrogenase; TBL1XR1: Transducin (β)-like 1 X-linked receptor 1.
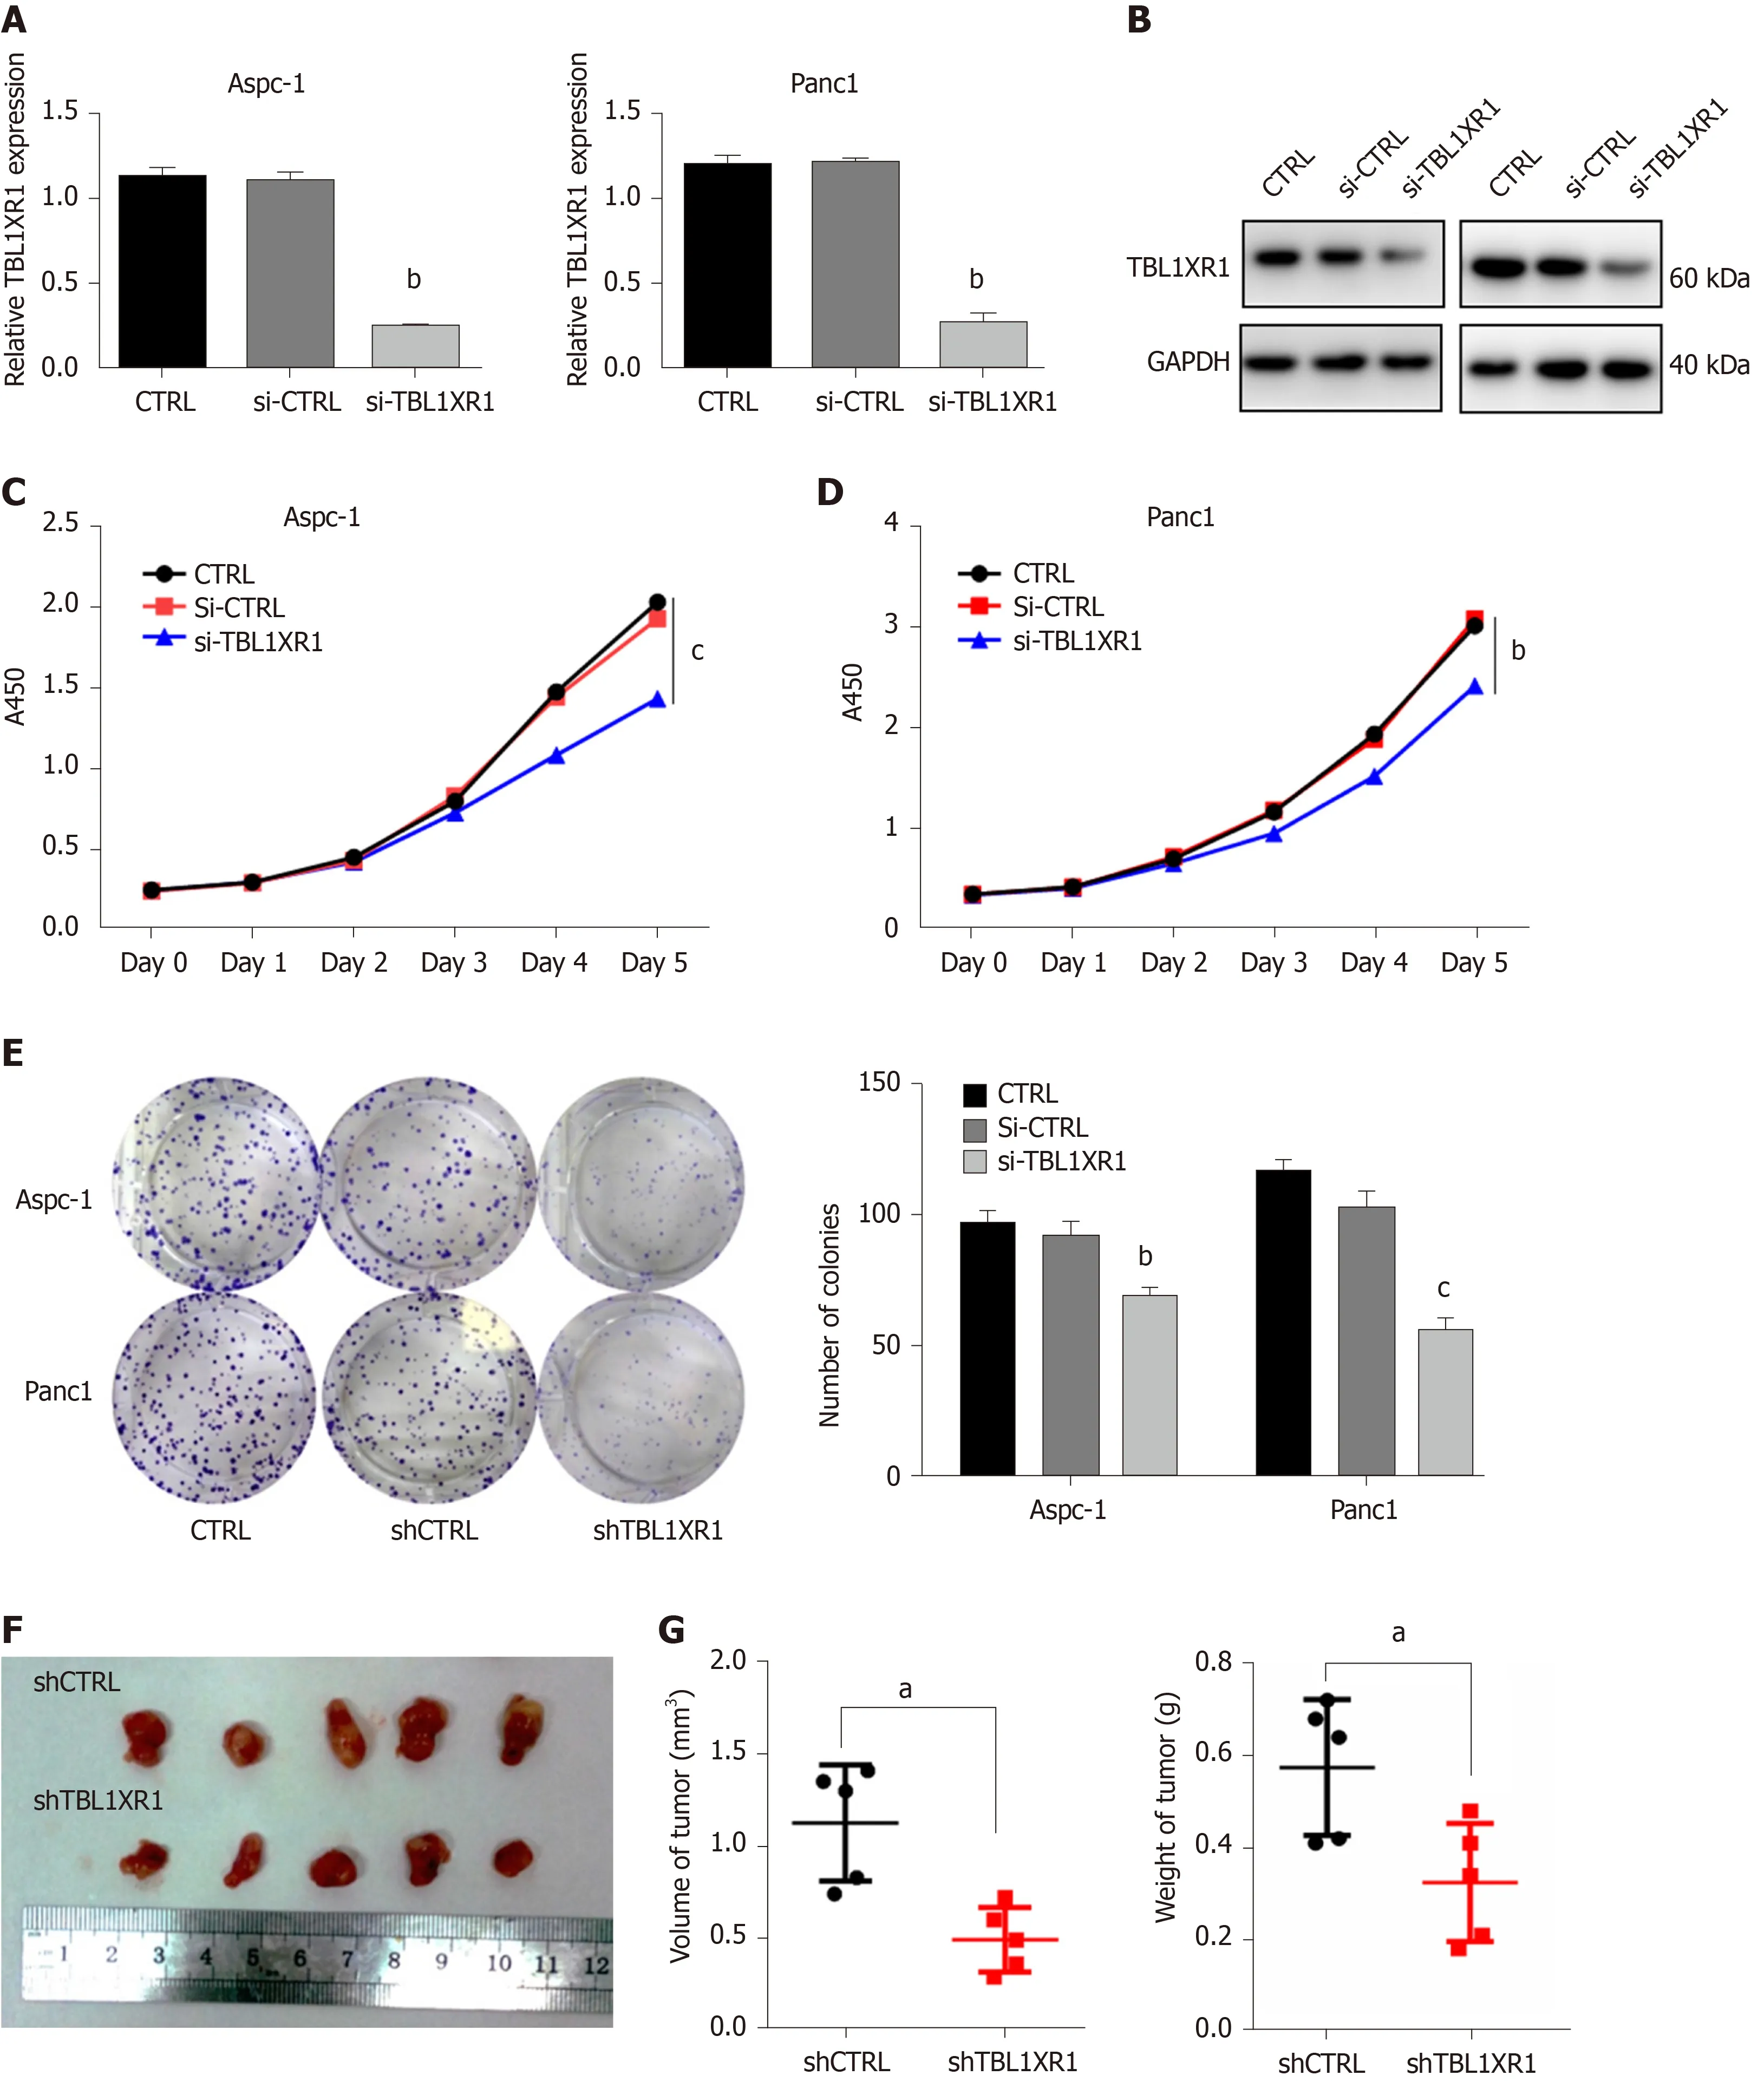
Figure 3 Transducin (β)-like 1 X-linked receptor 1 exhibited oncogenic properties in pancreatic ductal adenocarcinoma cell lines. A: The transfection efficiency of transducin (β)-like 1 X-linked receptor 1 (TBL1XR1) in pancreatic ductal adenocarcinoma (PDAC) cells by quantitative real-time PCR; B: The transfection efficiency of TBL1XR1 in PDAC cells by western blots; C and D: Cellular proliferation of untransfected or transfected Aspc-1 and Panc1 cells was measured using a CCK8 assay daily for 5 d; E: Aspc-1 and Panc1 cells were seeded at 500 cells/well, and the cells were allowed to form colonies. Colony numbers were counted and recorded; F: Mice were treated with Lv-shCTRL and Lv-shTBL1XR1 PDAC cells; G: Tumor volumes and weights were measured. aP < 0.05, bP < 0.01, cP < 0.001. GAPDH: Glyceraldehyde-3-phosphate dehydrogenase; TBL1XR1: Transducin (β)-like 1 X-linked receptor 1; CTRL: Control; Si-CTRL: CTRL siRNA; Si-TBL1XR1: TBL1XR1 siRNA; ShRNA: Short hairpin RNA; ShCTRL: CTRL shRNA; ShTBL1XR1: TBL1XR1 shRNA.
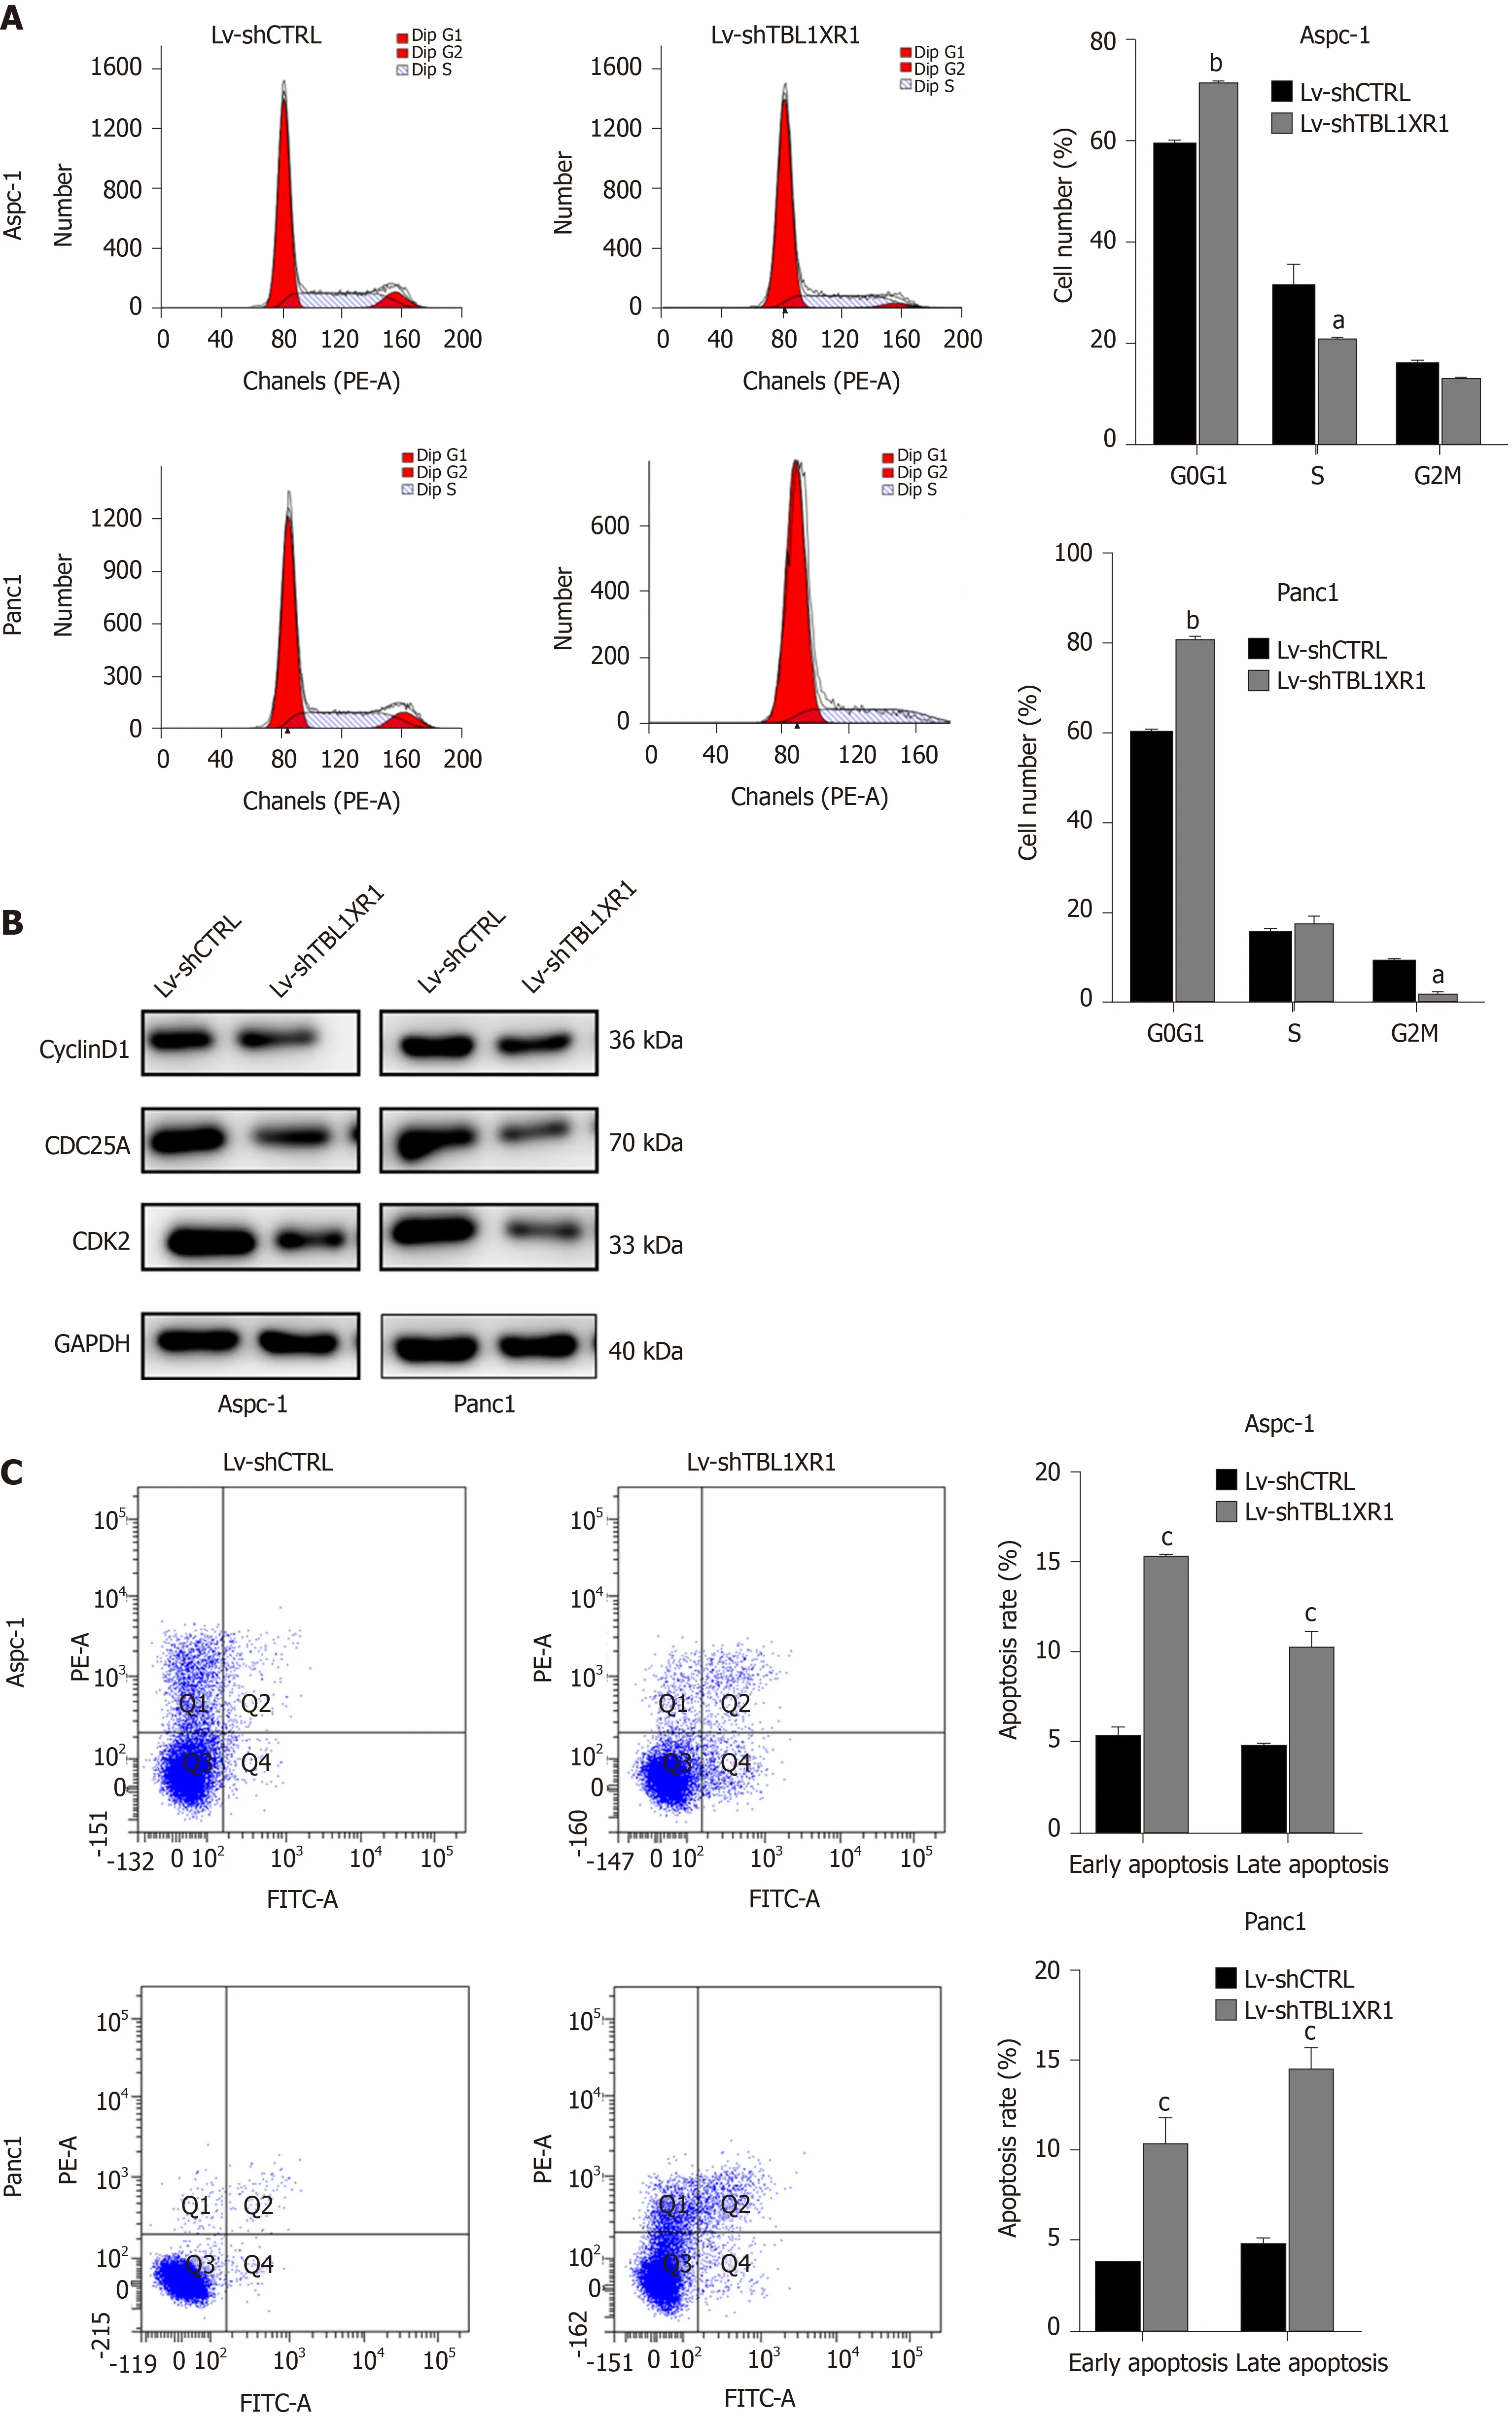
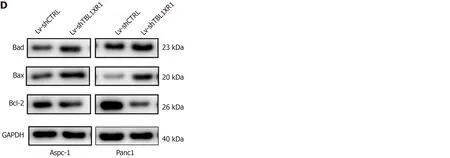
Figure 4 Effects of transducin (β)-like 1 X-linked receptor 1 silencing on cell cycle progression and apoptosis. A: The cell cycle phases of treated cells were evaluated by flow cytometry after transfection for 48 h. The X-axis indicates the different periodic distribution, and the y-axis indicates the number of cells. B: The protein levels of cell cycle regulators, such as CDK2, CDC25A and cyclinD1, were examined by western blotting analysis. C: Untransfected and transfected pancreatic ductal adenocarcinoma cells were analyzed by flow cytometry with annexin V–fluorescein 5-isothiocyanate/propidium iodide (PI) staining. The X-axis indicates annexin V-fluorescein 5-isothiocyanate, and the Y-axis indicates PI staining. Annexin V/PI+ represents necrotic cells, annexin V+/PI represents early apoptotic cells, and annexin V+/PI+ represents late apoptotic cells. D: The protein levels of bad, bax and bcl-2 were examined by western blotting analysis. aP < 0.05, bP < 0.01, cP < 0.001. GAPDH: Glyceraldehyde-3-phosphate dehydrogenase; TBL1XR1: Transducin (β)-like 1 X-linked receptor 1.
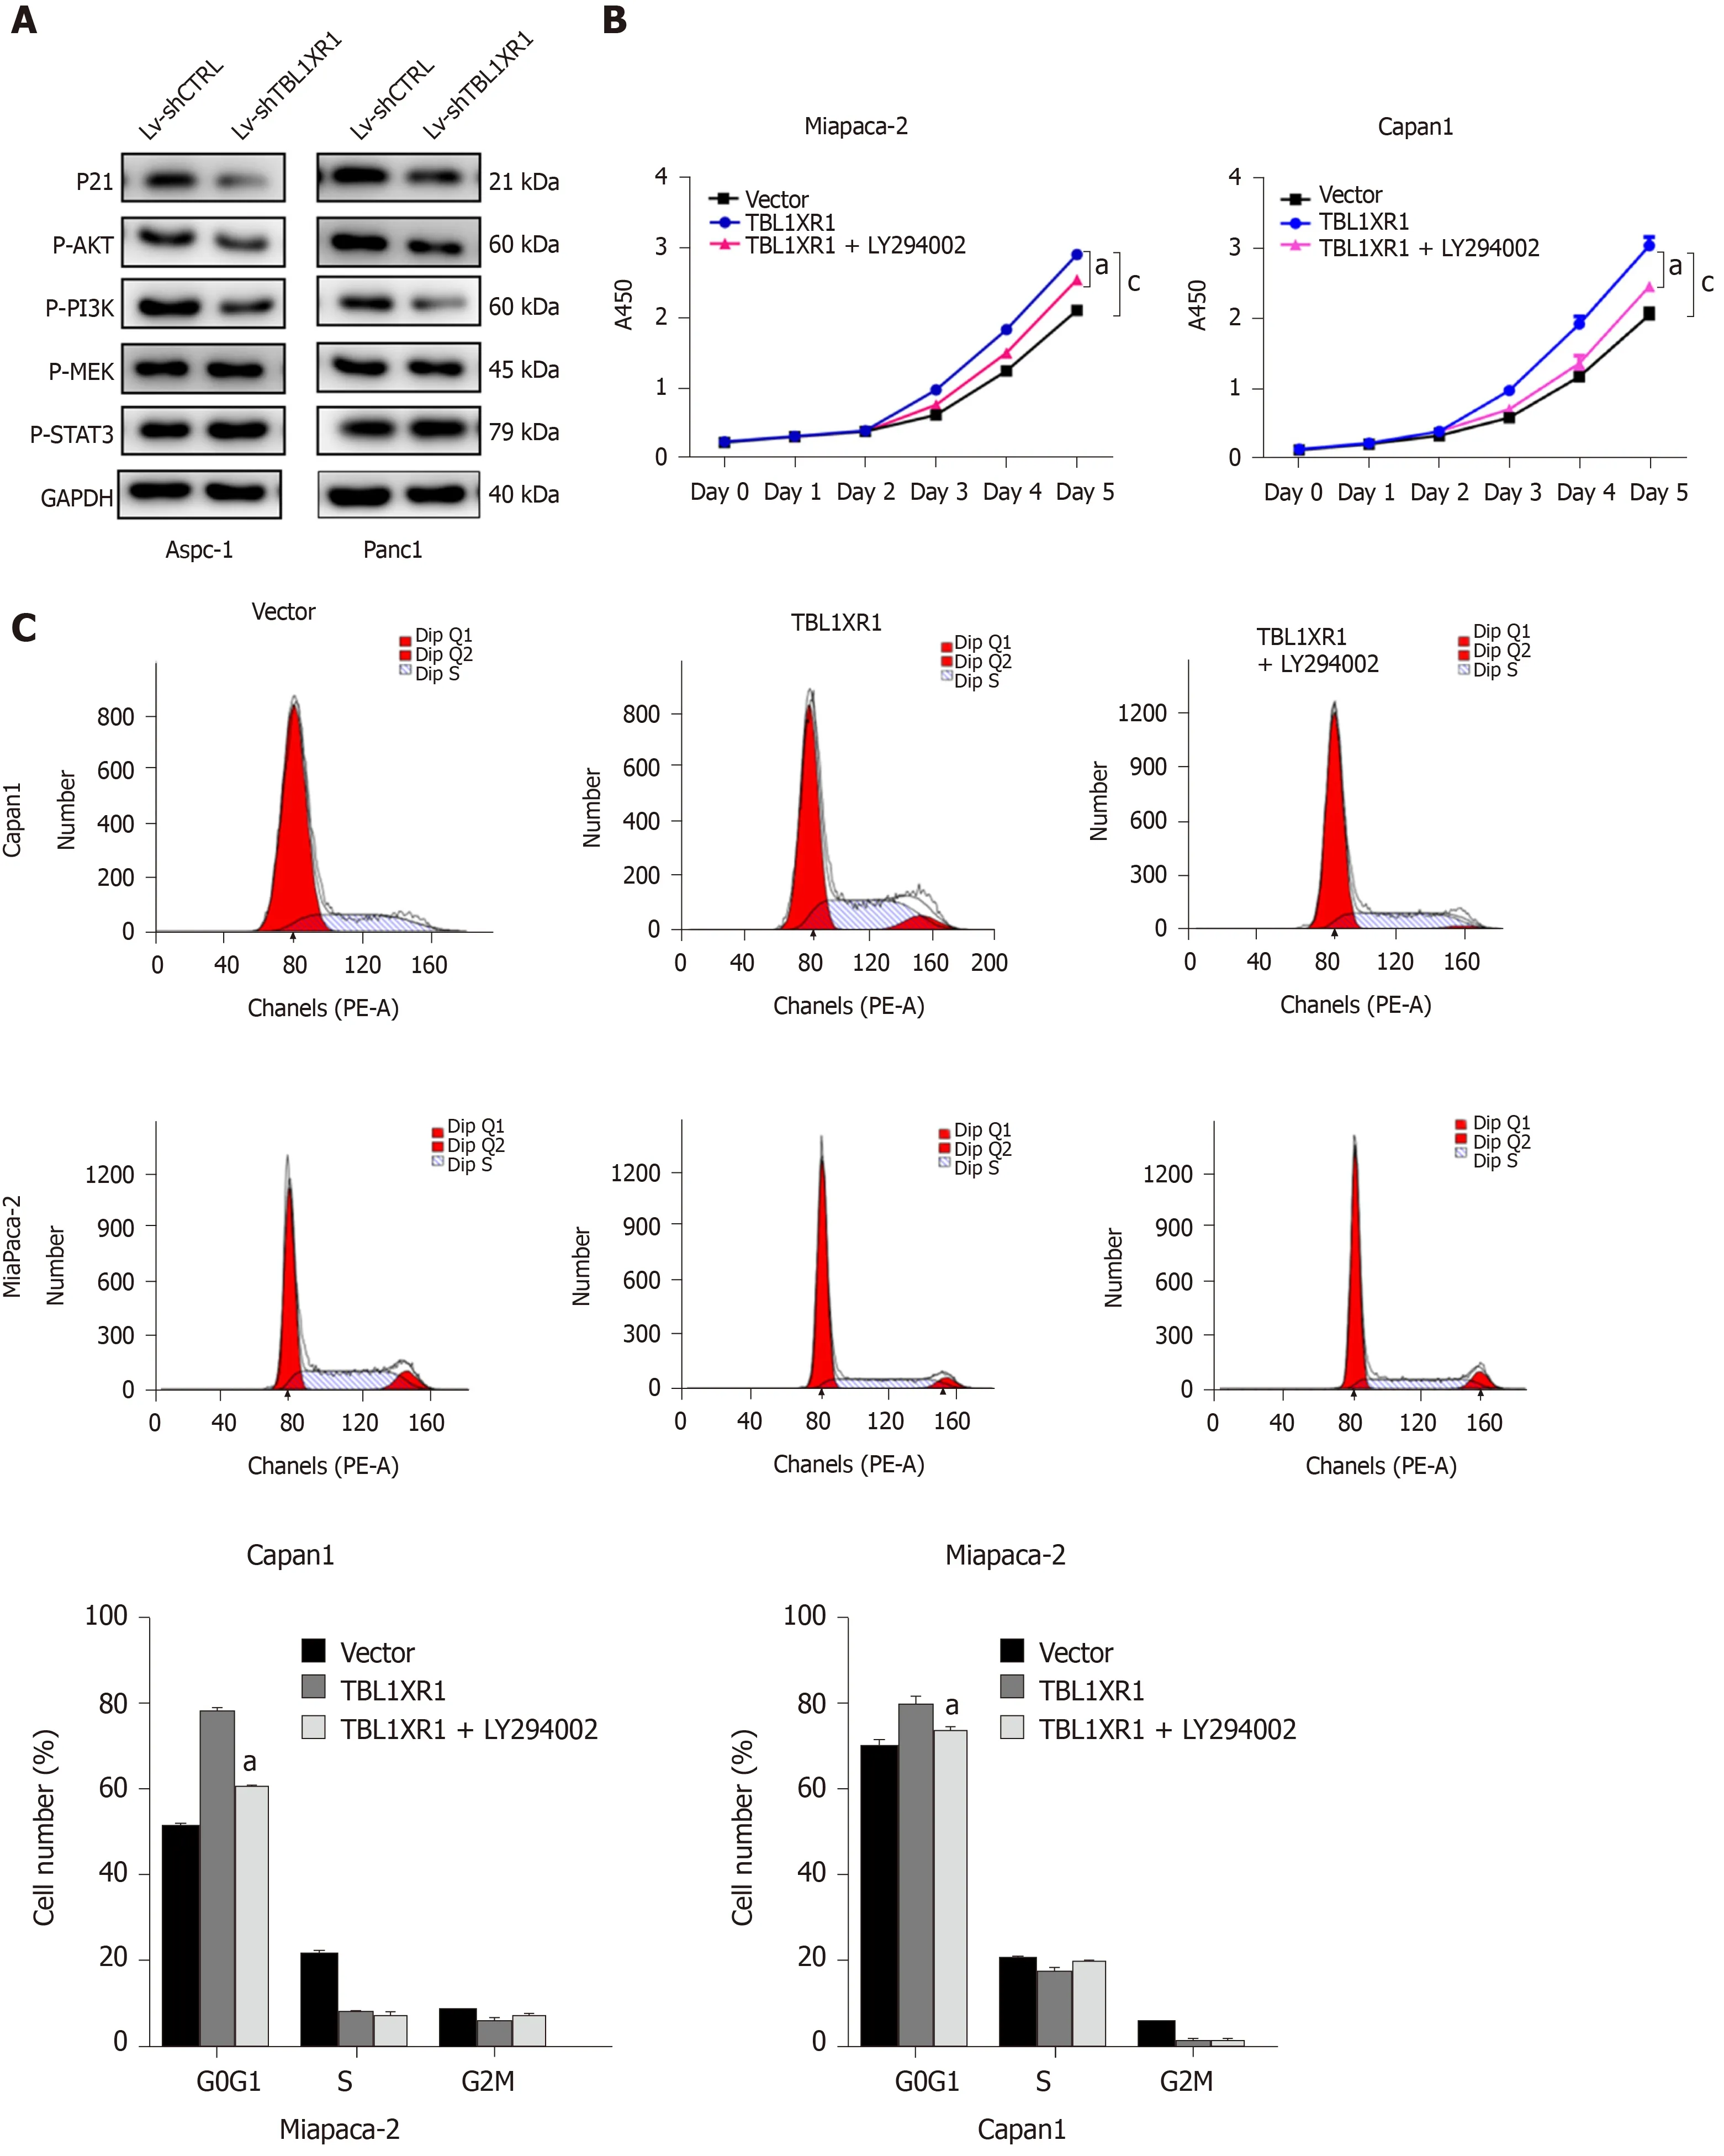
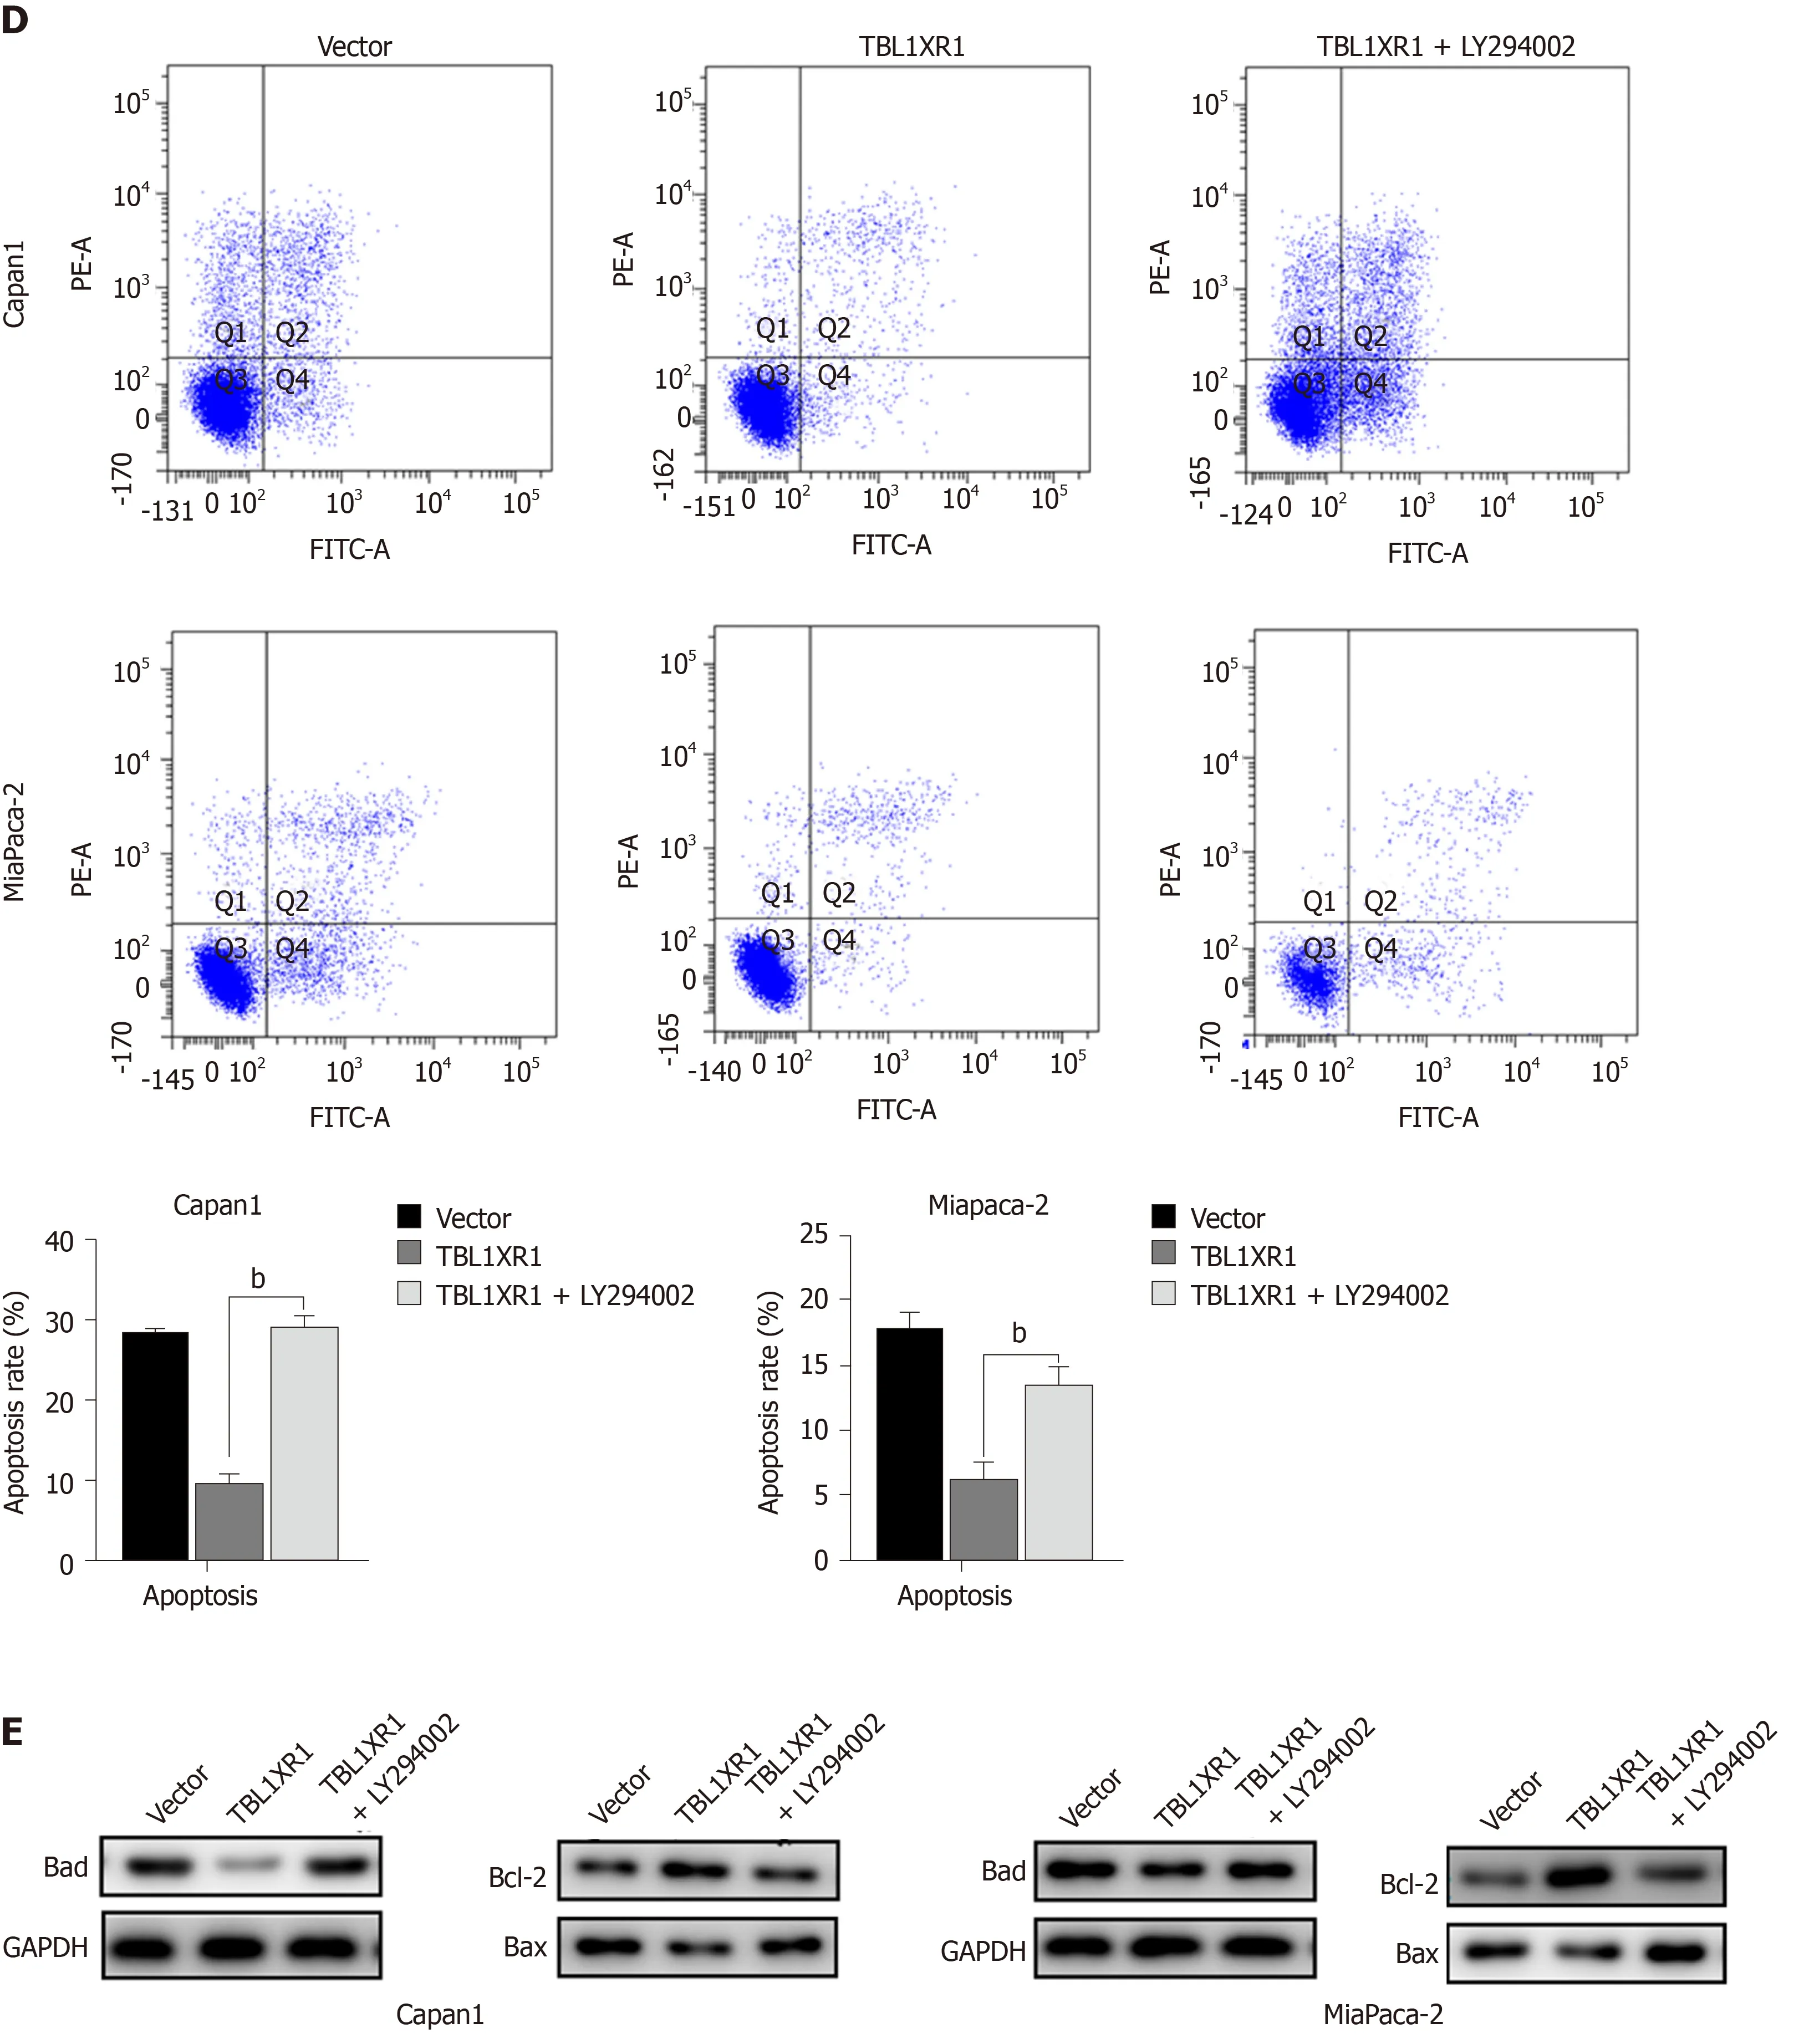
Figure 5 Transducin (β)-like 1 X-linked receptor 1 regulates phosphatidylinositol 3-kinase/protein kinase B signaling in pancreatic ductal adenocarcinoma cells. A: Western blot analysis of phosphatidylinositol 3-kinase/protein kinase B (PI3K/Akt) signaling-related proteins in both cell lines. GAPDH was used as a loading control; B: Cellular proliferation of pancreatic ductal adenocarcinoma (PDAC) cells treated with or without the PI3K/Akt pathway inhibitor LY294002 was measured using a CCK-8 assay daily for 5 d; C: Cell cycle phase analysis and apoptosis of PDAC cells treated with or without LY294002 were analyzed by flow cytometry. The X-axis indicates the different periodic distributions, and the Y-axis indicates the number of cells. D: Apoptosis analysis of PDAC cells treated with or without LY294002 was analyzed by flow cytometry. The Y-axis indicates V–fluorescein 5-isothiocyanate, and the Y-axis indicates propidium iodide (PI) staining. Annexin V/PI+ represents necrotic cells, annexin V+/PI represents early apoptotic cells, and annexin V+/PI+ represents late apoptotic cells. E: Western blot analysis of PI3K/Akt signaling-related proteins in PDAC cells treated with or without LY294002. GAPDH: Glyceraldehyde-3-phosphate dehydrogenase; TBL1XR1: Transducin (β)-like 1 X-linked receptor 1.
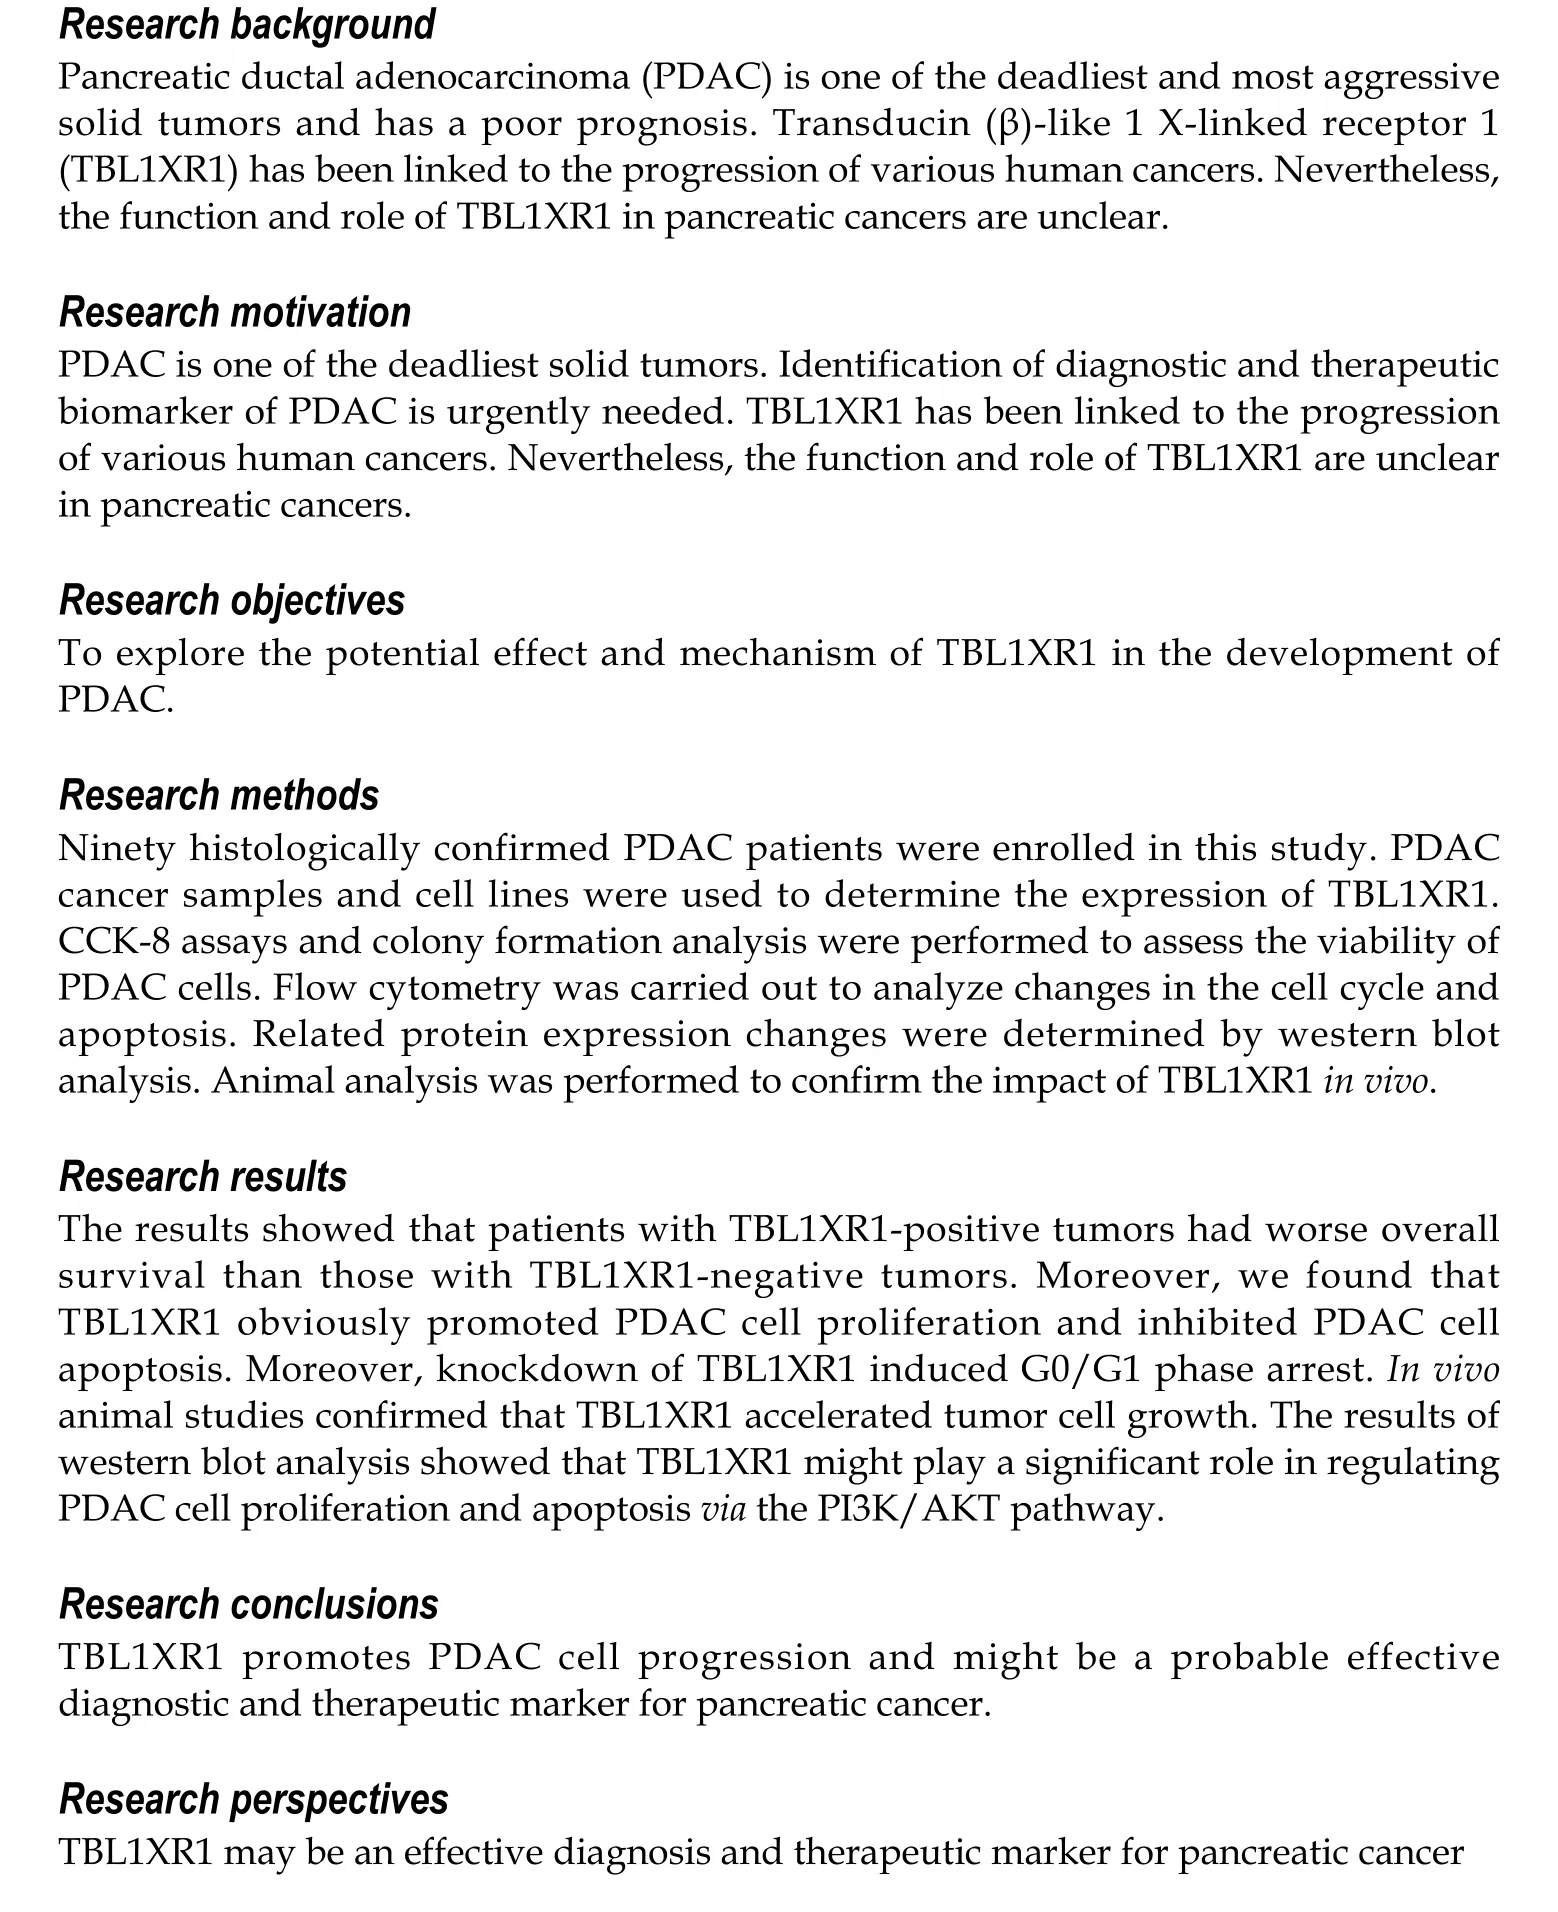
ARTICLE HIGHLIGHTS
杂志排行

World Journal of Gastroenterology的其它文章
- Development of innovative tools for investigation of nutrient-gut interaction
- Practical review for diagnosis and clinical management of perihilar cholangiocarcinoma
- Management of nonalcoholic fatty liver disease in the Middle East
- Quality of life in patients with gastroenteropancreatic tumours: A systematic literature review
- Functionality is not an independent prognostic factor for pancreatic neuroendocrine tumors
- Risk factors associated with inflammatory bowel disease: A multicenter case-control study in Brazil