Estimating shoreline response to sea level rise:the equilibrium model
2020-08-12LIWenshanGAOTongWANGHuiDONGJunxingLIHuanXUHaoZUOChangsheng
LIWenshan,GAO Tong,WANG Hui,DONG Junxing,LIHuan,XU Hao,ZUO Changsheng
National Marine Data and Information Service,300171 Tianjin,China
Abstract:Potential sandy coast erosion and socio-economic impacts under sea level rise scenarios as well as socio-economic pathways were assessed in Liaodong Bay.Results show that sea level is projected to rise by 20-43 cm in Liaodong Bay by 2100.And dry land loss increases in all sea level rise scenarios,with the maximum loss of 32.1 km2 in 2100 under RCP8.5.Coastal erosion results in forced migration,and the forced migration is higher under SSP3 than other pathways due to its higher population growth rate,reaching the highest of 3.1×10⁴ under SSP3/RCP8.5 in 2100.Moreover,the differences of forced migration among all scenarios increas after 2050,and the migration increasing rates tend to decrease under RCP2.6 and RCP4.5.The maximum economic loss due to coastal erosion will reach 8.05 billion yuan under SSP5/RCP8.5 in 2100,in which land loss cost is two order less than migration cost,and the share of total erosion-induced economic loss in local GDP varies from 1.12‰to 4.76‰under all scenarios,which is an important indicator to draw local government's attention to take measures such as beach nourishment,especially for tourist beaches.Optimally,it is recommended by cost-benefit analysis to carry out nourishment mainly on beaches with high value,while there is no need for nourishment in areas where erosion impacts are negligible.
Keywords:sea level rise,coastal erosion,equilibrium profile,beach nourishment,socio-economic loss
1 Introduction
Sea level rise is one of the most adverse consequences of global warming[1].The global sea level is very likely to have rised by 0.19 meters during 1901-2010[2].Accelerated ice-mass loss from the ice sheets and ocean warming are the main causes of global mean sea-level rise from decades to centuries[3,4].Consistent with scientific understanding,global sea level rise was none uniform over the last century[5-7],which was more rapidly in the western Pacific,especially along China coast.From 1980 to 2019,the rate of coastal sea level rise was 3.4 mm/yr,higher than the global average of the same period[8].Sea level rise has become one of the eight key risks in future climate change scenarios,and it is projected to rise at an increasing rate through the 21stcentury[9],bringing increasing concerns about its impacts on coastal zones[10,11].
Coastal erosion has been a global problem[12-15]which is thought to impact 70%of the Earth’s sandy beaches[16,17].The erosion process usually contains a range of processes that shape coastal morphology,including coastal cliff collapse and sediment transport,and the time scale may vary from a few days to decadal years.It is triggered by physical drivers including sea level rise,extreme sea level events,diminishing of sand supply from river inlets[18],and human activities[19].The effects of sea level rise on shorelines recession have been highlighted during the last two decades.China has a long coastline suffering from serious coastal erosion,especially for sandy coasts in Liaodong Bay.It is of great significance to scientifically assess the coastal erosion and potential impact under the future sea level rise scenarios in Liaodong Bay,so as to serve the local integrated coastal zone management and marine disaster mitigation.
Previous studies assessed coastal erosion from local to regional scale[20,21],and some took socio-economic impacts into account[22-24].But there are still challenges in lacking of resolved shoreline change data as well as tide gauge observing data.The Bruun rule,named by Schwartz[25],has been elegant in its simplicity in predicting long term shoreline retreat due to sea level rise[26-28].Based on long-term sea level observation and Sea Level Rise Impact Investigation Project(SLRIIP)data in China,this paper evaluated the potential coastal erosion and economic loss in sandy coasts of Liaodong Bay under different Representative Concentration Pathways(RCPs)and shared socio-economic pathways(SSPs).The cost-benefit analysis of coastal nourishment was also assessed.
The studied area are located both at west and east coasts of Liaodong Bay,with 17 segments and a total length of 336.4 km(Fig.1).West coast of Liaodong Bay was divided into 12 segments,with a length of more than 140 km.The east part was divided into 5 segments,and the total length is about 196 km.There are 16 major tourist beaches in the coastal areas of interest.As reported by previous studies[29,30],the coast of the Liaohe delta on top of the Liaodong Bay is accretive these years,which was not considered in the present work.
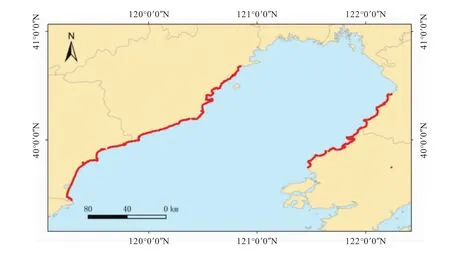
Fig.1 The studied area in red line along Liaodong bay
2 Data and method
2.1 Data
Sea level data along the Liaodong coast is from tide gauge stations in China Ocean Observation Network,and the time range is from 1980 to 2017.Long time sea level data series are sometimes not uniform due to the influences of site mitigation,equipment change,land subsidence,change of natural environment and other factors.So all sea level data was revised[31]first to guarantee its uniformity and stability,which is crucial to the reliability of assessment results.Coastal status,beach profiles and tourist beach data along the Liaodong coast were derived from the Sea Level Rise Impact Investigation Project(SLRIIP)operated by the State Oceanic Administration of the People’s Republic of China since 2009[1].Shoreline data was primarily obtained from the GSHHG highresolution(version 2.3.6)product released by NOAA,which was then modified using the investigation data from SLRIIP.
2.2 Method
Sea level rise scenarios on coast of Liaodong Bay were projected utilizing ensemble projection method[32].There are several approaches in predicting direct shoreline erosion under sea level rise scenarios.Previous studies used historical data extrapolation analysis[33],empirical orthogonal function decomposition method[34],Monte Carlo probability analysis method[35].But they are usually restricted by historical data length and completeness.In the present study,the two-dimensional Bruun equilibrium profile model,one of the most commonly used models to determine the impact of sea level rise on the coastline,were employed for coastal erosion assessment.The model is generally applicable to a flat sandy shore with a small gradient of coastal sediment transport,and its basic assumptions are:(a)Cross-shore profile within the closed depth perpendicular to the coastal direction is a dynamic profile and is in a state of equilibrium profile under specific wave conditions.The redistribution of sediment only exists inside the dynamic profile,and the depth of closure usually refers to the depth of the boundary water that affects the sediment transport in the offshore direction.(b)In case of sea level rise,the sediment in the dynamic profile moves offshore,the upper part of the profile is eroded,and the lower part is silted,thereby reaching a new equilibrium profile state.(c)The amount of sediment erosion in the active profile equals the amount of sediment expected in the offshore direction.(d)The seabed rise associated with sedimentation balances the value of sea level rise.The sea level rise induced shoreline retreat can be calculated as:

whereΔX is the shoreline retreat induced by sea level rise,ΔS is relative sea level rise,W*is the length of active cross-shore profile,h*is the closure depth,and B is the distance between the berm with initial sea level.(h*+B)/W*is usually defined as beach shape parameter,varies between 0.01-0.02.
The area of total erosion is then calculated as:
whereβis coefficient varies from 0 to 1,and Liis the corresponding beach length.
The slopes of cross-shore profiles were calculated from etopo2 bedrock data on GIS platform,and modified using 18 in-situ investigation profiles from SLRIIP.Latest statistics of population,GDP and annual income were adopted from National Statistic Administration(http://www.stats.gov.cn/)to evaluate potential socio-economic impacts induced by dry land loss.Gridded(1 km×1 km)population and GDP data were also used from Data Center for Resource and Environmental Sciences,Chinese Academy of Science.Shared socio-economic pathways(SSPs)were utilized to predict potential population,GDP and income growth.The migration cost was derived from the amount of land loss and population density in coastal areas.Migration cost is three times of annual income,which is reasonable and used by previous studies[36].
3 Results and Discussion
3.1 Sea level change
Analysis results show that sea level rise is generally fluctuating in Liaodong Bay.From 1980 to 2017,the sea level rise rate along the coast of Liaodong Bay was 3.0 mm/year,which was lower than the national average for the same period(3.3 mm/year).The sea level rise rate was higher on the east coast of Liaodong Bay,which was 3.8 mm/yr at Wafangdian,followed by Yingkou.The sea level rise rate of the west coast of Liaodong Bay was relatively smaller,which was 2.7 mm/yr at Huludao,and the rise rate at Qinhuangdao was the lowest,1.5 mm/yr.Significantly,the sea level in Wafangdian and Huludao has been remaining high in the past 6 years since 1990.Except for rising trend,the sea level change in Liaodong Bay has significant oscillation periods at multiple time scales.The results of Morlet wavelet transform analysis on sea level series after removing linear trend showed that the coastal sea level change on Liaodong Bay coast have significant periods of 2-3a,6-7a,11a and quasi 19a.The 2-3a cycle is related with nearshore hydrology and meteorological variation;the 6-7a cycle is related to the ENSO phenomenon;the quasi 11a cycle reflects the change of sea level in China's coastal areas under the influence of sunspots;the 19a cycle is the tidal astronomical tide cycle,reflecting the change of lunar declination,also known as the intersection tide.The oscillation of 6-7a and quasi 19a was most significant on Liaodong Bay coast,with amplitudes of more than 1.5 cm(Fig.2).
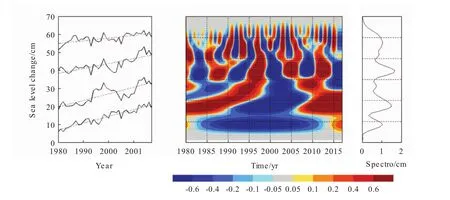
Fig.2 Sea level change(left)and wavelet transform result(right)of representative stations on Liaodong Bay
Sea level rise projections under RCPs from Wang(2018)were adopted[32]in the present study.Results show that the potential magnitude of sea level rise in the 2100 is 20 cm-48 cm(relative to the mean sea level in 1986-2005)under RCP2.6-RCP8.5.
3.2 Dry land loss
Dry land loss is defined as sea level rise induced erosion.Erosion potentials and total dry land loss were calculated in all segments from 2010 to 2100 in Liaodong Bay.Results show that accumulated dry land loss will increase till 2100 under all sea level rise scenarios.For the sea level rise scenario under RCP2.6,the total dry land loss inn studied area is 9.3 km2in 2050 and 19.4 km2in 2100.For the sea level rise scenario under RCP8.5,the total dry land loss will reach 11.0 km2in 2050 and 32.1 km2in 2100.On decadal scale,the rate of dry land loss rate showed a slight fluctuation trend,but tends to decrease under RCP2.6,and increase under RCP4.5 and RCP8.5(Fig.3).
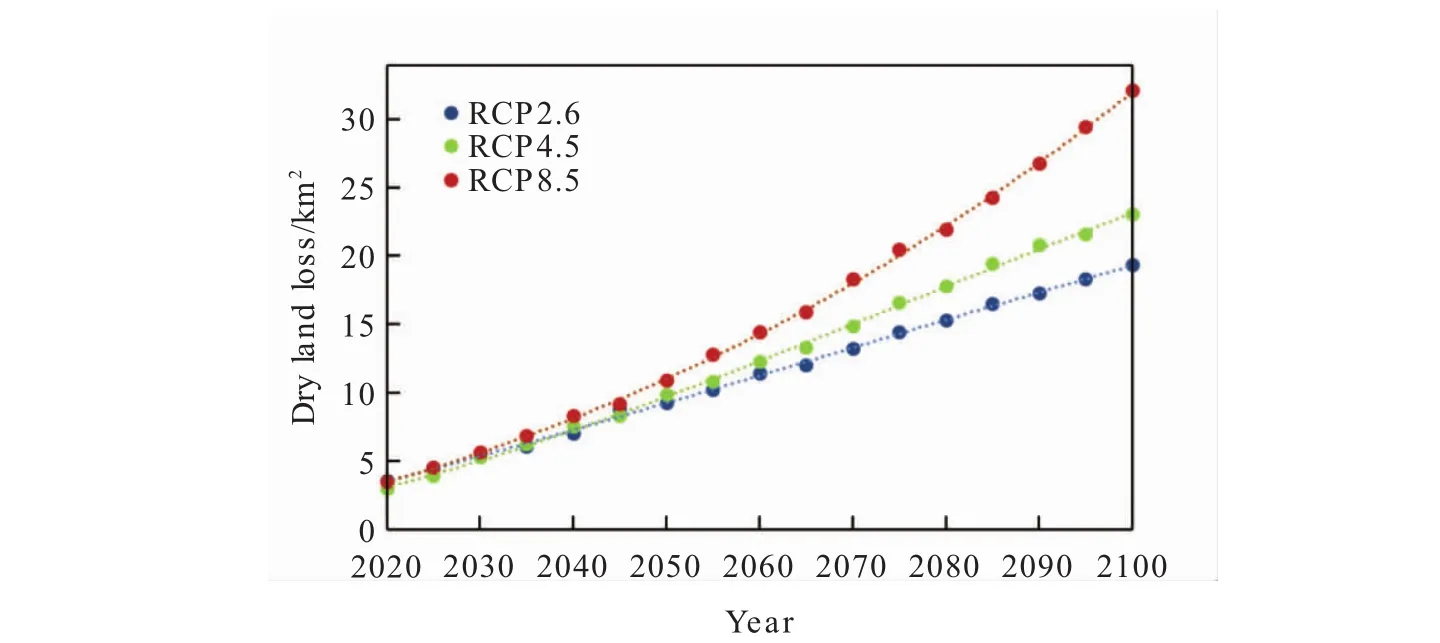
Fig.3 Dry land loss of the studied area under different sea level rise scenarios
3.3 Forced migration
People living in coastal zone will be forced to migrate due to dry land loss.The total migration is derived by summing up migration amount in each segment,which is related with area of land loss and population density.Reasonable assumptions was made that the relative spatial density of population remains unchanged but the total number will growth with time,while the population growth rate of Liaodong Bay in the future is consistent with the national average.Thus we got total migration under various groups of RCPs and SSPs.For all sea level rise scenarios,the socio-economic development scenarios(SSP1-SSP5)correspond to small differences in population migration during 2020-2030.After 2040,however,the difference of forced migration gradually increases.For RCP2.6/8.5,the SSP3 scenario corresponds to the largest population migration,and the SSP4 scenario is related with the least migration.The range of forced migration is predicted to be 9 929-18 388(RCP2.6),11 829-21 905(RCP4.5)and 16 489-30 534(RCP8.5)respectively in 2100(Fig.4).
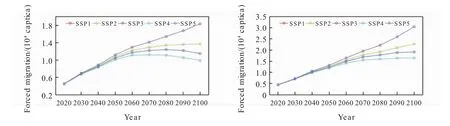
Fig.4 Forced migrations due to dry land loss under RCP2.6(left)and RCP 8.5(right)
3.4 Economic loss
Potential economic loss is composed of dry land loss cost and migration loss cost.On one hand,dry land loss cost is derived based on land use status,and it is assumed that land loss are for agricultural use only,and land with higher value will transfer to agricultural land due to erosive threat.Besides,land use and land cover change(LUCC)will lead value change[37].Agricultural service value reported by Xie[38]was used,but landuse scenarios and changes in economic value are not considered in this study.The total land loss cost is positively correlated with sea level rise.Results show that land loss cost will in increase under all scenarios in the 21stcentury,while the differences will amplify after 2050.For sea level rise scenario of RCP2.6,the potential dry land loss cost is 5.7 million yuan in 2050 and 11.8 million yuan in 2100,while for sea level rise scenario of RCP8.5,the potential dry land loss cost is 6.7 million yuan in 2050 and 19.7 million yuan in 2100.On the other hand,people living in coastal areas have to migrate inland due to land loss.The migration cost does not include infrastructure invest and other expenses.Results show that migration cost is two orders larger than land loss cost,which agrees with the results of Hinkel[17].Migration cost will increase throughout 21stcentury,and is larger under SSP5 than other pathways.The migration cost under SSP5/RCP2.6 and SSP5/RCP8.5 is 4.85 billion yuan and 8.05 billion yuan in 2100.The results for potential cost is shown in Fig.5 and Fig.6.
The proportion of economic loss in local GDP is an effective indicator to reflect the impact of coastal erosion on social and economic development.Under scenarios of RCP2.6/4.5/8.5,the share of total economic loss in local GDP is predicted to increase,with higher rates in higher RCP scenarios(Fig.7).After 2050,the total economic loss corresponding to SSP4 will account for a larger proportion of the local GDP relative to other pathways,and the annual increase is enlarged afterwards.The total erosion economic loss in 2100 under RCP8.5/SSP4 accounts for the largest proportion of local GDP,which is 4.76‰.Correspondingly,the smallest proportion is 1.12‰under RCP2.6/SSP3.It is essential,therefore,for local government to pay more attention to the impact of coastal erosion and strengthen coastal management and protection.
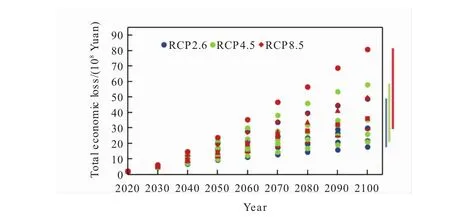
Fig.5 Economic loss due to coastal erosion from 2020 to 2100
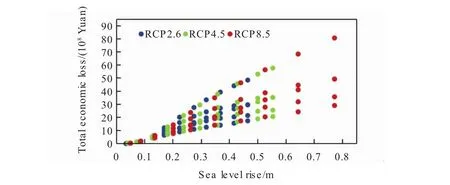
Fig.6 Economic loss due to coastal erosion under different sea level rise scenarios
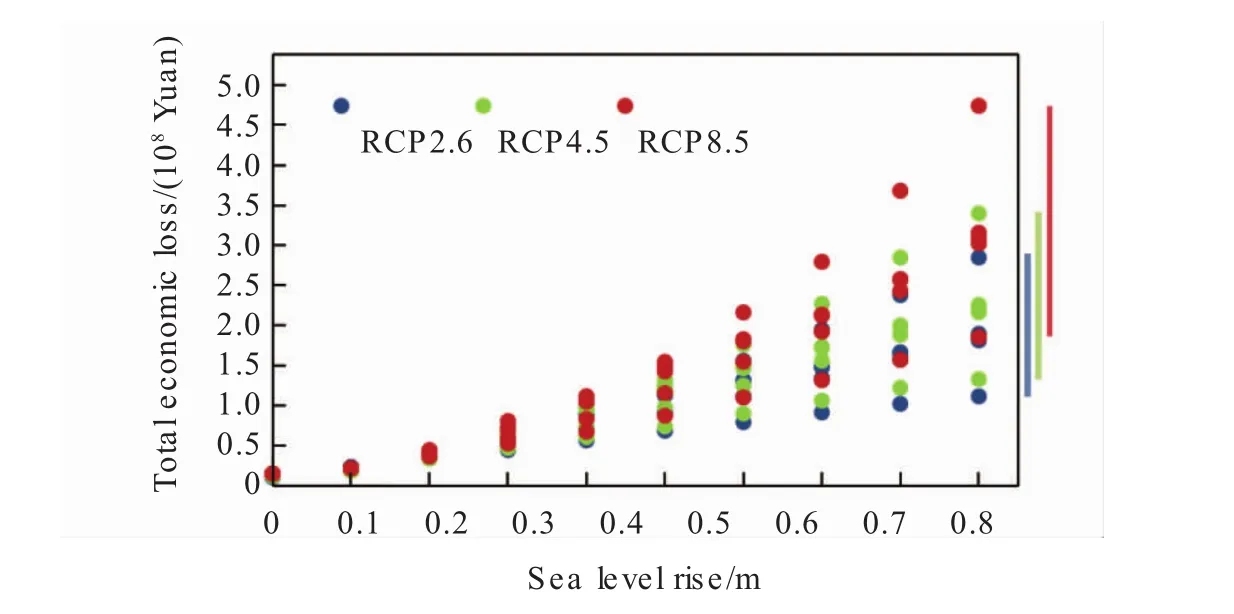
Fig.7 The ratio of total economic loss in local GDP
3.5 Beach nourishment
Beach nourishment can induce coastal dry land loss to some degrees.The tourism in studied area is relatively concentrated with 16 major tourist beaches.For tourist beaches,dry beach and berm are essential resources,which need regular maintenance and sand nourishment.Nourishment investment forms positive correlation with nourished sand volume,and is related with specific nourishing measures.On cost-saving purpose,we adopt berm nourishment for tourist beaches and offshore nourishment for general coasts,with the cost of former higher than the latter.The unit cost for coastal nourishment was derived from the practice of Netherland.Results show that the investment for tourist beaches is 23.5%of the nourishment investment of general coasts in 2100 under all RCPs.Fig.8 illustrates nourishment investment together with corresponding erosion loss under RCP2.6 and RCP8.5.The total nourishment investment are 4.75 billion yuan and 7.89 billion yuan for RCP 2.6 and RCP 8.5.The coastal erosion loss in the studied area is predicted to exceed the nourishment invest after 2060 under SSP5.For other SSPs,however,total investment are generally higher than erosion loss of the same period.This result is derived without considering the fact that tourism income will grow in some degrees in case of beach nourishment.But it is obvious that beach nourishment requires huge investment,so it is suggested to nourish parts of coastal beaches with high ecological and socio-economic value,such as natural reserve and tourist sites.For general beaches,it is better to choose optimal nourishment which balances investment and benefits.And there is no need for nourishment in areas where erosion impacts are negligible.
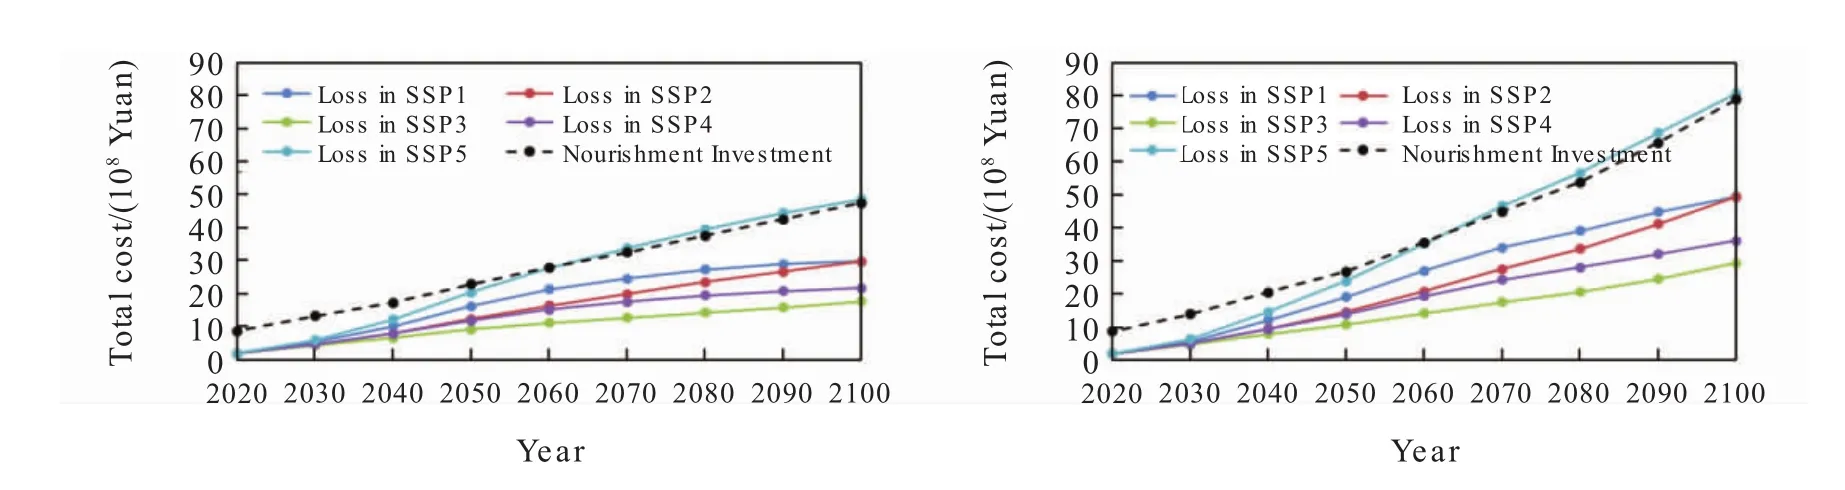
Fig.8 Nourishment investment and corresponding erosion loss for RCP2.6(left)and RCP8.5(right)
4 Conclusion
Sea level rise rate along the coast of Liaodong Bay was 3.0 mm/year from 1980 to 2017,lower than the national average for the same period.The sea level rise rate on the east coast of Liaodong Bay was relatively higher than that of the west coast.Particularly,sea level of Wafangdian and Huludao has been remaining high levels in last 6 years since 1990.The sea level is projected to rise by 20-43 cm on Liaodong Bay coast by 2100.Sea level rise results in coastal erosion.The total dry land loss reaches 11.0 km2in 2050 and 32.1 km2in 2100 under sea level rise scenario of RCP8.5.On decadal scale,the rate of dry land loss rate tends to decrease under RCP2.6,and increase under RCP4.5 and RCP8.5.People living in coastal areas will be forced to migrate due to dry land loss.In 2100,the total number of people who has to migrate due to land loss is 9 929-30 534,which is the most under the SSP3/RCP8.5 scenario.The total economic loss due to coastal erosion are 4.85 billion yuan and 8.05 billion yuan under SSP5/RCP2.6 and SSP5/RCP8.5 in 2100 respectively,in which the economic loss from migration is two orders larger than from dry land loss during the same period.To deal with coastal erosion,the total nourishment investment will be as much as 4.75 billion yuan and 7.89 billion yuan for RCP 2.6 and RCP 8.5.So it is recommended to carry out beach nourishment only on the important shores,while there is no need for nourishment in areas where erosion impacts are negligible.
Acknowledgement
This research is supported by the NMDIS Youth Fund Study on the contribution rate of sea level rise to coastal erosion of typical coastal segments(2018).The population,land use and GDP data set used in present study was provided by Data Center for Resources and Environmental Sciences,Chinese Academy of Sciences(RESDC)(http://www.resdc.cn).
杂志排行
Marine Science Bulletin的其它文章
- Research progress of micro(nano)plastics in marine survey in China
- Bibliometric analysis of Ecopath model in different ecosystem in China
- The benthic diatom community of Xiangshan Bay
- An overview of studies on marine macrobenthic community structure and biodiversity in the Bohai Sea
- Introduction to marine emergency forecasting and early-warning system(MEFES)
- Effect of mangrove forest on coastal hazards reduction