Spectral characteristics of underwater laserinduced breakdown spectroscopy under high-pressure conditions
2020-07-09LintaoWANG王林涛YeTIAN田野YingLI李颖YuanLU卢渊JinjiaGUO郭金家WangquanYE叶旺全andRongerZHENG郑荣儿
Lintao WANG (王林涛),Ye TIAN (田野),Ying LI (李颖),Yuan LU (卢渊),Jinjia GUO (郭金家),Wangquan YE (叶旺全) and Ronger ZHENG (郑荣儿)
Optics and Optoelectronics Laboratory,Ocean University of China,Qingdao 266100,People’s Republic of China
Abstract
Keywords:underwater laser-induced breakdown spectroscopy,spectral characteristics high-pressure chamber,pressure effect,deep-sea application
1.Introduction
In situ spectroscopic technique is currently of great interest for the development of modern oceanic sensors [1].Laserinduced breakdown spectroscopy (LIBS) has been proven to be an attractive technique for the chemical analysis of seawater,with the advantages of rapid,multi-elemental and stand-off analysis capabilities.During recent years,several underwater LIBS devices have been developed for submarine applications.In 2012,the first in situ LIBS analysis of solid materials submerged in seawater at depths up to 30 m was reported by the University of Malaga for archeological application [2].Recently,more attention has been paid to deep-sea environments such as the hydrothermal vent regions where the concentrations of metal elements are extremely high.In 2015,the University of Tokyo reported a promoted deep-sea LIBS system named ChemiCam that performed an in situ multi-element analysis of both seawater and mineral deposits at a depth of over 1000 m [3].In 2017,we also reported the development of a compact underwater LIBS system named LIBSea and the preliminary results in sea trials at a depth of over 1700 m [4].It is shown that underwater LIBS has progressed from a bench-top laboratory technique into a field-going oceanographic chemical sensor.
However,when applying LIBS into deep-sea,the pressure effect caused by different ocean depths is inescapable.The ocean depth varies from 0–11 000 m [5],and the corresponding pressure varies from 0.1–110 MPa.In principle,LIBS utilizes a laser-induced plasma as the hot vaporization,atomization,and excitation source,and optical emissions from the plasma are used for analysis purposes[6,7].For the plasma evolution in water,the plasma plume interacts with the surrounding water medium,and the highpressure environment can confine the expansion of the plasma plume and therefore have a great influence on the LIBS signals [8].Several groups have performed underwater LIBS measurement under high-pressure conditions by using the high-pressure chambers in the laboratory to simulate the highpressure environment of deep-sea.Lawrence-Snyder et al obtained the LIBS signals of Na,Mn,K,Ca and Li at pressures up to 27.6 MPa[9],and demonstrated that there is little or no signal enhancement with double-pulse LIBS for pressures above 10 MPa [10].The size and lifetime of the laserinduced bubble can be strongly suppressed by the external pressure [11].Giacomo et al reported the laser-ablated carbon nanostructures under high-pressure conditions (up to 14.6 MPa) and suggested the key role of the high-pressure effect in the generation of nanoparticles [12].Thornton et al studied the pressure effects on the LIBS signals from the submerged solid samples at 0.1,10,20 and 30 MPa,and demonstrated the benefit of long-pulse laser [13–15]for underwater LIBS analysis,especially under high-pressure conditions [16,17].In our previous works,we also investigated the LIBS analysis of natural seawater at different pressures from 0.1–40 MPa [18].The results showed that plasma emission is weakly dependent on the ambient pressure during the early stage and the pressure has a significant influence on the late stage of plasma evaluation.The plasma could be condensed under high-pressure conditions,which leads to an increase in plasma temperature and electron density [19].We can summarize from the above-mentioned works that there is still the lack of a detailed study of underwater LIBS signals as a function of pressure with a high-pressure resolution.Moreover,the comparison between the LIBS spectra obtained from the high-pressure chamber in the laboratory and from the field sea trials in the deep-sea has not been demonstrated so far.
In this work,we investigated the spectral characteristics of underwater LIBS as a function of pressure in the range of 0.1–45 MPa.Experimental parameters including the laser energy and detection delay were first optimized under different pressure conditions.Then,the impact of pressure on the peak intensity and line broadening of the observed spectra was studied in detail.The spectral data obtained from the high-pressure chamber and sea trials were further compared to make an evaluation of the pressure effects in practical oceanic applications.

Figure 1.Experimental setup for the LIBS measurement in water under high-pressure conditions.HWP:half-wave plate; GP:Glan prism; BS:beam splitter; DS:dichroscope; L:lens,W:sapphire window,PD:photodiode; OSC:oscilloscope:DG:delay generator.
2.Experimental setup
The experimental setup for the LIBS measurement in water at high pressures is shown in figure 1.A Q-switched Nd:YAG laser (Beamtech Optronics,Dawa 200) was operated at a fundamental wavelength of 1064 nm,with a repetition rate of 10 Hz and a pulse duration of 10 ns.The laser beam passed through a half-wave plate(HWP)and a Glan prism(GP).This ensemble allows a fine adjustment of the laser energy delivered into the water.A portion(~8%)of each laser pulse was sent to a photodiode (PD) by using a beam splitter (BS) and connected with an oscilloscope (OSC) to monitor the laser energy.A dichroscope (DS,Thorlabs,DMLP 900,transmission 920–1300 nm and reflection 390–872 nm) was used to transmit the laser light and reflect the plasma emission.The laser beam was then focused by a fused silica plano-convex lens L1(f=45 mm)into the high-pressure chamber in which the plasma is generated.Another fused silica plano-convex lens L2(f=38 mm)was used to couple the plasma emission into the optical fiber,and the emission spectrum was recorded by using a spectrometer(Avantes,Avaspec-ULS2048)with a wavelength range from 260–820 nm.The timings between the excitation laser and spectrometer were controlled by a delay generator (Stanford Research Systems,DG 535).
During the experiment,the high-pressure conditions were obtained by using a homemade high-pressure system.It consists of a pump and a stainless-steel cube chamber.The volume of the chamber is 27 ml (3×3×3 cm) and equipped with four sapphire windows (diameter 10 mm,thickness 10 mm)on each side.The plasma was generated in the middle of the chamber.The maximum pressure that can be realized is 50 MPa with a precision of 0.01 MPa,and the minimum pressure is 0.1 MPa (atmosphere pressure).The water solutions used in this experiment were made from CaCl2,NaCl,LiCl,and KCl dissolved in deionized water,with the concentrations of 2000 ppm Ca,500 ppm Na,500 ppm Li and 500 ppm K to get well-resolved spectral lines.The spectra of Ca,Na,Li and K were taken with different experimental parameters (e.g.laser energy and detection delay) under pressures in the range of 0.1–45 MPa.

Figure 2.Spectral intensities of Ca I 422 nm line(a),Na I 589 nm line(b),Li I 670 nm line(c)and K I 766 nm line(d)as a function of laser energy under different pressures.Detection delay used is 200 ns.
3.Results and discussions
3.1.Optimization of experimental parameters under different pressures
A proper choice of the laser pulse energy is essential to obtain high-quality LIBS signals,especially for the underwater measurements.With low laser energy,a 100% breakdown probability cannot be achieved,while with high laser energy,the plasma in water suffers a strong shielding effect that degrades the LIBS signals [20].In order to determine the optimal laser energy under different pressure conditions,figure 2 shows the spectral intensities of Ca I 422 nm line,Na I 589 nm line,Li I 670 nm line and K I 766 nm line as a function of laser energy under the pressures ranging from 1–38 MPa.It can be seen that for all the studied lines and all the studied pressures here,the dependence of the spectral intensity on laser energy shows quite similar behavior.As the laser energy increases,the spectral intensity increases rapidly from 1 to 4 mJ.After 4 mJ,the intensity becomes saturated and decreases gradually with the energy up to 25 mJ.This behavior agrees well with our previous work on LIBS signals in water under atmospheric pressure [21],where the plasma becomes elongated,with weakened emissions due to the plasma shielding at higher laser energies.While the results in figure 2 further demonstrate that such a tendency is independent of the external pressures of water where the plasma is generated,that means,we can use the same optimal laser energy (4 mJ in this work) under different pressures.
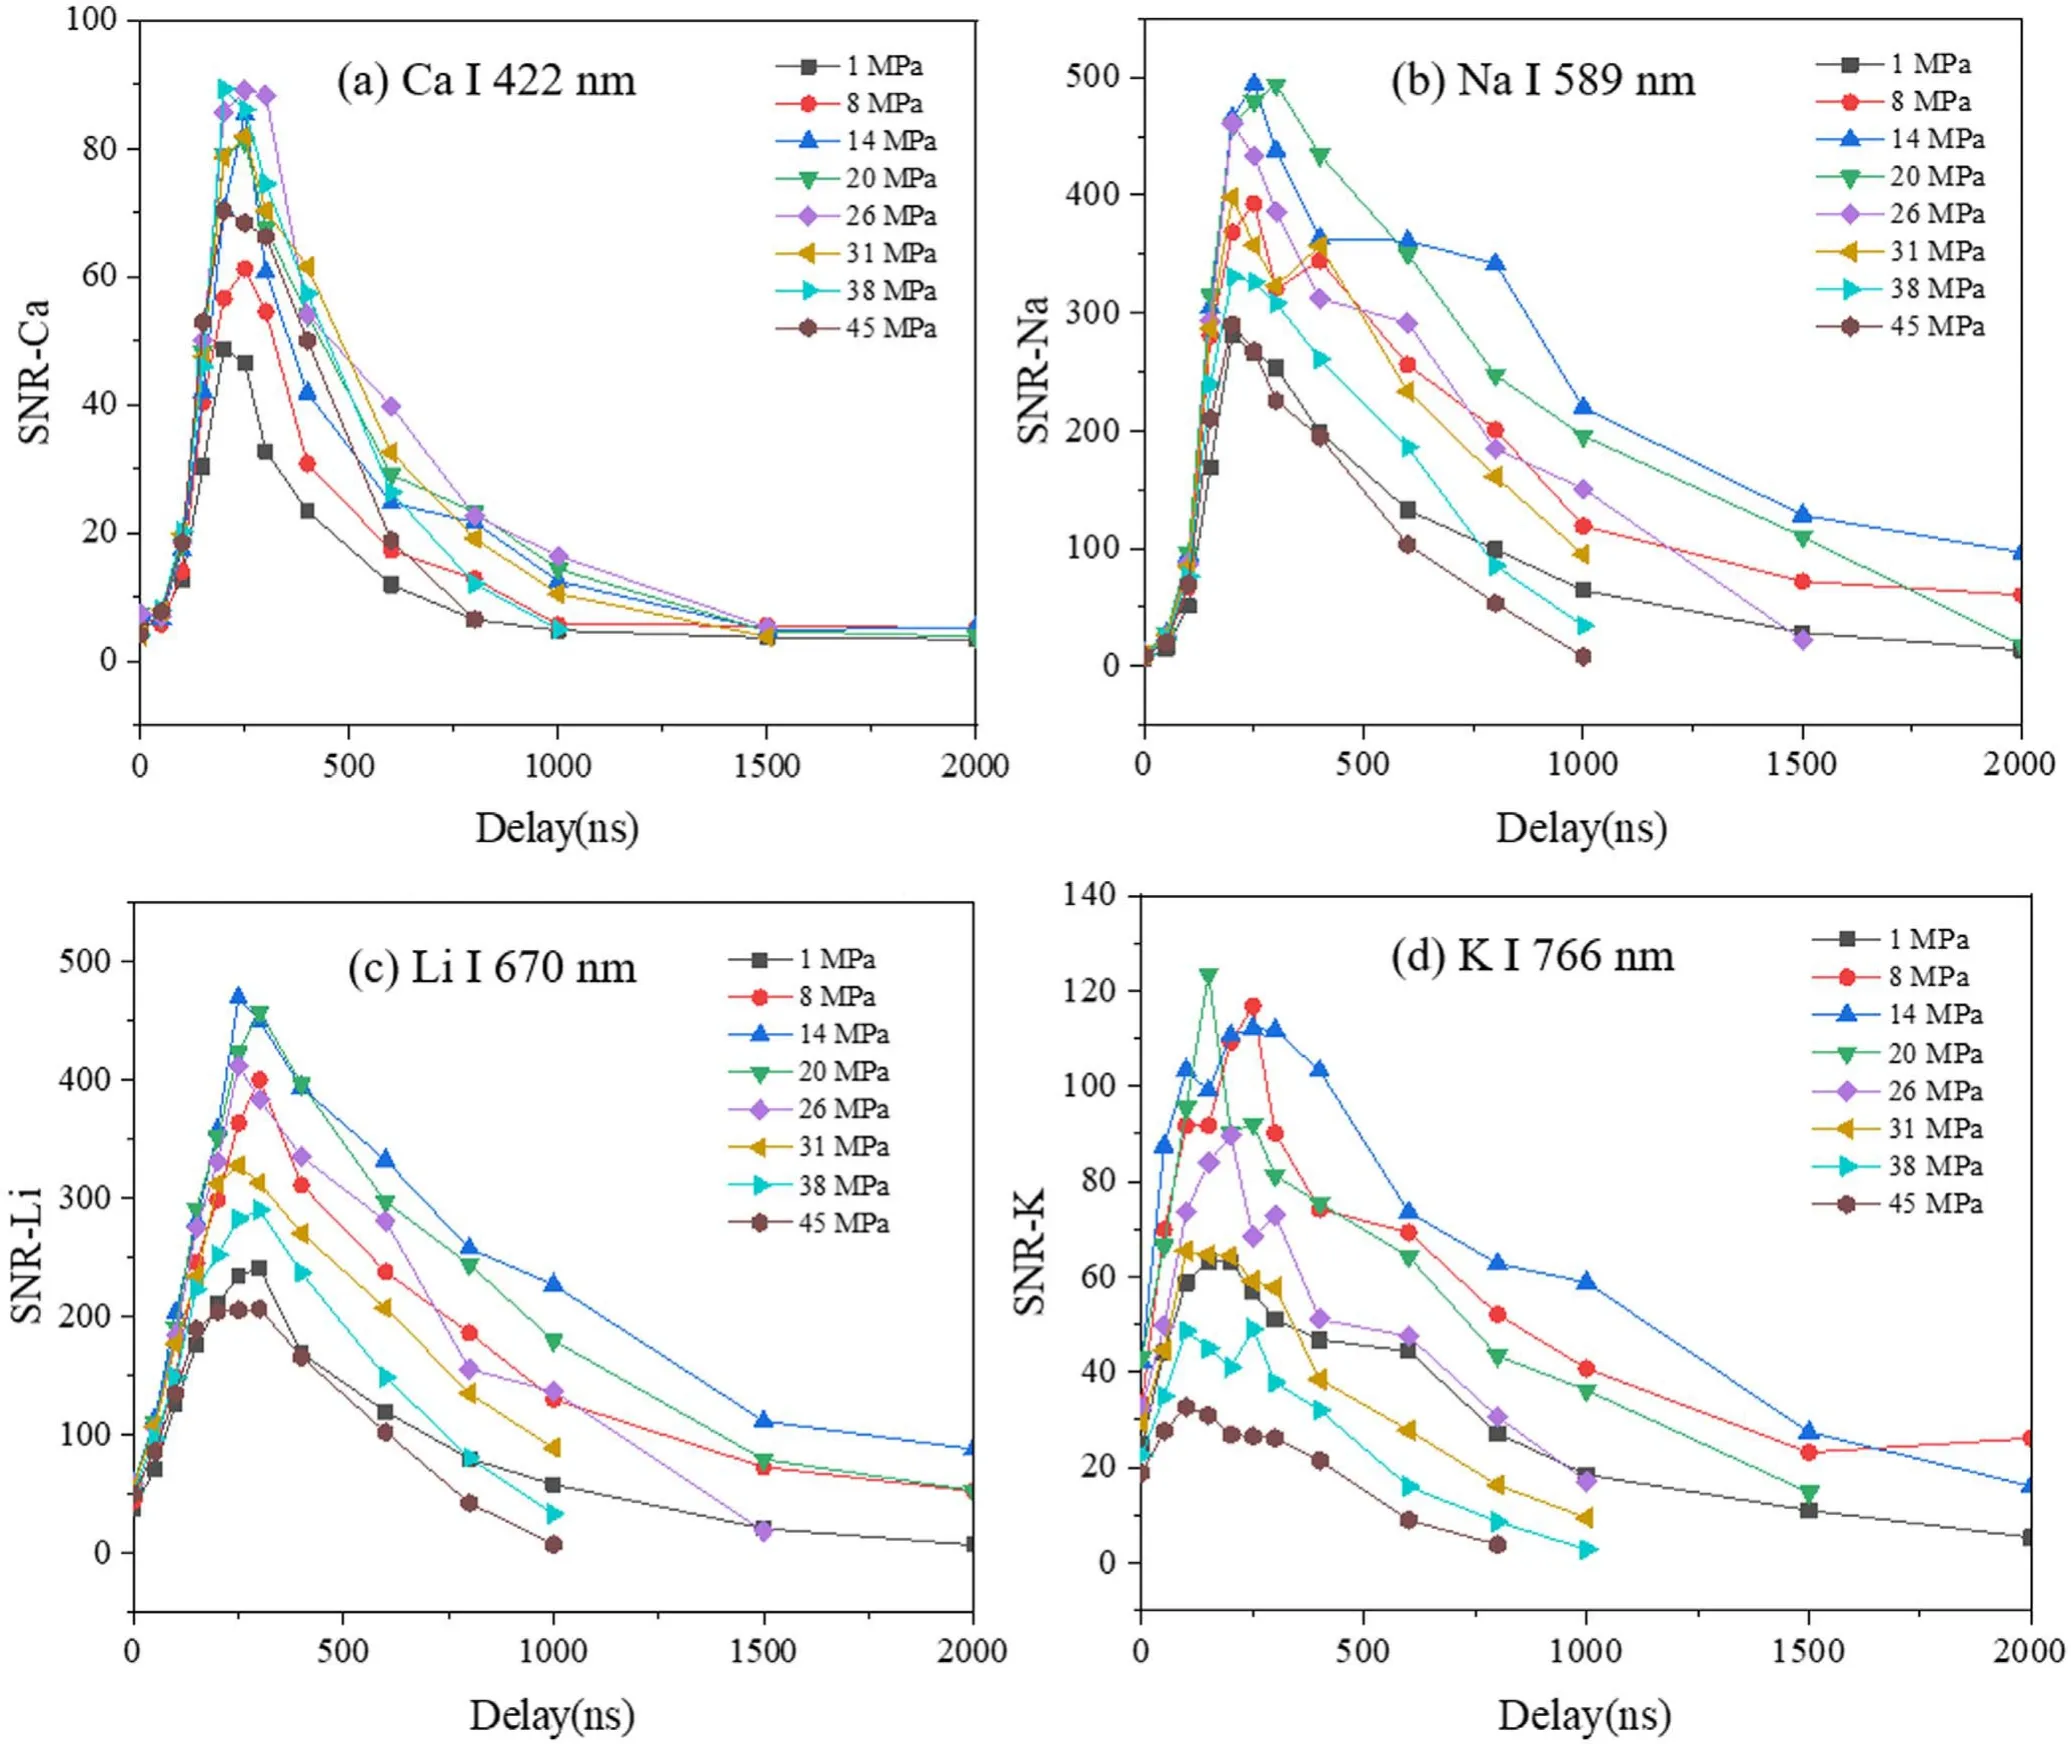
Figure 3.SNRs of Ca I 422 nm line(a),Na I 589 nm line(b),Li I 670 nm line(c)and K I 766 nm line(d)as a function of detection delay under different pressures.Laser energy used is 4 mJ.
In addition to the laser energy,we also evaluated the optimal detection delay under different pressure conditions,which is a key parameter to avoid interference from the strong continuum emission at early times after the laser pulse.Figure 3 shows the signal-to-noise ratios (SNRs) of Ca I 422 nm line,Na I 589 nm line,Li I 670 nm line and K I 766 nm line as a function of detection delay under different pressures.It can be seen that as time evolves,the SNR increases rapidly and then decreases gradually,with the optimal value obtained at the delay of ~200 ns.This means that similar to the laser energy dependence,the optimal detection delay is also less sensitive to the water pressure.We can therefore use the same optimized delay (200 ns in this work) under different pressure conditions.In the following works,the laser energy of 4 mJ and the detection delay of 200 ns were selected to study the detailed influence of the water pressure on LIBS signals.The results in figures 2 and 3 also suggest that for the in situ applications of LIBS in deepsea,experimental parameters such as the laser energy and detection delay could be fixed for all the ocean depths,which benefits the practical use of the deep-sea LIBS device.
3.2.Typical LIBS spectra under different pressures
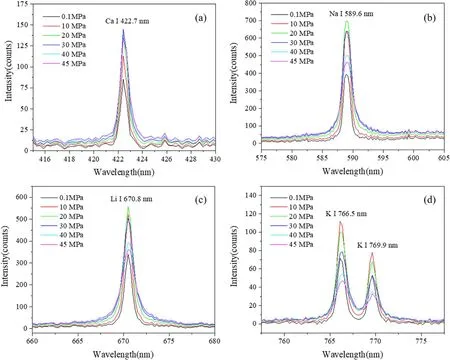
Figure 4.Typical LIBS spectra of Ca(a),Na(b),Li(c)and K(d)under the pressures of 0.1,10,20,30,40 and 45 MPa.Spectra were taken at a delay of 200 ns and with a laser energy of 4 mJ.
Typical LIBS spectra of Ca,Na,Li and K were taken at six different pressures of 0.1,10,20,30,40 and 45 MPa.All the spectral lines are strong resonant lines that are easily detectable in underwater LIBS measurement.The spectra are shown in figure 4 with relatively good SNRs.The doublet line of Na I 588.9 and Na I 589.6 nm cannot be resolved because of the low spectral resolution of the spectrometer used.It can be seen that the water pressure has an obvious impact on the LIBS signals.Both the peak intensity and line width vary significantly under different pressures.For example,for K I line,the peak intensity increases as the pressure increases up to 10 MPa; thereafter the peak intensity decreases until 45 MPa.The peak intensity of K I at 45 MPa is much lower than that at the atmospheric pressure of 0.1 MPa.While for Ca I lines,the peak intensity increases gradually and no obvious decrease was found at higher pressures.The peak intensity of Ca at 45 MPa is much higher than that at 0.1 MPa.For Na I and Li I line,quite similar spectral features were observed as a function of water pressure with the highest peak intensity at 20 MPa.Meanwhile,for the line width of each element,it can be found that the line broadening increases monotonically with the increasing pressure for all the studied elements.These results indicate the complex effect of water pressure on the LIBS signal that relies greatly on the analyzed element.Such an effect is also independent of the peak intensity and line width for a certain element.To develop an in situ LIBS instrument,the pressure effects on the LIBS signal must be considered because the pressure is quite different at different oceanic depths.It can be seen that the increase in pressure has an obvious effect on the intensity and broadness of the observed spectra.The detailed effects of pressure on the spectral signals are discussed below.
3.3.Pressure effects on LIBS spectra
In order to investigate the pressure effects on the LIBS spectra,the spectral intensity and line broadening of Ca,Na,Li and K lines were studied in the pressure range from 0.1–45 MPa.Lorentz fitting was used to extract the peak intensity and line width.Figure 5 shows the peak intensity of Ca I 422 nm,Na I 589 nm,Li I 670 nm and K I 766 nm as a function of pressure.For each line,the peak intensity was normalized by the highest value of data obtained at the selected 22 different pressures.It can be seen that the pressure dependences of Na and Li lines are quite similar.As the pressure increases,a corresponding increase in peak intensity occurs until a maximum intensity was observed at 12.5 MPa.Above this value,the peak intensity decreases up to 45 MPa.The peak intensity of Na and Li lines at 45 MPa is close to that at 0.1 MPa.For K line,a maximum intensity was also observed at 12.5 MPa,but with a more obvious decrease trend than Na and K lines.The peak intensity of K line at 45 MPa is much lower than that at 0.1 MPa.While for Ca line,the pressure dependence is quite different to that of Na,Li and K lines.The maximum intensity of Ca line was observed at 30 MPa; above this value,there was a slight decrease up to 45 MPa.The peak intensity of Ca at 45 MPa is much higher than that at 0.1 MPa.
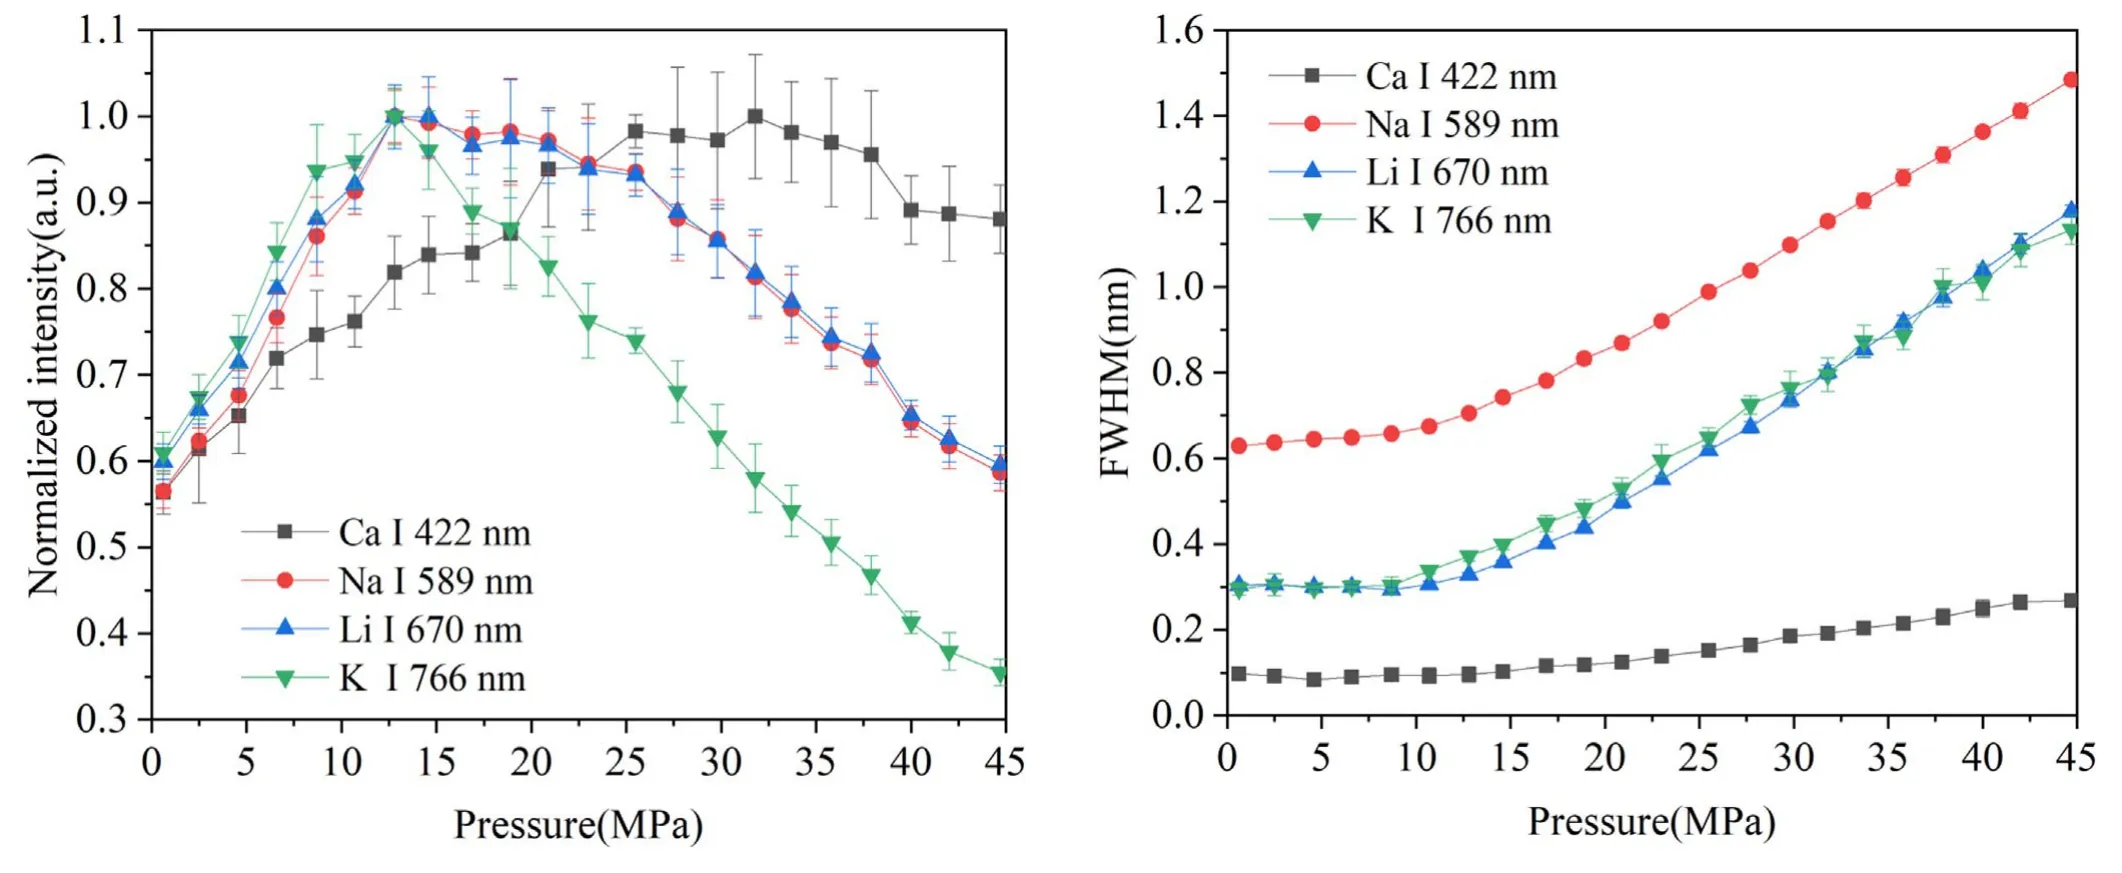
Figure 5.Pressure dependence of normalized peak intensity of fourFigure 6.Pressure dependence of line broadening of four spectral spectral lines with a laser energy of 4 mJ and detection delay oflines with a laser energy of 4 mJ and detection delay of 200 ns.200 ns.
The possible reason for the different behavior of Ca I 422 nm is that the upper energy level of Ca I 422 nm(2.93 eV)is higher than the other three lines(2.10 eV for Na I 589 nm,1.85 eV for Li I 670 nm and 1.62 eV for K I 766 nm).As reported in our previous works,the plasma is confined in a very small size (~0.5 mm) in water [22],and such confinement effect becomes more pronounced when the external pressure increases,leading to a higher plasma temperature under higher-pressure conditions [19].The simulation work performed by De Giacomo et al [12]also showed that the external pressure effect can lead to an increase of plasma temperature during its reduced oscillation period as a consequence of a faster dynamic process.The higher plasma temperature at higher pressures could therefore result in a higher spectral intensity.On the other hand,the increase in pressure may facilitate the interaction between the plasma plume and the ambient water and promote the chemical reactions inside the dense plasma [23],which could lead to a shorter emission lifetime that corresponds to a lower spectral intensity.Therefore,pressure effects on LIBS signals can be quite complex to have a nonmonotonic behavior,as observed in figure 5.As for the different spectral lines,the response of the variation of plasma property as a function of pressure will be different due to their different energy levels.
Figure 6 shows the line broadening of Ca,Na,Li and K as a function of pressure in the range of 0.1–45 MPa.The line broadening was defined as full width at half maxima(FWHM)of the spectral line and was corrected by subtracting the instrumental broadening measured by a standard lowpressure Hg lamp.It can be seen that there is no significant change of line broadening from 0.1–10 MPa.Above 10 MPa,an obvious increase trend is observed for the four spectral lines.The FWHM shows an approximately linear increase with the increase of pressure up to 45 MPa.The electron density is in direct proportion to the line broadening.The result in figure 6 proves that the electron density is higher under higher-pressure conditions due to the stronger confinement effect caused by the ambient water.The increase in electron density can lead to a dense and optically thick plasma that may cause severe self-absorption of the resonant spectral lines at high pressures.This may also contribute to the decrease of peak intensities at high pressures,as observed in figure 5.In addition,the result in figure 6 also indicates that the external pressure has no obvious impact on the electron density before 10 MPa.This is in agreement with the work of Casavola et al[24]in which the internal vapor pressure of the early-stage bubble was calculated to be in the order of 10 MPa.When the external pressure is greater than 10 MPa,the plasma together with its surrounding bubble will be compressed after a transient equilibrium between the internal plasma pressure and external water pressure,leading to an increment of collision probability among atoms,ions and electrons inside the plasma.Therefore,the electron density is higher at higher pressures as a result of the compression effect.Further study on the fast imaging of the plasma morphologies and bubble dynamics under different pressure conditions is necessary for a better understanding of the pressure effects on the LIBS signals under water.
3.4.Comparison with spectral data from sea trials

Figure 7.Comparisons of the spectral intensity (a) and FWHM (b) of K I 766 nm line between the spectral data obtained from the highpressure chamber and field sea trials.
In this section,we focused on a comparison of the spectral data obtained from the high-pressure chamber in the laboratory and from the field sea trials in deep-sea.The sea-trial spectral data were collected by using a compact 4000 m rated LIBS system(LIBSea)developed by the Ocean University of China.The LIBSea system consists of an Nd:YAG laser(Montford,M-NANO)operating at 1064 nm,an optical fiber spectrometer(Avantes,Avaspec-ULS2048),an optics module and an electronic controller module.Detailed description of the system configurations can be found in [4].The LIBSea system was deployed using a remotely operated vehicle named FAXIAN (made by SMD,UK) in the Eastern Manus Basin from May to July in 2015 [4].During this sea trial,the spectral data were obtained from the in situ measurements of seawater at different oceanic depths ranging from 100–1700 m (corresponding to 1–17 MPa).The used laser energy was 12.5 mJ and the detection delay was 280 ns.The concentrations of Na,K and Ca in natural seawater are 10770,380 and 420 ppm,respectively.K I 766 nm line was selected for the purpose of comparison,since in the sea-trial spectrum,Ca I 422 nm line has a relatively low SNR and Na I 589 nm line is severely self-absorbed [25].The comparative results between the spectral data from the high-pressure chamber and from the sea trials are shown in figure 7.It can be seen that there is good consistency between the laboratory data and seatrial data,both for the line intensity and line width as a function of pressure.The peak intensity increases with the increase of pressure until a maximum value is reached at about 10 MPa.The FWHM keeps constant at low pressures,while it increases linearly at higher pressures.There may be two reasons for the observed difference between the laboratory data and sea-trial data:(1) the different experimental configurations (e.g.laser source and focusing optics) and experimental parameters (e.g.laser energy and detection delay) used for the laboratory setup and the LIBSea system;(2) for the sea-trial data in the field environment,the LIBS signal may also be influenced by the variation of other oceanic parameters such as the temperature [26]and salinity[27].Nevertheless,the results in figure 7 confirmed that for the in situ application of underwater LIBS in deep-sea,pressure effect is the key factor that affects the LIBS signals compared with the temperature or salinity effect.
4.Conclusions
In this work,we have investigated the spectral characteristics of underwater LIBS as a function of pressure in the range of 0.1–45 MPa.Experimental parameters including the laser energy and detection delay were first optimized under different pressure conditions.The optimal laser energy and detection delay were shown to be independent of the external pressure,and were determined as 4 mJ and 200 ns,respectively.The increase in pressure has a significant impact both on the peak intensity and line broadening of the observed spectra.The peak intensity of Na,Li and K lines increases with the increase of pressure until a maximum intensity is reached at 12.5 MPa.Above this value,the peak intensity decreases gradually up to 45 MPa.For Ca line,the maximum intensity was observed at 30 MPa.The line broadening keeps constant at low pressures from 0.1–10 MPa,while it increases linearly at higher pressures,indicating a higher electron density caused by the compression effect of the high external pressure.The spectral data obtained from the high-pressure chamber in the laboratory also show good consistency with the spectral data obtained from the field sea trials in the deepsea.These results suggest that the complex effect of pressure on underwater LIBS signals should be taken into account for in situ oceanic applications.
Acknowledgments
This work was supported by National Natural Science Foundation of China (Grant Nos.61975190 and 61705212),the National Key Research and Development Program of China(Grant No.2016YFC0302101),the Provincial Key Research and Development Program of Shandong,China (Grant No.2019GHZ010) and the Shandong Provincial Natural Science Foundation,China (Grant No.ZR2017BF020).
猜你喜欢
杂志排行

Plasma Science and Technology的其它文章
- Way-out for laser-induced breakdown spectroscopy
- A feature selection method combined with ridge regression and recursive feature elimination in quantitative analysis of laser induced breakdown spectroscopy
- Uranium measurements using laser-induced breakdown spectroscopy in lithium chloridepotassium chloride salt of pyroprocessing
- Accuracy improvement of quantitative analysis of calorific value of coal by combining support vector machine and partial least square methods in laserinduced breakdown spectroscopy
- Rapid online analysis of trace elements in steel using a mobile fiber-optic laserinduced breakdown spectroscopy system
- The classification of plants by laser-induced breakdown spectroscopy based on two chemometric methods