Rapid online analysis of trace elements in steel using a mobile fiber-optic laserinduced breakdown spectroscopy system
2020-07-09QingdongZENG曾庆栋GuanghuiCHEN陈光辉XiangangCHEN陈献刚BoyunWANG王波云BoyangWAN万博阳MengtianYUAN袁梦甜YangLIU刘洋HuaqingYU余华清LianboGUO郭连波andXiangyouLI李祥友
Qingdong ZENG (曾庆栋),Guanghui CHEN (陈光辉),Xiangang CHEN (陈献刚),Boyun WANG (王波云),Boyang WAN (万博阳),Mengtian YUAN (袁梦甜),Yang LIU (刘洋),Huaqing YU (余华清),Lianbo GUO (郭连波) and Xiangyou LI (李祥友)
1 School of Physics and Electronic-information Engineering,Hubei Engineering University,Xiaogan 432000,People’s Republic of China
2 Wuhan National Laboratory for Optoelectronics (WNLO),Huazhong University of Science and Technology,Wuhan 430074,People’s Republic of China
3 Faculty of Physics and Electronic Science,Hubei University,Wuhan 430062,People’s Republic of China
4 Inner Mongolia North Heavy Industries Group Corp.Ltd,Baotou 014033,People’s Republic of China
Abstract
Keywords:laser-induced breakdown spectroscopy,optical fiber,rapid analysis,online detection,steel
1.Introduction
The content of trace elements in a steel alloy has a remarkable effect on the performance of the steel [1,2].Accordingly,rapid and accurate detection of the concentration of trace elements is critical to steel performance,production efficiency,and cost reduction of human resource.However,the traditional analytical methods are unsuitable for the direct measurement of large steel tubes,especially in harsh environments.For example,inductively coupled plasma(ICP)is a traditional method of steel analysis that involves cutting of a small piece of steel at the end of the steel tube and then preparing it for analysis through complex sample processing.The analysis processes are labor-intensive and time-consuming due to the complex preparation and extensive analysis cycle.
Laser-induced breakdown spectroscopy (LIBS) is an effective elemental analytical method that analyzes the composition of substances by detecting the atomic emission spectroscopy of the target sample [3–7].Unlike traditional analytical methods,the LIBS technique is versatile due to its various advantages of minimal sample preparation,fast analysis,and the ability to identify multiple elements at the same time [8–11].LIBS is a promising fast detection technology and regarded as a ‘future superstar’ due to these advantages[12].However,because of its large size,complex structure,and sensitivity to disturbance from the outside environment,the traditional LIBS is only suitable for laboratory research and not practicable for online detection and analysis in the industrial field [13].
Therefore,the development of a transportable,robust,and cost-effective LIBS system is an urgent requirement for online analysis in the industrial field.Several research groups have devoted their efforts to the development of a robust,cost-effective,and even mobile or portable LIBS system suitable for industrial applications.Gravel et al[14]utilized a compact fiber laser coupled with three different spectrometers to ablate aluminum and copper samples and analyze their elements.They found that,under some given conditions,the compact spectrometer could obtain low limits of detection(LODs) that operate at fast rates.They suggested that the robust fiber laser has great potential for various industrial LIBS applications.Scharun et al [15]developed a mobile LIBS setup utilizing a multi-kHz fiber laser as the light source for metal analysis.The set-up achieved accuracy comparable to or even better than that of spark discharge optical emission spectroscopy within a given concentration range,under corresponding conditions; however,obtaining a single spectrum without continuous background emission using a compact spectrometer and an inexpensive CCD detector is difficult due to the multi-kHz repetition frequency [16].Several specialist LIBS set-ups have been successfully applied in the industrial field.For example,Sturm et al [17]used an automated LIBS device for analyzing the liquid slag in a slag transporter online with temperature ranging from 600 °C to 1400 °C.It should be mentioned that this equipment is large,adapted to a specific situation,and difficult to maneuver unlike a mobile or portable device.Wang et al[18]utilized a handheld micro-LIBS device to analyze different types of steel.They reported that the absolute errors (AEs)and sample-to-sample relative standard deviation(RSD)of Si,Cr,Mn,and Ni are improved by utilizing the partial leastsquares algorithm with spectral standardization.
The aforementioned works provided versatile approaches and obtained progress in LIBS application from the laboratory to industrial sites; however,the majority of these LIBS systems have difficulty in obtaining satisfactory results in terms of volume and performance.Decreased robustness and low accuracy and precision are the major drawbacks of LIBS systems in quantitative analysis.Using special fibers can conveniently deliver the laser beam to the target by avoiding the complex optical path systems and interferences from the outside,which improves the anti-interference ability of the system; several researchers have utilized special fibers to deliver the laser beam and build a fiber-optic laser-induced breakdown spectroscopy (FO-LIBS) system [13,19–22].It is worth mentioning that Thornton et al [22]developed and successfully deployed a deep-sea LIBS instrument(Chemi-Cam) to study the chemical composition of seawater and mineral deposits at depths of over 1000 m.They utilized a 4 m long fiber-optic cable to deliver a laser beam to the target surface and the whole device was mounted on a remotely operated vehicle(ROV).Limited methods can be used for the online quantitative analysis of trace elements of large-diameter steel tubes in industrial sites.

Figure 1.FO-LIBS system.(a) Schematic and (b) prototype.
In this study,a mobile FO-LIBS prototype is developed and applied to the online quantitative analysis of a largediameter steel pipe in a steel mill.The Mn,Cr,Ni,V,Cu,and Mo in the steel are quantitatively analyzed.Polynomial fitting and linear fitting are performed to establish calibration curves,and their results are compared to improve the analysis accuracy.The AE,relative error(RE),and LOD of each element in the large-diameter steel pipe are measured.
2.Experimental set-up and methodology
2.1.Experimental set-up
The schematic of the proposed FO-LIBS system is illustrated in figure 1(a).A compact Q-switch Nd:YAG laser (Model:Ultra 50; Bigsky Co.,Ltd; United States) with stability and robustness in tolerating harsh conditions is utilized as the light source.This laser has a wavelength of 532 nm,repetition rate of 10 Hz,and maximum output laser energy per pulse ofapproximately 29 mJ.After coupling with the optical fiber,with core diameter of 1 mm,via a coupling model,the laser beam leaves the fiber and is collimated by a collimating lens.The laser beam is then reflected by a dichroic mirror.The laser beam is focused onto the sample surface for producing plasma.The emission line of the plasma is acquired using a compact time-integrated spectrometer (AvaSpec-2048-USB2,10 μm slit,2400 lines/mm (VE) grating).The spectral range of the spectrometer is from approximately 295 nm to 1020 nm split jointed by six channels,with a spectral resolution of 0.08–0.11 nm.The spectrometer is coupled with a gated 2048 pixel CCD array detector (model Sony 554).The detector in charge of receiving the plasma spectrum converts the optical signal into an electrical signal.The spectral signal is subsequently transmitted through the USB interface and displayed on a laptop.In this work,the integration time of each acquisition was set to 1.1 ms and the delay time was 1.3 μs after the laser pulse.Every sample was measured 30 times unless specified,and each measurement was averaged by 10 spectra.

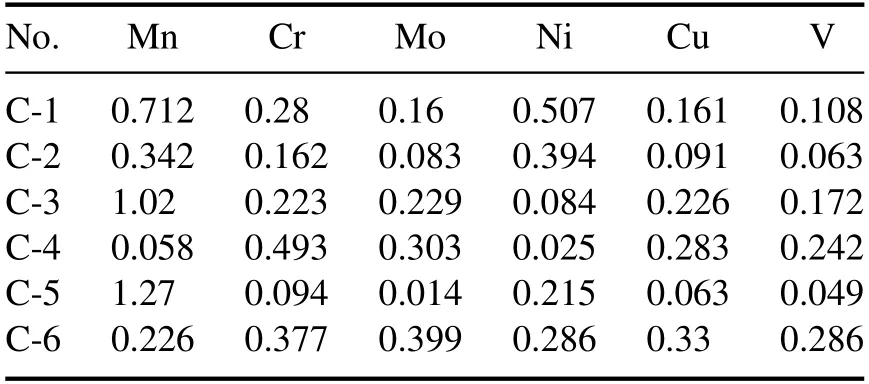
Table 1.Reference concentrations of the six trace elements in six carbon steel samples (wt%).
The prototype of the FO-LIBS system is shown in figure 1(b).The equipment consists of two parts,namely,the main case and the probe.The main case,containing the compact laser,spectrometer,circuit system,optical system,control system,and power system,is approximately 40 cm×50 cm×70 cm in size and 50 kg in weight.The probe,composed of a mini lens and the optical fiber,is approximately 20 cm in length.The system is equipped with a laptop and self-developed LIBSystemX software,which is applied for qualitative and quantitative analyses,database building,spectral data extraction,and other functions.The entire equipment is supplied with 220 V AC electricity and designed with wheels for easy mobility.
2.2.Samples
Six standard carbon steel samples (GBW01211-01216; purchased from Fushun Steel Shares Co.,Ltd),seven standard samples of microalloy steel (GSB 03-2453-2008-1-7),and eleven standard samples of low-alloy steel (purchased from the National Institute of Standards and Technology [NIST]),are used to build the calibration curve models in this work.The concentration information of Mn,Cr,Ni,V,Cu,and Mo in all calibration samples is listed in tables 1–3.Five special steel materials,including large-diameter steel tubes,weredetected and analyzed.The concentration information of Mn,Cr,Ni,V,Cu,and Mo in the detection target is presented in table 4.

Table 2.Reference concentrations of the six trace elements in the microalloy steel samples (wt%).
3.Results and discussion
3.1.Establishment of calibration curve
The spectrum signal obtained using the mobile FO-LIBS prototype is shown in figure 2.The spectra are acquired from carbon steel sample C-1.The calibration curve models are established prior to the quantitative analysis.Twenty-four standard steel samples are used for broadening the concentration range,and improving the analytical accuracy and building the calibration curve models of Mn,Cr,Ni,V,Cu,and Mo.Describing the relation between the spectral line intensity and element concentration via linear fitting was difficult due to the large concentration range of elements in the samples.Therefore,the calibration curve models were established through polynomial fitting.In general,the majority of spectral data can be successfully fitted through quadratic or cubic polynomial fitting.However,in a few special cases,quadratic or cubic polynomial fitting in the calibration curve model of Cu is difficult due to the selfabsorption effect [11].In view of the above-mentioned reasons,the fourth-order polynomial curve fitting method was adopted in this study to establish the calibration curve model for Cu.According to the NIST atomic spectral database and considering the absence of or minimal interference,the spectral lines of Mn 476.24 nm,Cr 434.45 nm,V 440.85 nm,Ni 346.17 nm,Cu 327.40 nm and Mo 386.41 nm were chosen as the analytical spectral lines.Considering little or no selfabsorption,no interference from other elements,and proximity to the analytical spectral lines,the matrices spectral Fe 426.05 nm,Fe 430.79 nm,Fe 426.05 nm,Fe 358.12 nm,Fe 358.12 nm and Fe 387.85 nm were adopted as the reference lines for Mn 476.24 nm,Cr 434.45 nm,V 440.85 nm,Ni 346.17 nm,Cu 327.40 nm and Mo 386.41 nm,respectively.In this work,the polynomial and linear fitting methods were performed to establish calibration curve models.The calibration curves for the intensity ratios of Mn 476.24 nm/Fe 426.05 nm,Cr 434.45 nm/Fe 430.79 nm,Ni 346.17nm/Fe 358.12 nm,V 440.85 nm/Fe 426.05 nm,Cu 327.40 nm/Fe358.12 nm,and Mo 386.41 nm/Fe 387.85 nm were established and are shown in figures 3(a)–(f).

Table 3.Reference concentrations of the six trace elements in the low-alloy steel samples (wt%).

Table 4.Reference concentrations of the six trace elements in the special steel materials (wt%).
In general,when the coefficients of determination (R2factors) of a calibration curve are above 0.98,such a curve can be used for quantitative analysis.The R2factors of the calibration curves established by polynomial fitting and linear fitting for Mn,Cr,Ni,V,Cu,and Mo are presented in figure 3.As shown in figures 3(a)–(f),the R2factors of the calibration curves are improved with the use of polynomial fitting,and most are above 0.99,except for Cu (R2=0.98),indicating the elements’strong self-absorption effect[11].As shown in figure 3,the R2factors in the polynomial fitting method are obviously better than those in the linear fitting method,which is mainly due to the nonlinearity in the calibration curve caused by the self-absorption effect.In order to broaden the measuring range of this FO-LIBS prototype,the number of samples was increased and the concentration range of elements was broadened.It is acknowledged that the selfabsorption effect of the spectrum is different at different concentrations.When the element’s concentration is low,the self-absorption effect is small and the intensity of the spectral line changes closer to the linear relationship with the concentration; however,when the concentration is high or a strong line is employed to pursue high sensitivity,the selfabsorption is difficult to avoid,and the calibration curve is nonlinear.To improve the analysis accuracy,employing more samples and a polynomial fitting method can better approach the actual data points of the spectrum intensity in calibration curve,thus avoiding the influence of the nonlinearity in the quantitative analysis caused by the self-absorption effect.
In addition,RSD is improved in this mobile LIBS system.For example,the average RSD for the intensity ratios of Mn 476.24 nm/Fe 426.05 nm was about 4.6%.The results suggest that the precision of this prototype is slightly better than that of most LIBS systems [23–26].
3.2.Quantitative analysis
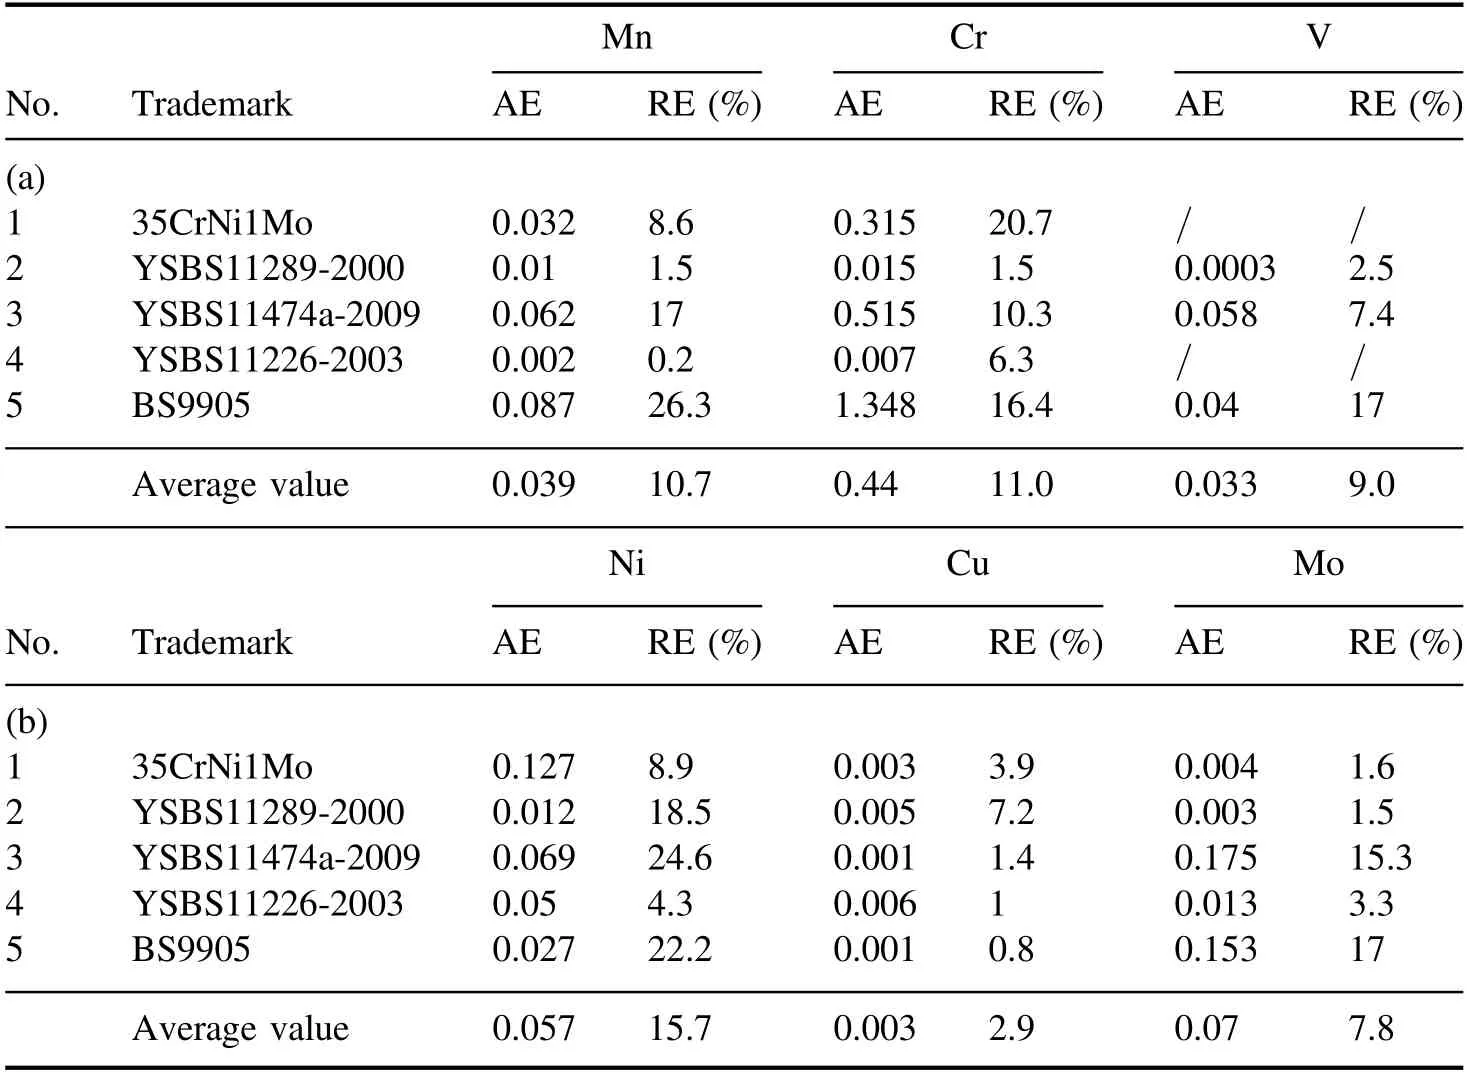
After obtaining the calibration curves for the elements,the spectrum data of the measured materials were inputted into the calibration curve equation to calculate the concentration of each trace element.In this work,five special steel materials(including large-diameter steel pipes) were rapidly and quantitatively analyzed via the mobile FO-LIBS prototype.Thirty spectra were obtained for each measured material,and each spectrum was acquired by taking the average of ten separate measurements.The predicted concentration value of each element was calculated according to its calibration curve equations.In addition,the AEs and REs of Mn,Cr,and V are listed in table 5(a),and those of Ni,Cu,and Mo in table 5(b).

Figure 3.Calibration curves of trace elements:(a) Mn,(b) Cr,(c) Ni,(d) V,(e) Cu,and (f) Mo.
As shown in tables 5(a)and(b),the average AEs of Mn,Cr,V,Ni,Cu,and Mo in the five special steel materials were 0.039 wt%,0.440 wt%,0.033 wt%,0.057 wt%,0.003 wt%,and 0.07 wt%,whereas their average REs were 10.7%,11.0%,9.0%,15.7%,2.9%,and 7.8%,respectively.The accuracy of analysis in the field was slightly inferior to that in the laboratory due to the harsh environment and interference in the steel mill.However,the on-site performance analysis of the mobile LIBS prototype is similar to that of most traditional LIBS systems [27–29].The accuracy results of this study were slightly inferior to those detected via ICP-optical emission spectrometry (ICP-OES).Nevertheless,the results of the prototype analysis could be used for the preliminary detection of trace elements in steel material.Furthermore,the ambiguous results could be sent to the laboratory for further chemical analysis.
3.3.LOD
LOD is used to evaluate the sensitivity of an instrument or method.LOD indicates the minimum concentration of an element that can be detected with the appropriate confidence level.As shown in equation(1),the 3σ principle was applied to calculate the LOD of each element according to the stipulation of the International Union of Pure and AppliedChemistry.

Table 5.(a).AEs and REs of Mn,Cr,and V in five special steel materials using FO-LIBS(wt%).(b).AEs and REs of Ni,Cu,and Mo in five special steel materials using FO-LIBS (wt%).
whereσBrepresents the standard deviation of background noise and k denotes the slope of the calibration curve.In this work,the wavelength region of 409.45–409.87 nm was chosen as the background noise.The LODs of the six trace elements in steel are calculated using equation(1)and shown in table 6.
As shown in table 6,the LODs of elements detected by the mobile FO-LIBS prototype were slightly better than those obtained in the laboratory in our previous work,likely because the cylindrical cavity wall (2 mm in diameter) of the muzzle of the probe is equivalent to a space-constraining cavity,which can restrict plasma.Therefore,improved LOD values in the space-constraining cavity could enhance the intensity of the spectral line and detection sensitivity[30–32].
4.Conclusions
In summary,a mobile FO-LIBS prototype was developed and used in the online quantitative analysis of trace elements in steel materials.The polynomial fitting method and linear fitting method were compared and used to establish calibration curve models for Mn,Cr,V,Ni,Cu,and Mo.The R2factors in the polynomial fitting method are obviously better than those in the linear fitting method.In the polynomial fitting method,most of the R2factors of calibration curves were above 0.99,except for Cu,indicating the elements’ strong self-absorption effect.The average AEs of Mn,Cr,V,Ni,Cu,and Mo of the five special steel materials were 0.039 wt%,0.440 wt%,0.033 wt%,0.057 wt%,0.003 wt%,and 0.07 wt%,respectively,and their average REs were within the range of 2.9%–15.7%.The results suggest that polynomial fitting can better approach the actual data points of the intensity in the calibration curve,thus avoiding the influence of the nonlinearity in the quantitative analysis caused by the selfabsorption effect and improving the analysis accuracy.The LODs of these elements were 39,31,36,89,131,and 290 ppm,respectively.These results suggest that the on-site performance analysis of the mobile LIBS prototype is similar to or even slightly better than that of most traditional LIBS systems.Hence,the FO-LIBS prototype could be used for the preliminary detection of trace elements in industrial sites due to its advantages of flexibility and robustness.Moreover,FO-LIBS provides a feasible approach for promoting LIBS from the laboratory to industry.
Acknowledgments
This work was supported by National Natural Science Foundation of China(Nos.61705064,11647122),the Natural Science Foundation of Hubei Province (Nos.2018CFB773,2018CFB672),and the Project of the Hubei Provincial Department of Education (No.T201617).
猜你喜欢
杂志排行
Plasma Science and Technology的其它文章
- Way-out for laser-induced breakdown spectroscopy
- A feature selection method combined with ridge regression and recursive feature elimination in quantitative analysis of laser induced breakdown spectroscopy
- Uranium measurements using laser-induced breakdown spectroscopy in lithium chloridepotassium chloride salt of pyroprocessing
- Accuracy improvement of quantitative analysis of calorific value of coal by combining support vector machine and partial least square methods in laserinduced breakdown spectroscopy
- The classification of plants by laser-induced breakdown spectroscopy based on two chemometric methods
- Improvement in classification accuracy of stainless steel alloys by laser-induced breakdown spectroscopy based on elemental intensity ratio analysis
