Severity of the metabolic syndrome as a predictor of prediabetes and type 2 diabetes in first degree relatives of type 2 diabetic patients: A 15-year prospective cohort study
2020-07-06RokhsarehMeamarMasoudAminiAshrafAminorroayaMaryamNasriMajidAbyarAwatFeizi
Rokhsareh Meamar, Masoud Amini, Ashraf Aminorroaya, Maryam Nasri, Majid Abyar, Awat Feizi
Rokhsareh Meamar, Isfahan Endocrine and Metabolism Research Center, Isfahan Clinical Toxicology Research Center, Isfahan University of Medical Sciences, Isfahan 81746-73461,Iran
Masoud Amini, Ashraf Aminorroaya, Majid Abyar, Awat Feizi, Isfahan Endocrine and Metabolism Research Center, Isfahan University of Medical Sciences, Isfahan 81746-73461, Iran
Maryam Nasri, Grovemead Health Center, London NW4-3EB, United Kingdom
Awat Feizi, Department of Biostatistics and Epidemiology, School of Health, Isfahan University of Medical Sciences, Isfahan 81746-73461, Iran
Abstract
Key words: Insulin resistance; Metabolic syndrome; Risk; Type 2 diabetes mellitus;Prediabetes; First degree relative
INTRODUCTION
Type 2 diabetes mellitus (T2DM) has high morbidity and mortality worldwide,therefore there is of paramount importance to identify risk factors in the populations at risk early in the course of illness[1].
One of the important factors in increasing the risk of acquiring DM is metabolic syndrome (MetS). MetS consists of having three of the five following abnormalities;central obesity, hypertension, high triacylglycerol, low high-density lipoproteins(HDL) cholesterol and elevated fasting glucose[2]. MetS is linked to insulin resistance[3]and obesity[4]due to abnormality in cellular function[5]. MetS is a risk factor for future cardiovascular disease (CVD)[6,7]and T2DM[7-9]both in children and adults[10,11]. Linear measurements of MetS Z-score is valuable not only for the identification of high-risk individuals but also for following up the disease development over time and evaluation of the response to treatment[12]. Recently the potential benefit of measuring MetS Z-score in childhood and predicting cardiovascular disease and diabetes later in life has been revealed[12-13].
The MetS not only is inherited but also influenced by lifestyle and genetic factors[14].This provides an opportunity to modify lifestyle or intervene with treatments in the population who have been recognized to be at risk for prediabetes and diabetes mellitus such as the offspring of the patients with T2DM[15].
First degree relatives (FDRs) with T2DM are at higher risk of diabetes and prediabetes progression[16-18].
A study by Siewertet al[19]indicated that the prevalence of MetS is high in young FDR adults. Iran is a developing country and its population is adopting a more sedentary lifestyle with new diets resulting in a high prevalence of T2DM and prediabetes[20]. In this study, taking into account potential links between MetS Z-score as a marker for prediabetes or T2DM risk, we assessed the role of MetS Z-score for predicting prediabetes and T2DM in FDR population in a long-term follow-up cohort study to enable clinicians to identify and treat this high-risk population through conducting of interventions for preventing MetS or diminishing its side effects.
MATERIALS AND METHODS
Study design and population
Data were drawn from the database of the Isfahan Diabetes Study on the first degree relatives (FDR), the details of the study have been presented elsewhere[21]. In summary, the study is an ongoing open cohort study started at 2003 on FDR of patients with T2DM in Isfahan, a large city in central Iran, to measure several possible risk factors of diabetes incidence. At baseline, our sample comprised of 3492 FDRs of T2DM patients. All participants were visited at the Isfahan Endocrine and Metabolism Research Center, affiliated to Isfahan University of Medical Sciences, Iran. The Bioethics Committee of Isfahan University of Medical Sciences approved the study and written informed consent was obtained from every participant based on the Declaration of Helsinki.
At the time of examination, subjects underwent anthropometric measurements and laboratory tests, including a standard 75-g 2-h oral glucose tolerance test (OGTT). For the current study, the analysis was limited to those normal glucose test (NGT)participants without missing datai.e. 1766 at baseline. NGT participants were followed from 2003 annually until 2018 and then classified to NGT, impaired glucose test and T2DM according to the American Diabetes Association criteria[22].
Variables assessment
Anthropometric and demographic variables:All participants completed a demographic questionnaire including age, gender, level of education, smoking and personal and medical history at baseline. Anthropometric and basic clinical measurements, including body mass index (kg/m2), waist circumference (WC, cm)and waist-to-hip ratio (WHR) were calculated according to standard methods[23]and blood pressure (BP) including both systolic and diastolic were recorded.
MetS Z-Score calculation:Traditional MetS was defined using the National Cholesterol Education Program Adult Treatment Panel-III criteria[2]. Participants had to meet three or more of the following five criteria: (1) Concentration of triacylglycerol≥ 1.69 mmol/L (150 mg/dL); (2) HDL-cholesterol level < 1.04 mmol/L (40 mg/dL) for men and < 1.3 mmol/L (50 mg/dL) for women; (3) WC ≥ 102 cm for men and 88 cm for women; (4) Glucose concentration ≥ 5.55 mmol/L (100 mg/dL); and (5) systolic BP≥ 130 mmHg or diastolic BP ≥ 85 mmHg. The MetS Z-score was calculated for adolescents at first visit using formulas published elsewhere[24]. Data collection was conducted at baseline and at follow-up according to the standards of Medical Care in Diabetes[25].
Laboratory parameters: All participants received a 75-g OGTT following a 12- hour overnight fasting period. Plasma glucose (PG) was measured at 0, 30, 60 and 120 min[26](2-h PG) and fasting plasma glucose (FPG) (mg/dL) was measured by Pars Azmon kit Lot number: 94011 (a photometric method). HbA1c, cholesterol (LDL,HDL) and triglyceride were also measured.
Participants with FPG ≥ 200 mg/dL were considered diabetic. If FPG was ≥ 126 and< 200 mg/dL, a second FPG was measured on another day. If the second FPG was also ≥ 126 mg/dL, participants were classified as diabetic. Those with FPG ≥ 126 mg/dL or 2-h PG ≥ 200 mg/dL were also defined as diabetic. Impaired fasting glucose (IFG) and impaired glucose tolerance (IGT) are intermediate stages in the natural history of type 2 diabetes and are called the pre-diabetes phase[22]. FPG < 126 mg/dL with a 2-h PG concentration ≥ 140 and < 200 mg/dL was interpreted as IGT. If FPG was in the range of 100-126 mg/dL and 2-h PG was < 140 mg/dL, it was considered as IFG. NGT was defined as FPG below 100 mg/dL and 2-h PG less than 140 mg/dL[27].
Statistical analysis
Quantitative variables ar e presented as mean ± SD or median [IQR], while qualitative as frequency (percentage). Depending on the normal or non-normal distribution of data, independent samplest-test or Mann-WhitneyUtests were used for comparing continuous data between NPG and diabetes or prediabetes. Categorical data were compared with theχ2test.
Pearson correlation coefficient was calculated for evaluating the correlation of MetS Z-score at first and last visit. The diagnostic accuracy of MetS Z-Score was evaluated by using the receiver operating characteristic (ROC) curve analysis and calculated area under the curve (AUC) and 95% confidence interval (CI) for AUC. We used binary logistic regression analysis for evaluating the predictive value of MetS Z-Score for diabetes and prediabetes incidence in the future in different models. In these analyses, after obtaining relative risk (RR) and 95%CI in the crude model, the adjustment was made for age and gender in the model 1. All statistical calculations were carried out with the SPSS 15 for Windows (SPSS Inc., Chicago, IL, United States)andP< 0.05 was used as a statistically significant level.
RESULTS
Over the fifteen years follow-up from the 1766 NGT participants at baseline, 78 participants developed DM (7.4%), 255 participants progressed to IFG (24.1%) and 89 participants developed IGT (8.4%). Overall, 344 (32.6%) developed pre-diabetes and 630 (59.7%) participants remained NGT. Of this total, 714 were missed to follow up due to moving geographically, withdrawing consent or changing contact details and being unavailable.
Table 1 presents the anthropometric, laboratory and clinical characteristics at the beginning of the study for those participants who developed to diabetes and those who remained normal at follow up periods. All glycemic variables including PG in 0,30, 60 and 120 min, HbA1c, FPG, and total cholesterol and triglyceride as well as WHR were significantly different between diabetes and a normal group, particularly in total population and female group.
Table 2 presents the anthropometric measurements, laboratory and clinical characteristics at the beginning of the study for those participants who developed to pre-diabetes and those who remained normal. It illustrates a significant difference in glucose level at 0, 30, 60,120 min and triglyceride level, WHR and both systolic and diastolic blood pressure measurement in total population and female group when comparing pre-diabetes group with the normal group. There was a highly significant correlation in terms of MetS Z-score at first and last visits in the FDR population (r=0.67;P< 0.001) (Figure 1).
Figure 2 provides MetS Z-score at the first and final visits by diabetes disease status for two groups: Those who did not have diabetes at any of the two visits and those who developed T2DM between first and last visits.
Table 3 presents the results of crude and multivariable binary logistic regression analysis in different models for the association between MetS Z-score levels at baseline and diabetes and pre-diabetes risk at the future or at follow up. In crude logistic regression analysis, MetS Z-score level at baseline positively predicted the risk of future diabetes (RR = 1.94, RR = 3.84) and pre-diabetes (RR = 1.5, RR = 2.17) in total population and female group, respectively (allP< 0.05). However, significant results were not detected in the male group. In multivariable logistic regression analyses, the adjustment was made for age and gender as confounding factors (model). As illustrated in Table 3, the associations remained significant for diabetes (RR = 2.69, RR= 4.01) and prediabetes (RR = 1.76, RR = 2.07) in total population and female group,respectively (allP< 0.05). However, such significant results were not observed in the male group.
ROC curve analysis was used to determine the cutoff value of MetS Z-score at baseline for predicting diabetes and prediabetes in at follow up. The area under the ROC curve of MetS Z-score for predicting the incidence of diabetes and prediabetes is shown in Figure 3. A cutoff value 0.97 for MetS Z-score was obtained for differentiating the female patients with diabetes from normal with corresponding specificity of 56% and sensitivity of 72% and area under the ROC curve (AUC = 0.67,95%CI: 0.59-0.74;P< 0.05). A cutoff value 0.78 for MetS Z-score was obtained for differentiating the total population with diabetes from normal with corresponding specificity of 56% and sensitivity of 66% and area under the ROC curve (AUC = 0.63,95%CI: 0.57-0.69;P< 0.05). A cutoff value of Met Z-score at 0.94 was obtained for differentiating the female patients with prediabetes from normal people, with a corresponding specificity 58% and sensitivity 60% and area under the ROC curve of(AUC = 0.6, 95%CI: 0.55-0.64;P< 0.05) Also, a cutoff value of MetS Z-score 0.52 was obtained for differentiating total patients with prediabetes from normal people, with a corresponding specificity 72% and sensitivity 42% and area under the ROC curve of(AUC = 0.58, 95%CI: 0.54-0.61;P< 0.05) (Table 4).
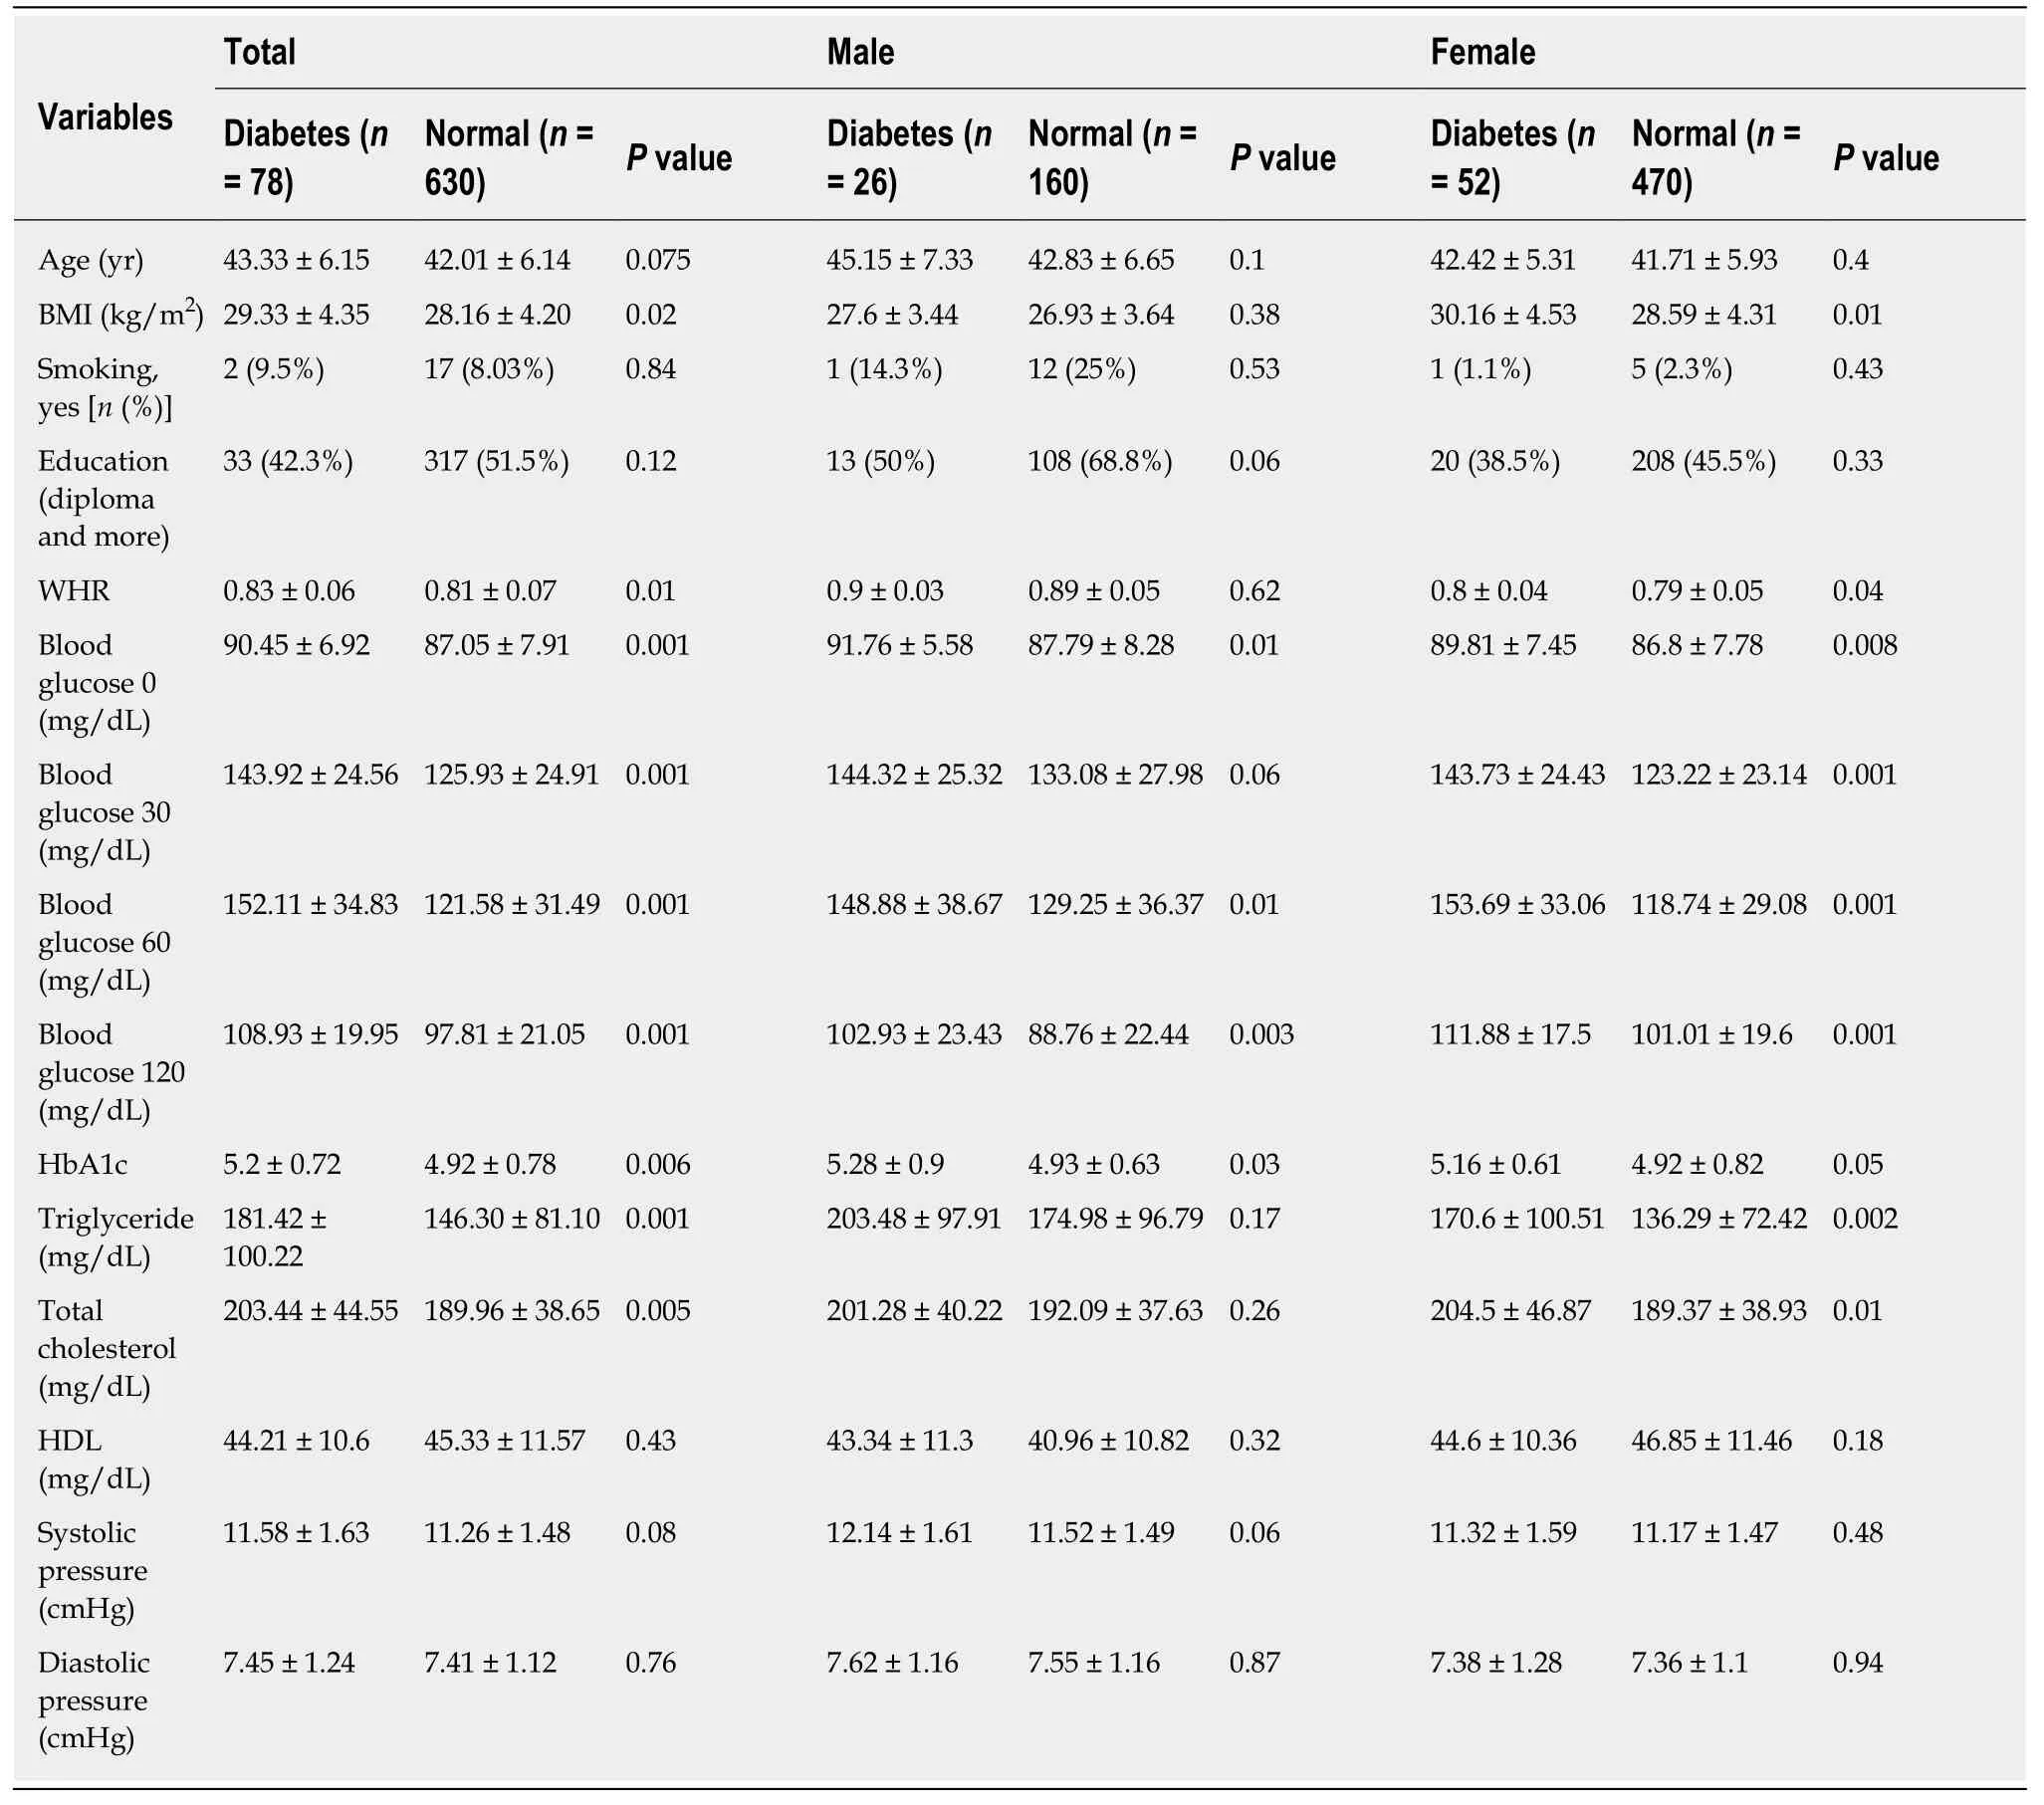
Table 1 Anthropometric, laboratory and clinical characteristics of first degree relatives of diabetes mellitus between normal and diabetic subjects in total population and sex difference
DISCUSSION
To our knowledge, this is the first population-based study conducted to evaluate the association between MetS Z-score and the incidence of pre-diabetes/T2DM in the FDR population who were normal at first visit.
This study discovered that the degree of severity of MetS score as a linear measure is a predictive factor for the incidence of T2DM and prediabetes in the future. This association was overall moderate in the total population (AUC = 0.63) and mildly stronger in the females (AUC = 0.68) of the FDR population. Previously, MetS Z-score was correlated similarly to the prediction of CVD[13]and diabetes[12]in the non-FDR population. DeBoeret al[12]concluded that the severity of MetS in childhood could predict the incidence of adult T2DM in the future. In other studies, a strong correlation between MetS Z-score and HbA1c, fasting insulin and insulin resistance has been illustrated[28]. These findings suggest that MetS Z-score can potentially be used to detect risk and follow T2DM progression over time[12].
It has been reported that childhood MetS Z-score can predict diabetes risk in the future with an OR of 2.7 by the mean age of 38.5[12]. We found similar results: In the total FDR population, the RR for each 1.0 unit increase in the adulthood MetS Z-score in predicting diabetes and pre-diabetes by a mean age of 43 was 2.69 and 1.76 respectively.
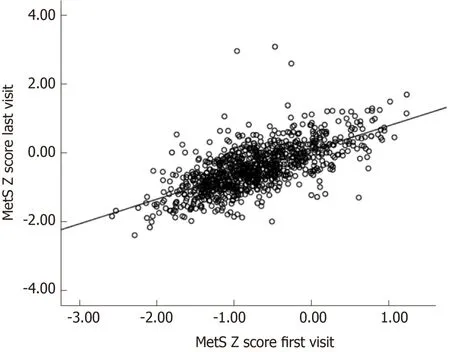
Figure 1 Correlation of metabolic syndrome severity scores within individuals over time.
Besides, MetS Z-score is associated with childhood obesity and is a significant risk factor for prediabetes and progression to T2DM[29]. Currently, there is an epidemic of obesity in the world which begins early in life. Tools such as MetS Z-score can be utilized to diagnose the population at higher risk for future disease and assisting primary prevention by suggesting lifestyle modifications[5].
Measuring MetS has its limitations. Firstly, it is difficult to monitor changes in MetS over time[30,31]. Secondly, despite evidence demonstrating that elevated WC or high triacylglycerol levels have a more important role and stronger association with MetS risk over time due to abnormal cellular processes involved, in this method of measurement equal importance is given to all of the components of MetS[32,33]. Thirdly,gender, race and ethnicity cause variation in the MetS value, for example, African American men have a low prevalence of MetS despite having high rates of T2DM and death from cardiovascular disease[34-36].
All of the available data establishes the necessity of using a continuous measurement of MetS for clinical applications. Gurkaet al[37,38]have formulated sexand race/ethnicity-specific MetS Z-score. The standardized Z-scores for each component coming together creates an overall estimate of the severity of MetS[24]with a linear association with future risk of T2DM and offers a tool for monitoring treatment efficacy[12].
The role of genetic factors in MetS cannot be ignored[15]. The association of oxidative stress with inflammatory processes and MetS Z-score has been studied[5,39]. In our study, the high correlation between these scores over 15 years suggests a degree of consistency of MetS in a given individual over time or a genetic susceptibility in the FDR population.
Several studies on FDR individuals indicated that alteration in carbohydrate and lipid metabolism including central obesity, dyslipidemia, glucose intolerance, and high blood pressure start at an early age[40,41]. Siewertet al[19]illustrated that the prevalence of MetS is high in young FDR adults, and since MetS and T2DM are closely related diseases and are driven by the same metabolic disturbances,preventive measures at an early age seem appropriate.
The prevalence of MetS is influenced by various factors such as gender,environmental and cultural in addition to genetic factors[42].
Similar to the USA the prevalence of MetS is higher in women than men in Iran[43,44].This sex difference can be explained by a statistically significant higher prevalence of MetS components in women and agrees with the results of our study. In the FDR population, women with higher WHR, TG, and cholesterol than normal women had a higher chance to progress to diabetes or prediabetes while such a difference was not observed in male FDRs. The differences in lipid profile could be explained by hepatic lipase activity, patterns of diet and physical activity. Women show a sharp decline in physical activity at adolescence as compared to men, and this could explain the higher prevalence of obesity in women[43].
Recently, during one cohort study in Iran, the paternal history of T2DM was independently associated with increased risk for pre-diabetes/T2D in adolescence[HR = 1.63 (1.02-2.60)][45]. One of our other studies reported that the glycemic response to OGTT may predict the risk of development to T2DM in the FDR population[46].
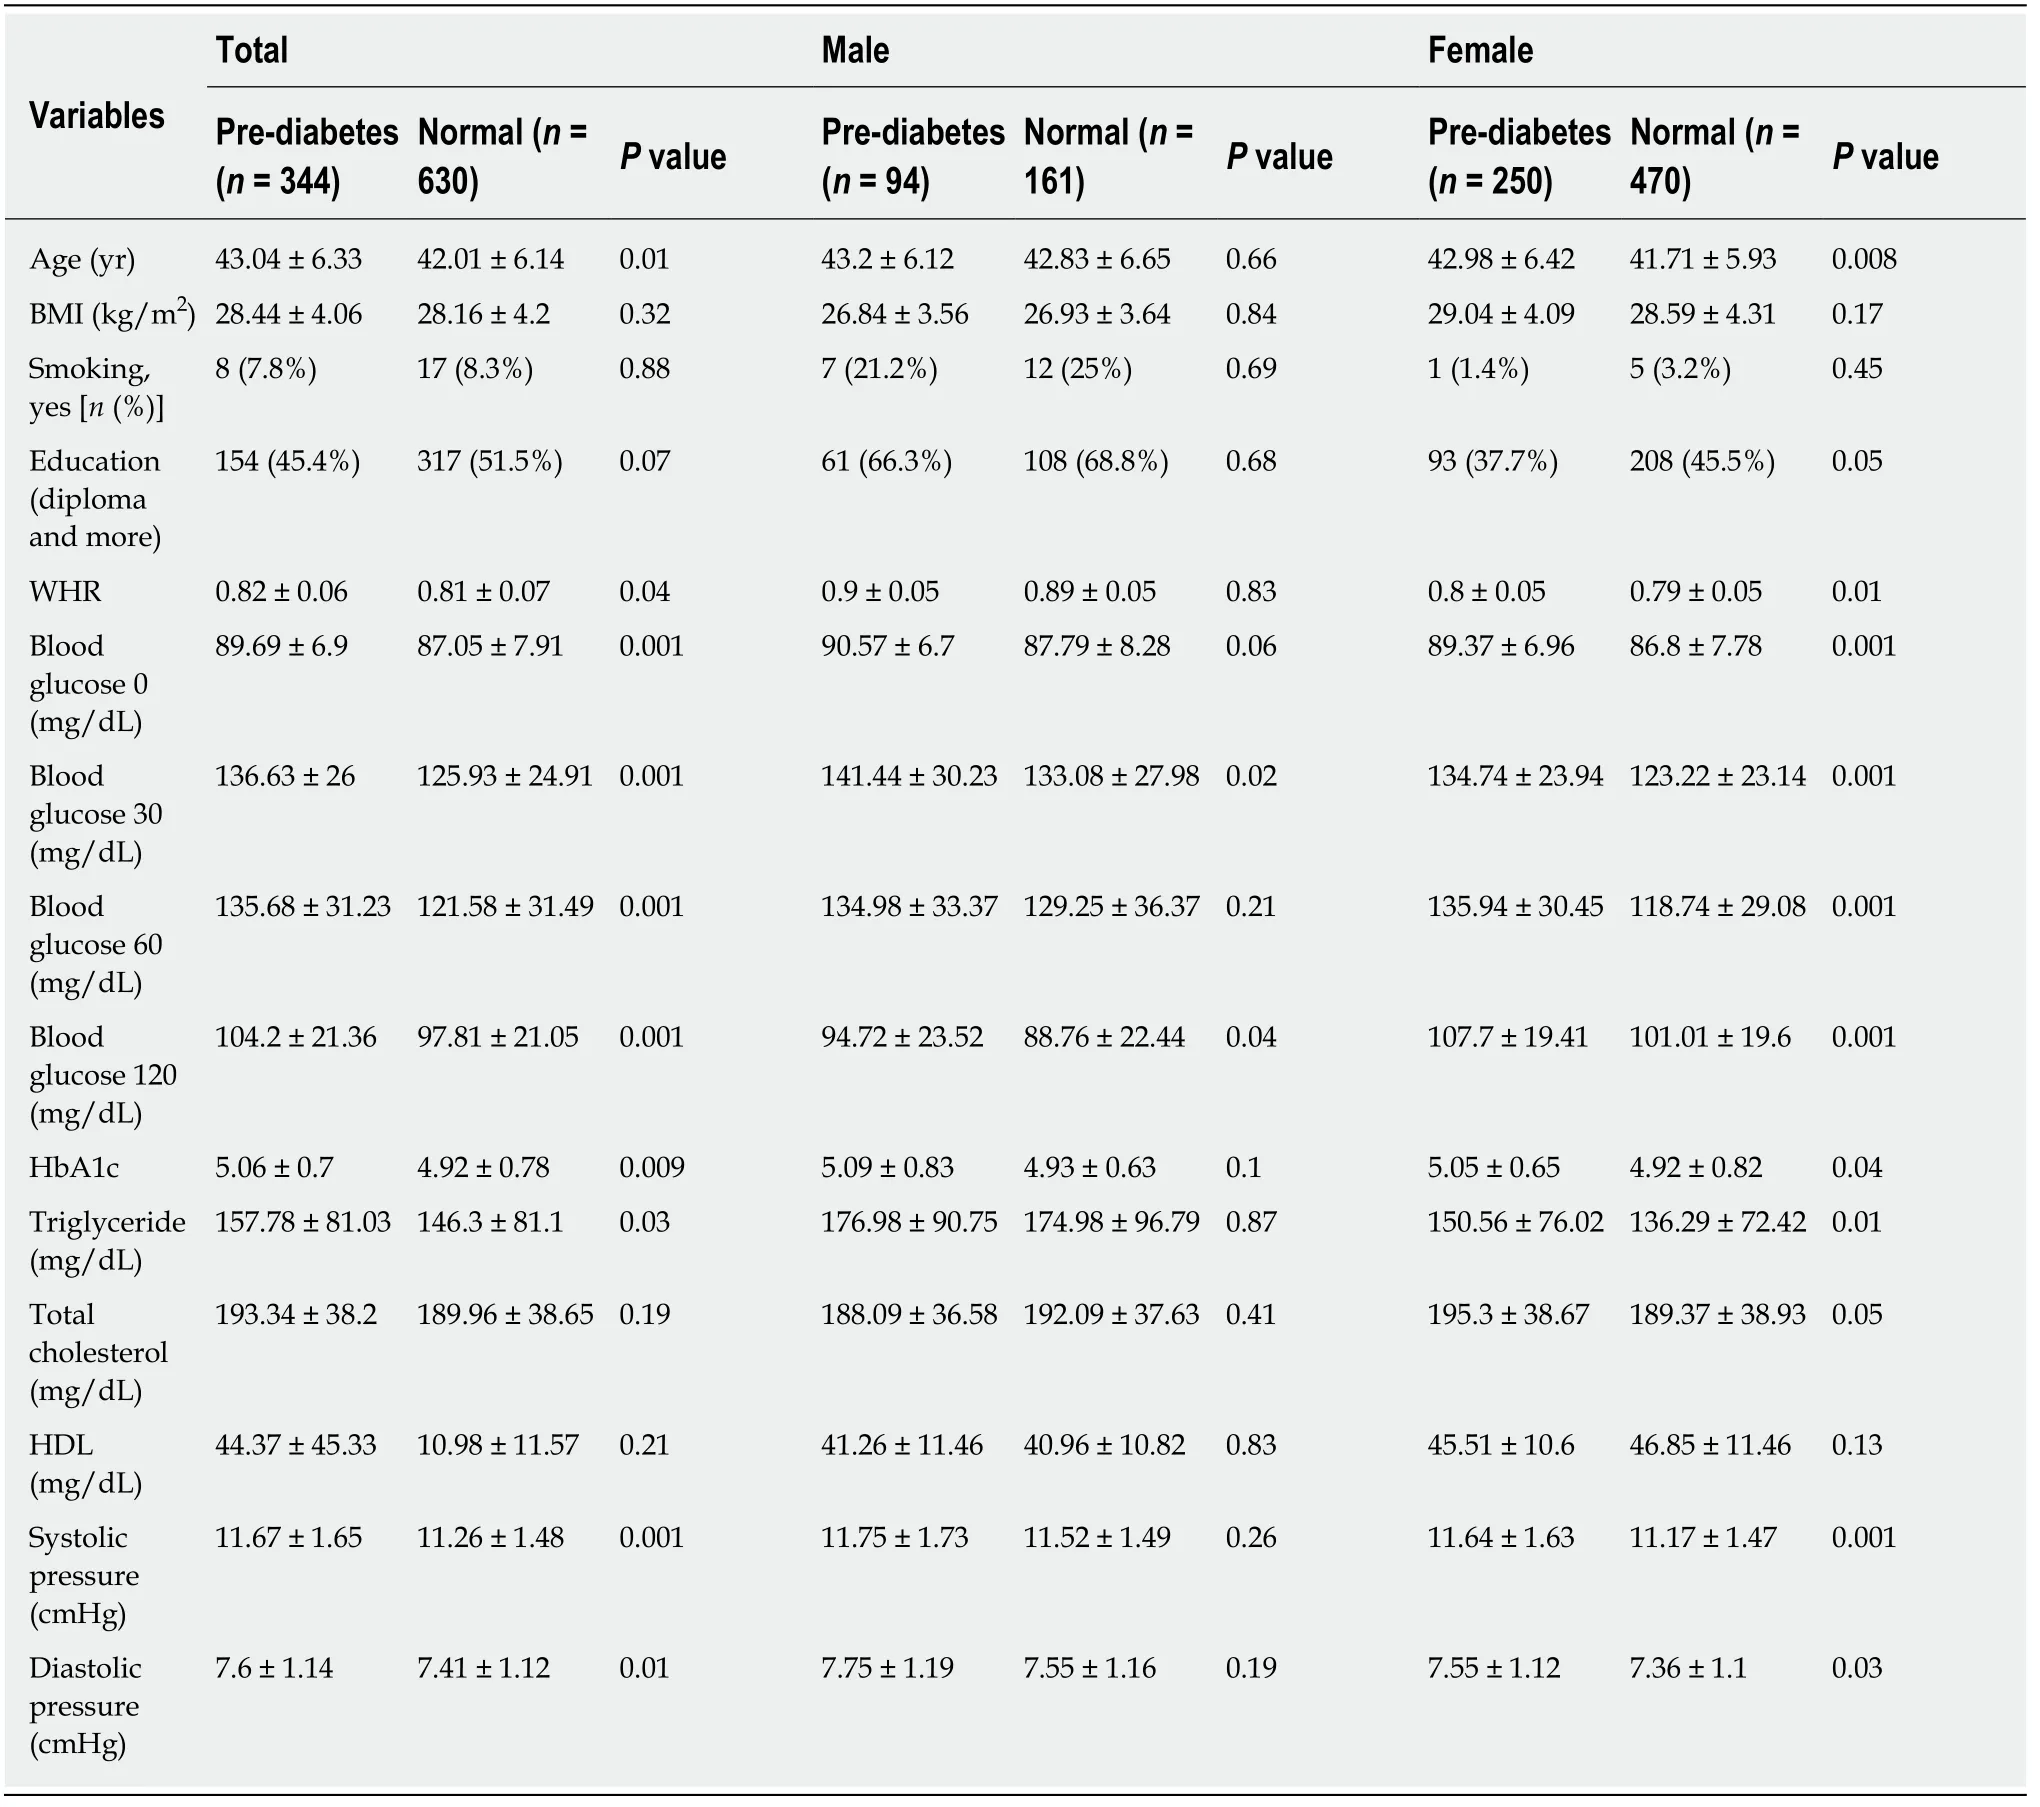
Table 2 Anthropometric, laboratory and clinical characteristics of first degree relatives of type 2 diabetes mellitus between normal and pre-diabetes subjects at total population and sex categories
In summary, our study has suggested that MetS Z-score at baseline, in FDR of T2DM patients with normal glucose tolerance, predicts the incidence of future diabetes and prediabetes. In this study, the cutoff values of MetS Z-score for predicting prediabetes and diabetes were 0.94 and 0.97, respectively. This negligible difference between two groups in terms of cutoff values highlights the importance of intervention at the prediabetes stage. Elevated levels may also be used to motivate patients to increase their physical activity or adopt a healthy diet to reverse the prediabetic state[47]. Appropriate interventions at an earlier stage in MetS may be considered as an effective strategy for preventing the development of diabetes and prediabetes in such a high-risk population.

Table 3 Relationship between metabolic syndrome severity Z-score and risk of diabetes and pre-diabetes in first degree relatives of type 2 diabetes mellitus

Table 4 Area under the curve, sensitivity and specificity of metabolic syndrome severity Z-score for predicting the risk of affecting by diabetes and pre-diabetes in future for first degree relatives of type 2 diabetes mellitus when they are normal glucose tolerance at the begging of study
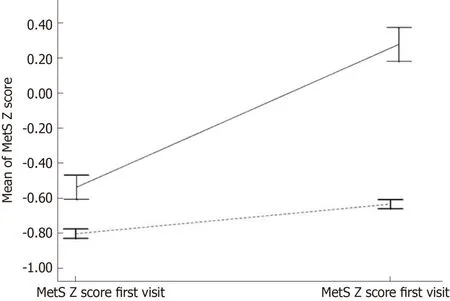
Figure 2 Mean metabolic syndrome severity scores within individuals by later diabetes status.
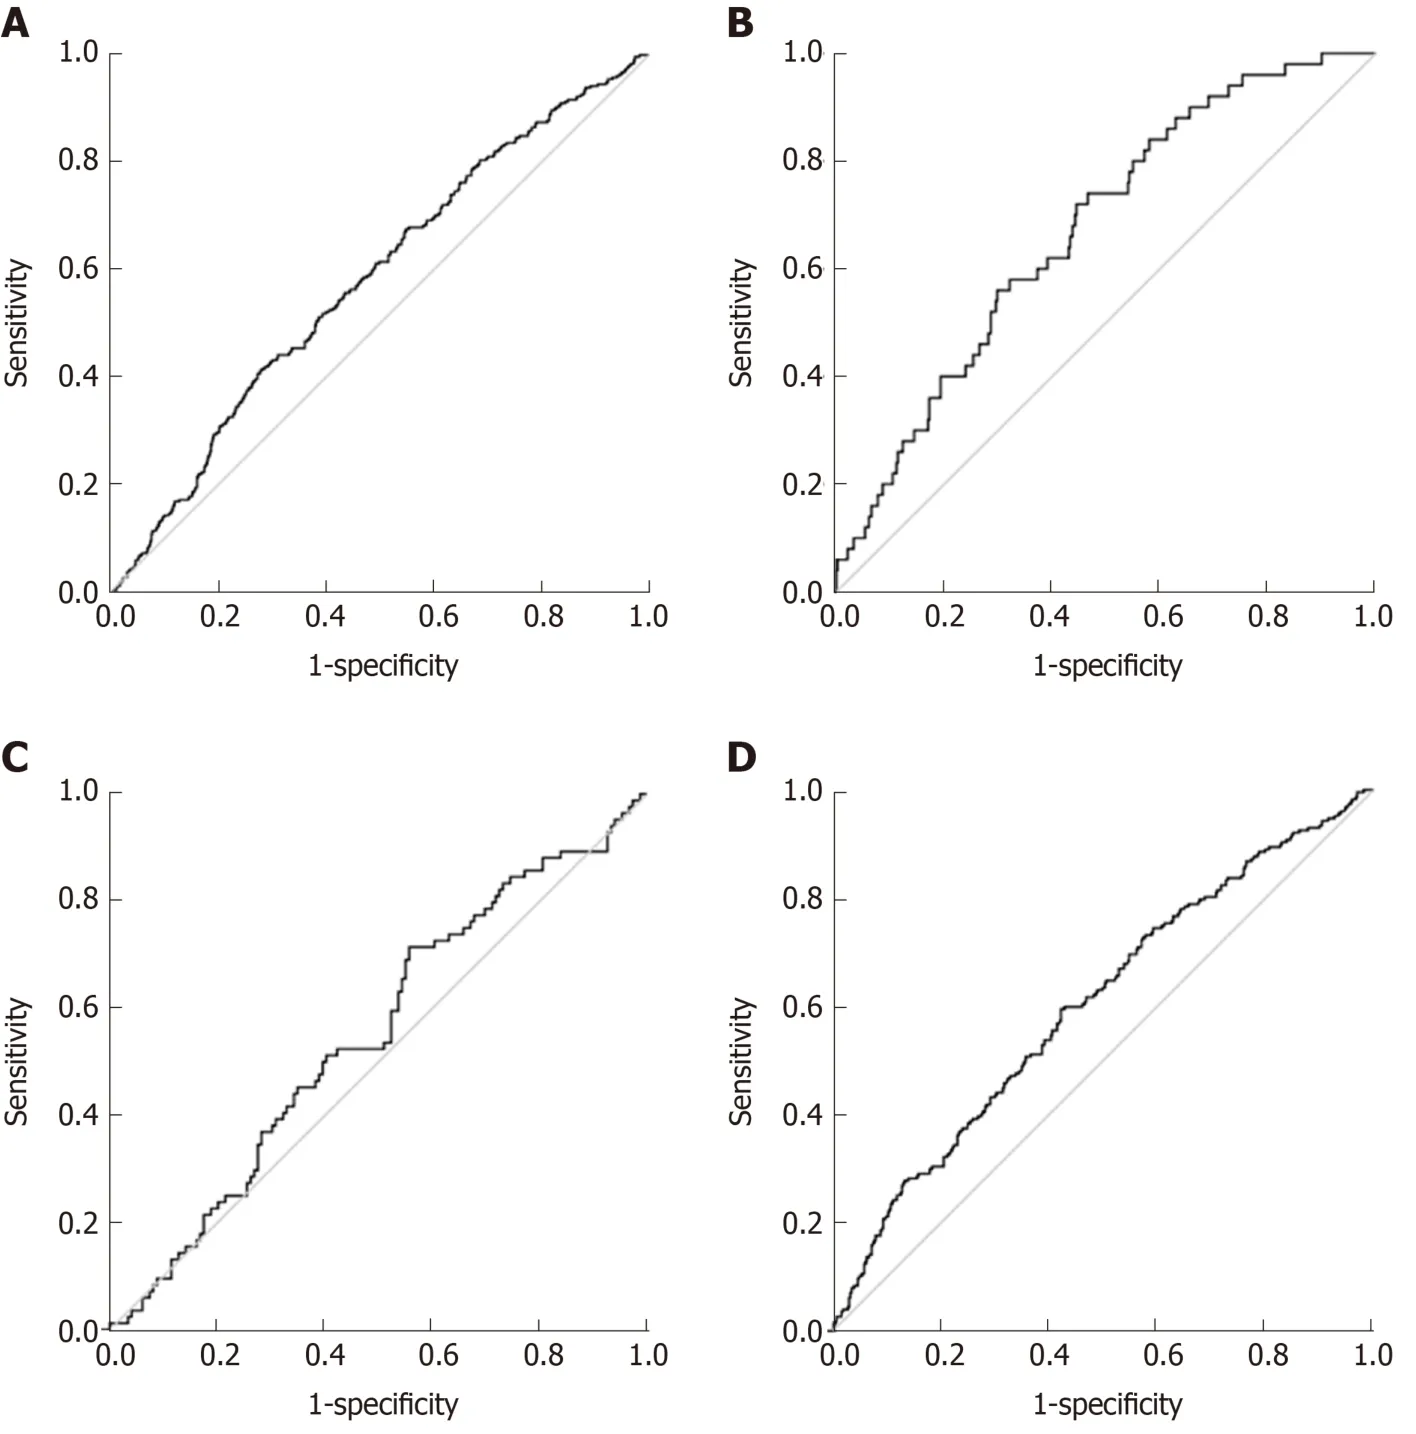
Figure 3 Receiver operating characteristic curves of metabolic syndrome Z-score.
ARTICLE HIGHLIGHTS
Research background
There is potential links between MetS Z-score as a marker for prediabetes or type 2 diabetes mellitus (T2DM) risk.
Research motivation
Iran is a developing country and its population is adopting a more sedentary lifestyle with new diets resulting in a high prevalence of T2DM and prediabetes.
Research objectives
In this study, the association the of severity of MetS Z-score in FDRs of T2DM was assessed with the risk of prediabetes and type 2 diabetes in future.
Research methods
In a prospective cohort study during a long-term follow-up period for the first time in Iran and as one of scare studies around the world we evaluated the predictive role of MetS Z-score for prediabetes and diabetes incidence risk in future among normal glucose tests. Our study results help clinicians to identify and treat this high-risk population through conducting of interventions for preventing MetS or diminishing its side effects.
Research results
MetS Z-score at the baseline, is a significant predictor for developing future T2DM and prediabetes in total population and female group. Reliable cut off values with high accuracy were obtained in the receiver operating characteristic curve analysis based on the MetS Z-score for differentiating patients with diabetes and prediabetes from the normal population.
Research conclusions
MetS Z-score is a significant predictor for incidence of diabetes and prediabetes risk in future in high risk population of FDR and cut off value for MetS score was not notably different for those people who affected by diabetes and prediabetes. This negligible difference between two groups in terms of cut off values highlights the importance of intervention at the prediabetes stage.
Research perspectives
The FDR people with high risk of developing diabetes and prediabetes are identifiable based on MetS Z-score. Accordingly, appropriate interventions at an earlier stage in MetS may be considered as an effective strategy for preventing the development of diabetes and prediabetes in such a high-risk population.
杂志排行
World Journal of Diabetes的其它文章
- Role of sodium-glucose co-transporter-2 inhibitors in the management of heart failure in patients with diabetes mellitus
- Evaluation of oxidative stress levels in obesity and diabetes by the free oxygen radical test and free oxygen radical defence assays and correlations with anthropometric and laboratory parameters
- Maternal low protein diet induces persistent expression changes in metabolic genes in male rats
- Fundamentals about onset and progressive disease character of type 2 diabetes mellitus
- Shared (epi)genomic background connecting neurodegenerative diseases and type 2 diabetes
