Zircon saturation model in silicate melts:a review and update
2020-06-22TongbinShaoYingXiaXingDingYongfengCaiMaoshuangSong
Tongbin Shao·Ying Xia·Xing Ding,3·Yongfeng Cai·Maoshuang Song
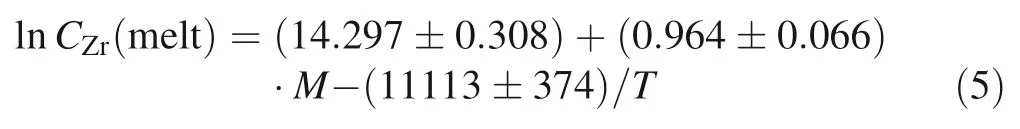
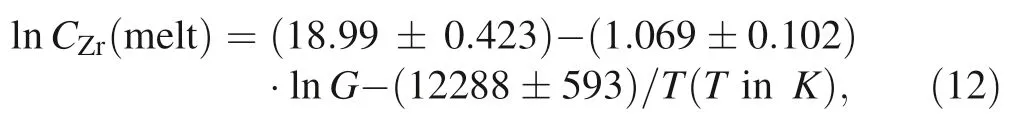
Abstract Zircon stability in silicate melts—which can be quantitatively constrained by laboratory measurements of zircon saturation—is important for understanding the evolution of magma.Although the original zircon saturation model proposed by Watson and Harrison(Earth Planet Sci Lett 64(2):295–304,1983)is widely cited and has been updated recently,the three main models currently in use may generate large uncertainties due to extrapolation beyond their respective calibrated ranges.This paper reviews and updates zircon saturation models developed with temperature and compositional parameters.All available data on zircon saturation ranging in composition from mafic to silicic (and/or peralkaline to peraluminous)at temperatures from 750 to 1400 °C were collected to develop two refined models (1 and 2) that may be applied to the wider range of compositions.Model 1 is given by lnCZr(melt)=(14.297 ± 0.308)+(0.964 ± 0.066)·M -(11113 ± 374)/T,and model 2 given by lnCZr(melt)=(18.99 ± 0.423) -(1.069 ± 0.102)·lnG -(12288 ±593)/T,where CZr(melt) is the Zr concentration of the melt in ppm and parameters M [=(Na+K+2Ca)/(Al·Si)] (cation ratios) and G [=(3·Al2O3+SiO2)/(Na2-O+K2O+CaO+MgO+FeO)] (molar proportions)represent the melt composition.The errors are at one sigma,and T is the temperature in Kelvin.Before applying these models to natural rocks,it is necessary to ensure that the zircon used to date is crystallized from the host magmatic rock.Assessment of the application of both new and old models to natural rocks suggests that model 1 may be the best for magmatic temperature estimates of metaluminous to peraluminous rocks and that model 2 may be the best for estimating magmatic temperatures of alkaline to peralkaline rocks.
Keywords Zircon·Zircon saturation·Model·Silicate melt·Mafic to silicic melts·Peraluminous to peralkaline compositions·Igneous rocks·Thermometer
1 Introduction
Zircon (ZrSiO4) is found in a wide range of evolved igneous rocks with peraluminous to peralkaline compositions (e.g.,Dai et al.2011; Liu et al.2006),and it is a chemically and physically robust accessory mineral that can be also found in metamorphic rocks (e.g.,Sláma et al.2007; Wang and Griffen 2004) and sedimentary rocks(Anthony et al.2003; Shao et al.2016; Zhou et al.2015).Zircon is a key mineral to understand the geological history of the Earth (Cherniak and Watson 2003) due to two important characteristics that it possesses:(1)it is a host for many geochemically important indicator elements[such as high field strength elements (HFSE),rare earth elements(REE) and radioactive elements uranium (U) and thorium(Th)] (Fourcade and Allegre 1981; Gromet and Silver 1983; Harrison et al.1986),which in turn affects the behavior of these elements during magma crystallization(Belousova et al.2002);and(2)it has been widely used in geochronology (e.g.,U–Th–Pb dating) in the past several decades as it concentrates U and Th while excluding Pb.However,it is a prerequisite to ensure that those zircons crystallized from the host magmatic rock when dating a host magmatic rock using zircon (e.g.,Siégel et al.2018).For this purpose,it is necessary to determine the stability of zircon in magmatic liquid,existing knowledge of which comes mainly from high-temperature,high-pressure laboratory measurements(e.g.,Boehnke et al.2013;Gervasoni et al.2016; Harrison and Watson 1983,2003; Keppler 1993; Shao et al.2019; Zhang and Xu 2016).
Over the past six decades,numerous experiments have been conducted to investigate zircon stability in magmatic melts,among which most have focused on silicic and intermediate compositions (e.g.,Baker et al.2002;Boehnke et al.2013;Dietrich 1968;Ellison and Hess 1986;Gervasoni et al.2016;Hanchar and Watson 2003;Harrison and Watson 1983,2003; Keppler 1993; Larsen 1973;Watson 1979; Watson and Harrison 1983; Zhang and Xu 2016),while only a few have focused on mafic compositions (Dickinson and Hess 1982; Shao et al.2019).The results generally showed a strong dependence of zircon saturation on melt composition and temperature but a weak dependence on pressure and water content.To quantify the effect of melt composition,some studies proposed several important parameters [e.g.,M in Watson and Harrison(1983);FM in Ryerson and Watson(1987);G in Gervasoni et al.(2016)].Of these parameters,M[=(Na+K+2Ca)/(Al·Si)] (cation ratio) is an appropriate compositional proxy for the chemical interactions through which zircon is dissolved (Watson and Harrison 1983; Hanchar and Watson 2003;Boehnke et al.2013).Qualitatively,the factor M is the reciprocal of the factor ASI,i.e.the ‘‘aluminum saturation index,’’which was defined as the molar ratio Al/(Na+K+Li) by Zen (1986).Parameter FM{=[Na+K+2·(Ca+Mg+Fetotal)]/(Al·Si)}(cation fraction),which is a modification of the M parameter and includes the effects of Mg and total Fe as a network modifier,constrains rutile solubility in magmas (Ryerson and Watson,1987).Parameter G,in contrast,was defined as G=(3·Al2O3+SiO2)/(Na2O+K2O+CaO+MgO+FeO) (molar ratio),where the numerator(3·Al2O3+SiO2) represents the network formers,the denominator (Na2O+K2O+CaO+MgO+FeO) represents the network modifiers of the melt,and all iron is considered to be Fe2+.Combined with temperature,parameters M and G were used by Watson and Harrison(1983)(hereafter referred to as WH83)and Gervasoni et al.(2016) (hereafter referred to as G16),respectively,to propose zircon saturation models,given by

where Kd,which is calculated by CZr(zircon)/CZr(melt),is the partition coefficient of Zr between zircon [CZr(zircon)=496,000 ppm] and melt (in ppm); T is the temperature in K; and

where T is the temperature in°C,the errors are given at one sigma,and the determination coefficient is R2=0.90.
The above two models were updated recently.By optimizing the calculation of the coefficients in the WH83 model based on all available solubility data in a variety of melt compositions,Boehnke et al.(2013) (hereafter referred to as B13) proposed a refined model,given by:

where the errors are given at one sigma and T is the temperature in K.However,the results of Zhang and Xu(2016) on several rhyolitic melts showed a strong dependence of zircon saturation on temperature but a weak dependence on pressure and melt composition,which is somewhat inconsistent with the trend given by both the WH83 and B13 models.
In addition,the WH83 and B13 models are derived from melt composition data of 1.3 ≤M ≤2 and within a temperature range from 750 to 1020 °C,while the G16 model extended the experimental database for zircon solubility with new bulk compositions in more alkaline systems(i.e.,M >2)and performed experiments at higher temperatures.Most recently,Shao et al.(2019) (hereafter referred to as S19) reported,for the first time,zircon saturation in a terrestrial basaltic melt as a function of temperature,pressure,water content,and melt composition.They proposed a refined model,given by (with 1σ errors):

which is similar to the G16 model but shows a slightly higher temperature dependence of zircon saturation.Theoretically,data on zircon saturation in peralkaline mafic melts should provide an upper limit,below which zircon is likely to crystallize in igneous rocks.Based on the original WH83 model,the quantification of zircon saturation in silicic and intermediate compositions has recently become a major research topic,and this interest has resulted in disagreements and different models (e.g.,Boehnke et al.2013; Gervasoni et al.2016; Zhang and Xu 2016).For instance,both the WH83 and B13 models were specifically formulated to address peraluminous and metaluminous compositions,while the G16 model was specifically designed to address more alkaline compositions.Notably,the use of the three (essentially two) previous models(Boehnke et al.2013; Gervasoni et al.2016; Watson and Harrison 1983)at T <800 °C and T >1200 °C,which are outside the calibrated ranges,will lead to greater uncertainty due to extrapolation.
The goals of this review are to discuss the role of melt composition on zircon saturation and to develop refined models,which are then compared with the old models for selected examples of applications in order to determine whether one model can be applied to all mafic to silicic melts with peraluminous to peralkaline compositions.
2 Zircon saturation models
In the following,we used all available data to update the existing models of zircon saturation in silicate melts and propose new models based on temperature and compositional parameters.The goal is to produce a refined model that can be theoretically applied to all mafic to silicic melts with peraluminous to peralkaline compositions.In addition,it should be noted that,in the following sections,the difference in the number of data points selected for different fittings is not related to heavy data selection but rather to differences in the number of parameters calculated using the available data (Table S1).
2.1 Refining the WH83 model

Fig.1 Data from the literature (Boehnke et al.2013; Ellison and Hess 1986; Gervasoni et al.2016; Rubatto and Hermann 2007; Shao et al.2019; Watson and Harrison 1983) plotted on a graph of lnCzr(melt) (i.e.,Zr required for saturation) versus inverse absolute temperature and M=(Na+K+2Ca)/(Al·Si).Each white circle denotes the data from each experiment
In previous studies,zircon solubility was found to increase from peraluminous to peralkaline compositions (e.g.,Linnen and Keppler 2002;Watson,1979),and this pattern was recently confirmed by Gervasoni et al.(2016).Furthermore,zircon solubility is more sensitive to changes in the temperature or ASI of the melt than it is to the flux content(Van Lichtervelde et al.2010).In Fig.1,solubility data from several previous studies(Boehnke et al.2013;Ellison and Hess 1986; Gervasoni et al.2016; Rubatto and Hermann 2007; Shao et al.2019; Watson and Harrison 1983;Zhang and Xu 2016) are plotted on a graph of lnCZr(melt)(i.e.,the Zr content in the melt required for saturation)versus inverse absolute temperature and M.Without smoothing,the lnCZr(melt) curve displays a jagged shape,which may be mainly due to uncertainties in both experimental temperature and microprobe analyses.For example,the uncertainty in the temperature measurements in pistoncylinder experiments is usually reported only as the error in the thermocouple reading.Thus,the real uncertainties are likely underestimated.Temperature and melt composition are the two main factors controlling the solubility of zircon,and other subordinate factors are not included in the figure.A similar situation is also reflected in Fig.9f of Zhang and Xu (2016).Using the B13 model,Zhang and Xu (2016)found that the largest errors occur for a lunar basaltic melt(Dickinson and Hess 1982),which may result from the compositional difference between lunar basalts and terrestrial melts.After adding the data from Gervasoni et al.(2016) and Shao et al.(2019) and making certain changes,Fig.9f of Zhang and Xu(2016)is updated to Fig.2a in this paper.In Fig.2a,the red line,given by lnKd-+1.16·(M -1)=10.935·1000/T -1.885,is fitted to all 168 data points,the solid black line is Eq.(2) (Boehnke et al.2013),and the dotted line shows the equation of Zhang and Xu(2016).As shown in this figure,most of the data points fit better close to both red and black lines,suggesting that the equation of Boehnke et al.(2013) may describe the general trend.At the experimental temperature of 1300 °C,however,mafic samples Z13 (M=3.31) and Z14 (M=3.64) of Shao et al.(2019) display abnormally low zircon saturation values relative to mafic sample Z8(M=3.34) (Table S1),resulting in those samples being plotted far from the fit line.According to the temperatures calculated with our new models in the following sections,the large errors associated with these two mafic samples(i.e.,Z13 and Z14) may be primarily attributed to the uncertainty in the temperature measurements,as all existing zircon saturation models (Boehnke et al.2013;Gervasoni et al.2016; Shao et al.2019; Watson and Harrison 1983; Zhang and Xu 2016) show that saturation increases with increasing temperature.Nevertheless,compositional differences between terrestrial mafic and intermediate-silicic melts may be also an important factor that should be considered when interpreting large errors since the B13 model was developed based on zircon solubility data from intermediate to silicic compositions and was not calibrated for mafic melts and peralkaline compositions.

Fig.2 Z=lnKd+1.16·(M-1) vs.1000/T (T in K) in (a) and Z=lnKd+0.964·(M-1) vs.1000/T (T in K) in (b) for zircon saturation data from the literature (Baker et al.2002; Boehnke et al.2013;Dickinson and Hess 1982; Ellison and Hess 1986; Gervasoni et al.2016; Harrison and Watson 1983; Keppler 1993; Rubatto and Hermann 2007; Shao et al.2019; Watson and Harrison 1983; Zhang and Xu 2016).The solid red line is fitted to all 168 data points,the solid black line is the equation of Boehnke et al.(2013),and the dotted line represents the equation of Zhang and Xu (2016)
Recently,Gervasoni et al.(2016) used parameters such as T,water content,P,M,G,FM,ASI,NBO/T,silica content,and CZr(melt).Similarly,we employed the multiple linear regression routine of the OriginPro-8.5®software to fit up to 168 data points (Baker et al.2002;Boehnke et al.2013;Dickinson and Hess 1982;Ellison and Hess 1986; Gervasoni et al.2016; Harrison and Watson 1983; Keppler 1993; Rubatto and Hermann 2007; Shao et al.2019; Watson and Harrison 1983; Zhang and Xu 2016)and optimize the calculation of the coefficients in the zircon saturation model.Unfortunately,because the effects of water content and pressure are generally weak (e.g.,Boehnke et al.2013; Shao et al.2019) and the associated data are relatively scarce,they cannot be functionalized and included in the zircon saturation model at this time.By fitting all 168 data points,we propose a refined model linking zircon saturation in melt with compositional parameter M and temperature as follows:
with R2=0.885 and T in K (Fig.2b).
2.2 Refining the G16 model
To check the applicability of the G16 model,we collected all available data from various studies (Ellison and Hess 1986; Rubatto and Hermann 2007; Shao et al.2019;Watson and Harrison 1983),including the data of Boehnke et al.(2013) and Gervasoni et al.(2016).Thus,we compared all these data using the G16 model.In the sequence,by the uncertainties seen using the G16 model,we refined this model.As shown in Fig.3a,the blue line,representing the G16 model,fits only the Gervasoni et al.(2016) data and part of the Boehnke et al.(2013)data but fails to fully describe certain data on alkaline composition (G ranges from 2.27 to 4.27) from Shao et al.(2019) or any of the data on aluminous composition (G varies from 7.01 to 10.51) from Rubatto and Hermann (2007).In contrast,the black line showing the S19 model,which was obtained by keeping the coefficients before the lnG constant and is given by (with 1σ errors):

provides a better description than the G16 model.Furthermore,using parameter G and temperature to fit all these data,we obtain the following model (with 1σ errors):
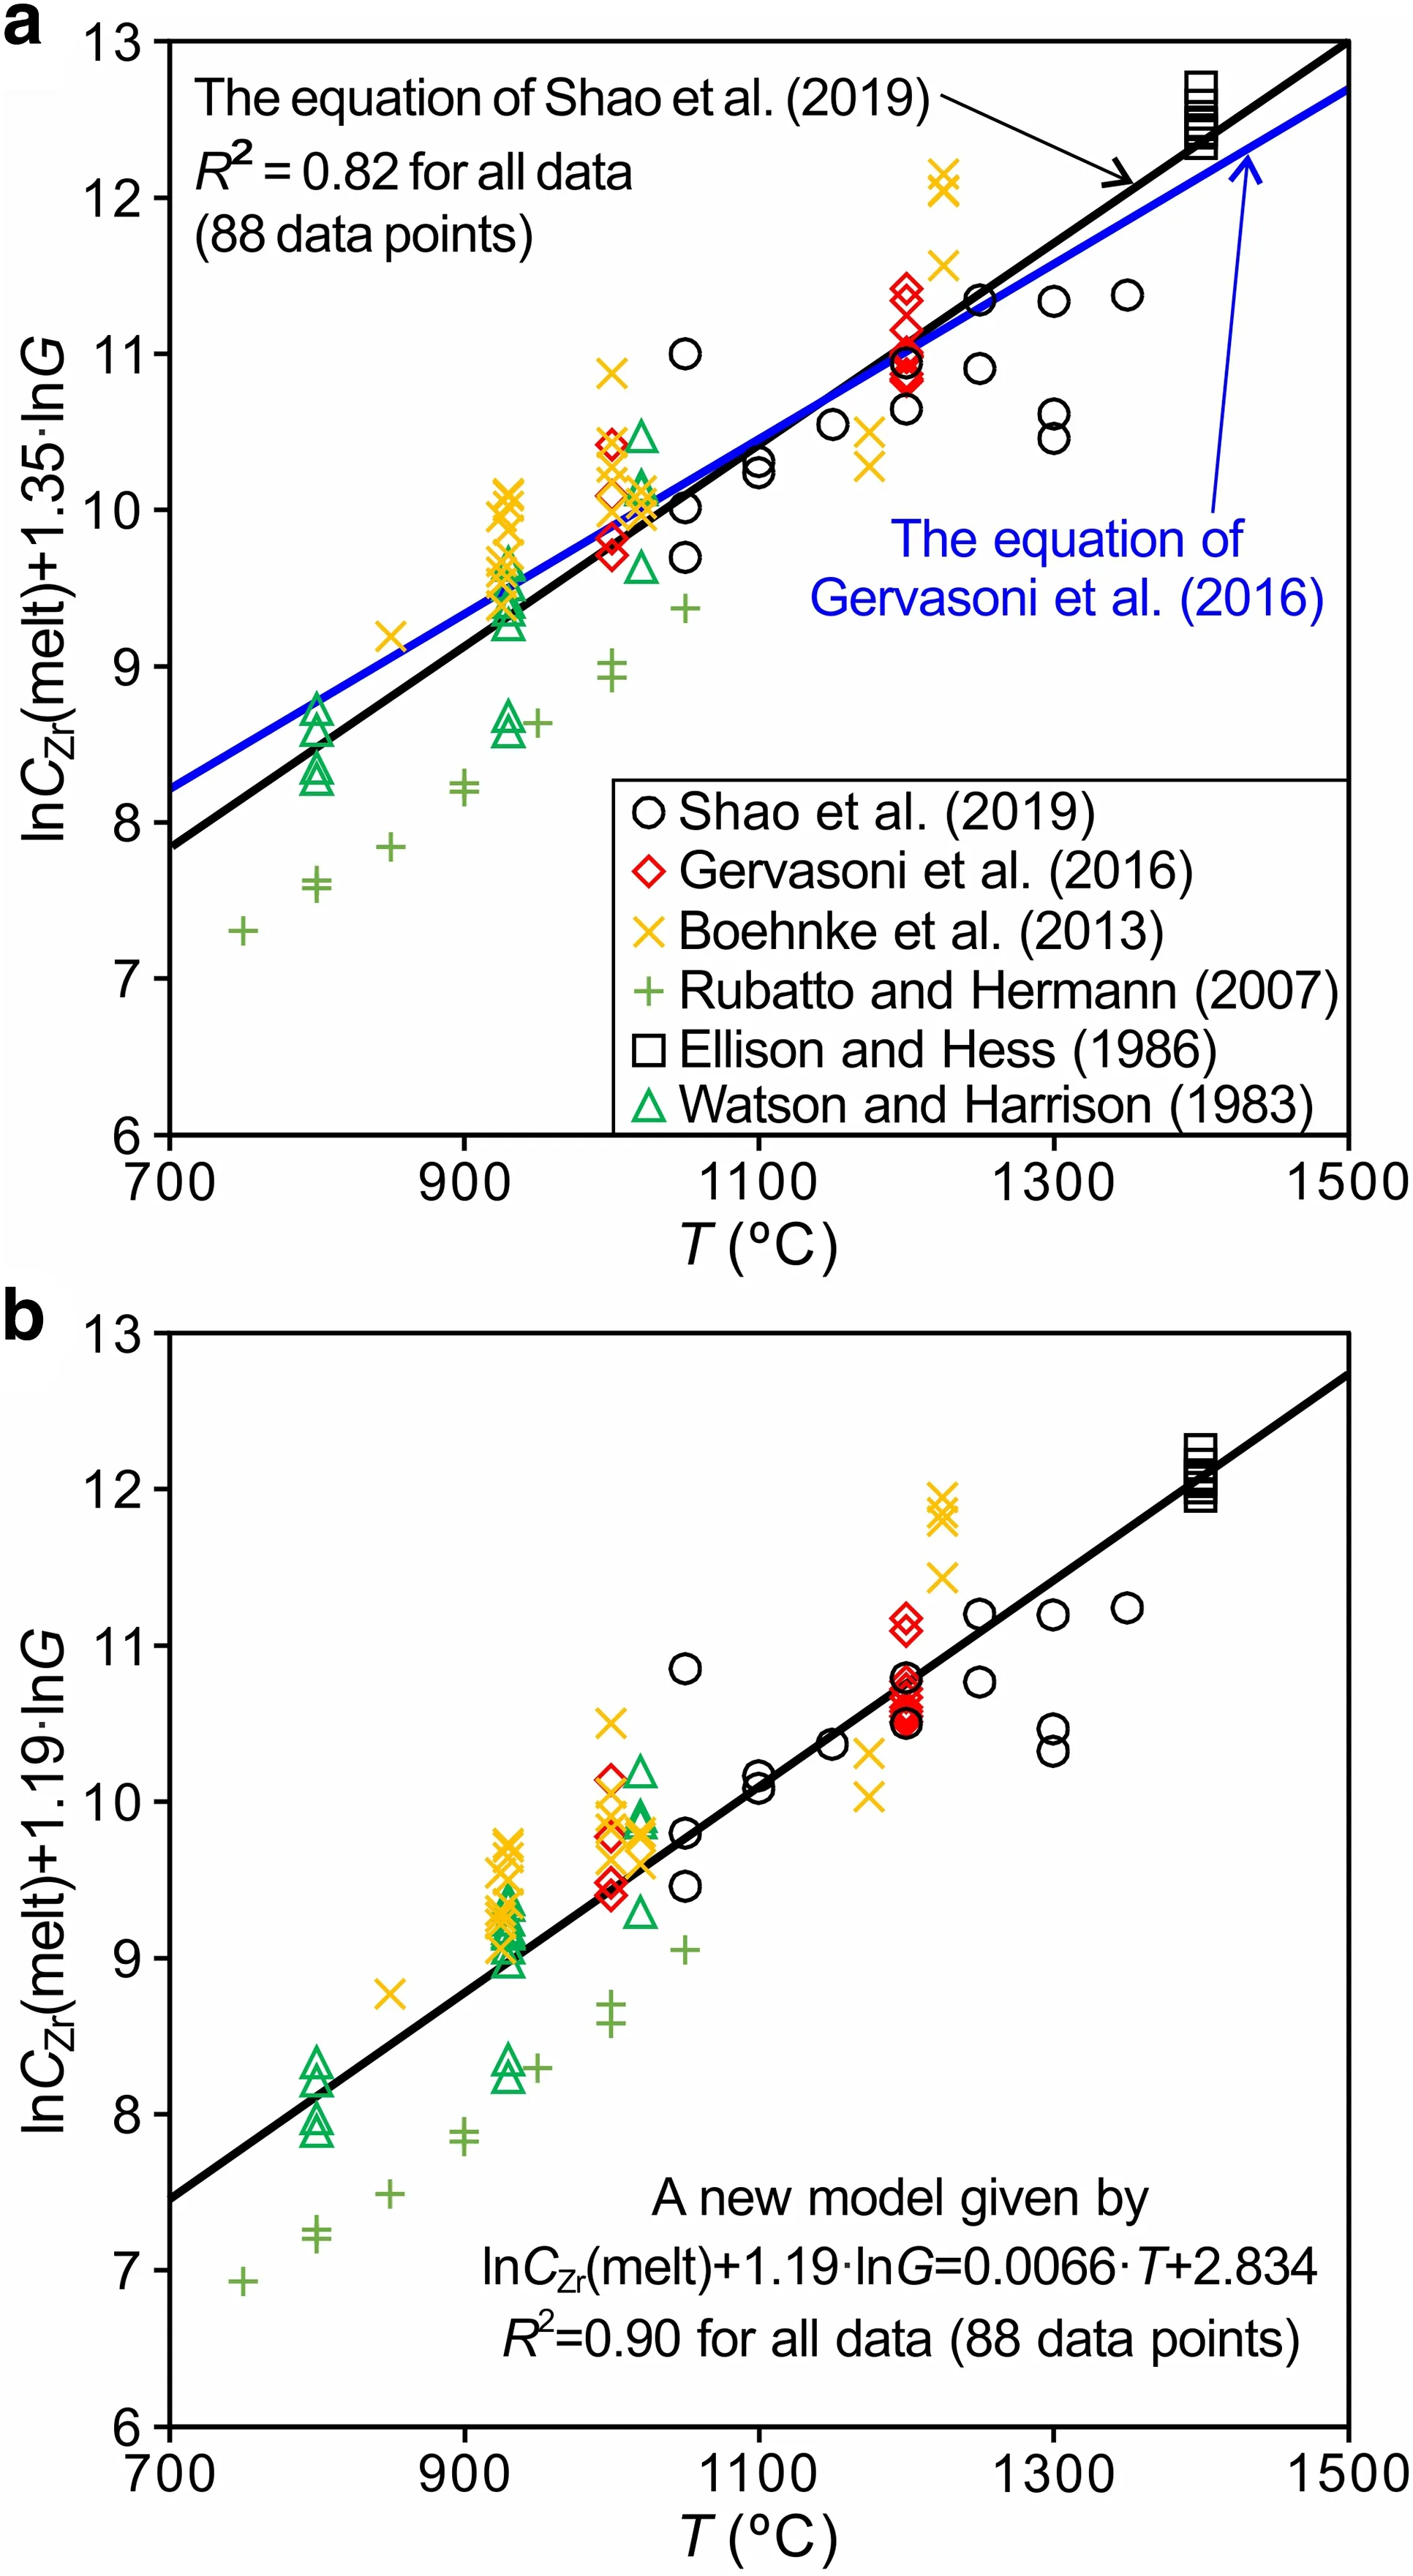
Fig.3 lnCZr(melt)+1.35·lnG vs.T(T in°C)in(a)and lnCZr(melt)+1.188·lnG vs.T (T in °C) in (b) for 88 data points from the literature (Boehnke et al.2013; Ellison and Hess 1986; Gervasoni et al.2016;Rubatto and Hermann 2007;Shao et al.2019;Watson and Harrison 1983).In Fig.3a,the blue line is the equation of Gervasoni et al.(2016),and the black line shows the S19 model,which is an update of the G16 model and given by Eq.(6),lnCZr(melt)=(3.313±0.349)–(1.35±0.10)·lnG+(0.0065±0.0003)·T(T in°C).In Fig.3b,the black line represents a new model,which is given by Eq.(7),lnCZr(melt)=(2.837 ± 0.469)– (1.188 ± 0.105)·lnG +(0.0066 ± 0.0003)·T (T in °C).The higher coefficients of determination achieved by this new model suggest it can better describe these data than the models of G16 and S19

The R2value of this model is 0.90 (Fig.3b),which is much better than the value of 0.82 obtained by the above S19 model.Including the Shao et al.(2019) data,this new model can be applied to more alkaline compositions than the G16 model.
2.3 Comparison between compositional parameters
In addition to temperature,composition is the other dominant factor controlling the zircon saturation in silicate melts.With respect to composition,several parameters have been proposed,including M,FM,ASI,NBO/T,and G.Among them,the parameter NBO/T,which denotes the amount of nonbridging oxygen per tetrahedrally coordinated cations (Mysen 1983),was devised to express the degree of polymerization of melts.Furthermore,the melt composition is considered to include but not be primarily driven by the silica content (e.g.,Baker et al.2002;Boehnke et al.2013;Watson and Harrison 1983).Here,by fitting up to 88 data points (Table S1),we developed six new models (with 1σ errors):

with R2=0.91 (Fig.4a);

with R2=0.88 (Fig.4b);

with R2=0.90 (Fig.4c);

with R2=0.88 (Fig.4d);
with R2=0.91 (Fig.4e); and


Fig.6 Parameters M (a),FM (b),ASI (c),NBO/T (d),and G (e) under variations in SiO2 content.Parameter G displays a good linear relationship(R2=0.85)with the SiO2 content,whereas the other parameters present poor linear or nonlinear relationships with the silica content,suggesting that silica content can be correlated only with parameter G,although it can roughly evaluate zircon saturation in silicate melts.The data are from the literature (Boehnke et al.2013; Ellison and Hess 1986; Gervasoni et al.2016; Rubatto and Hermann 2007; Shao et al.2019;Watson and Harrison 1983)
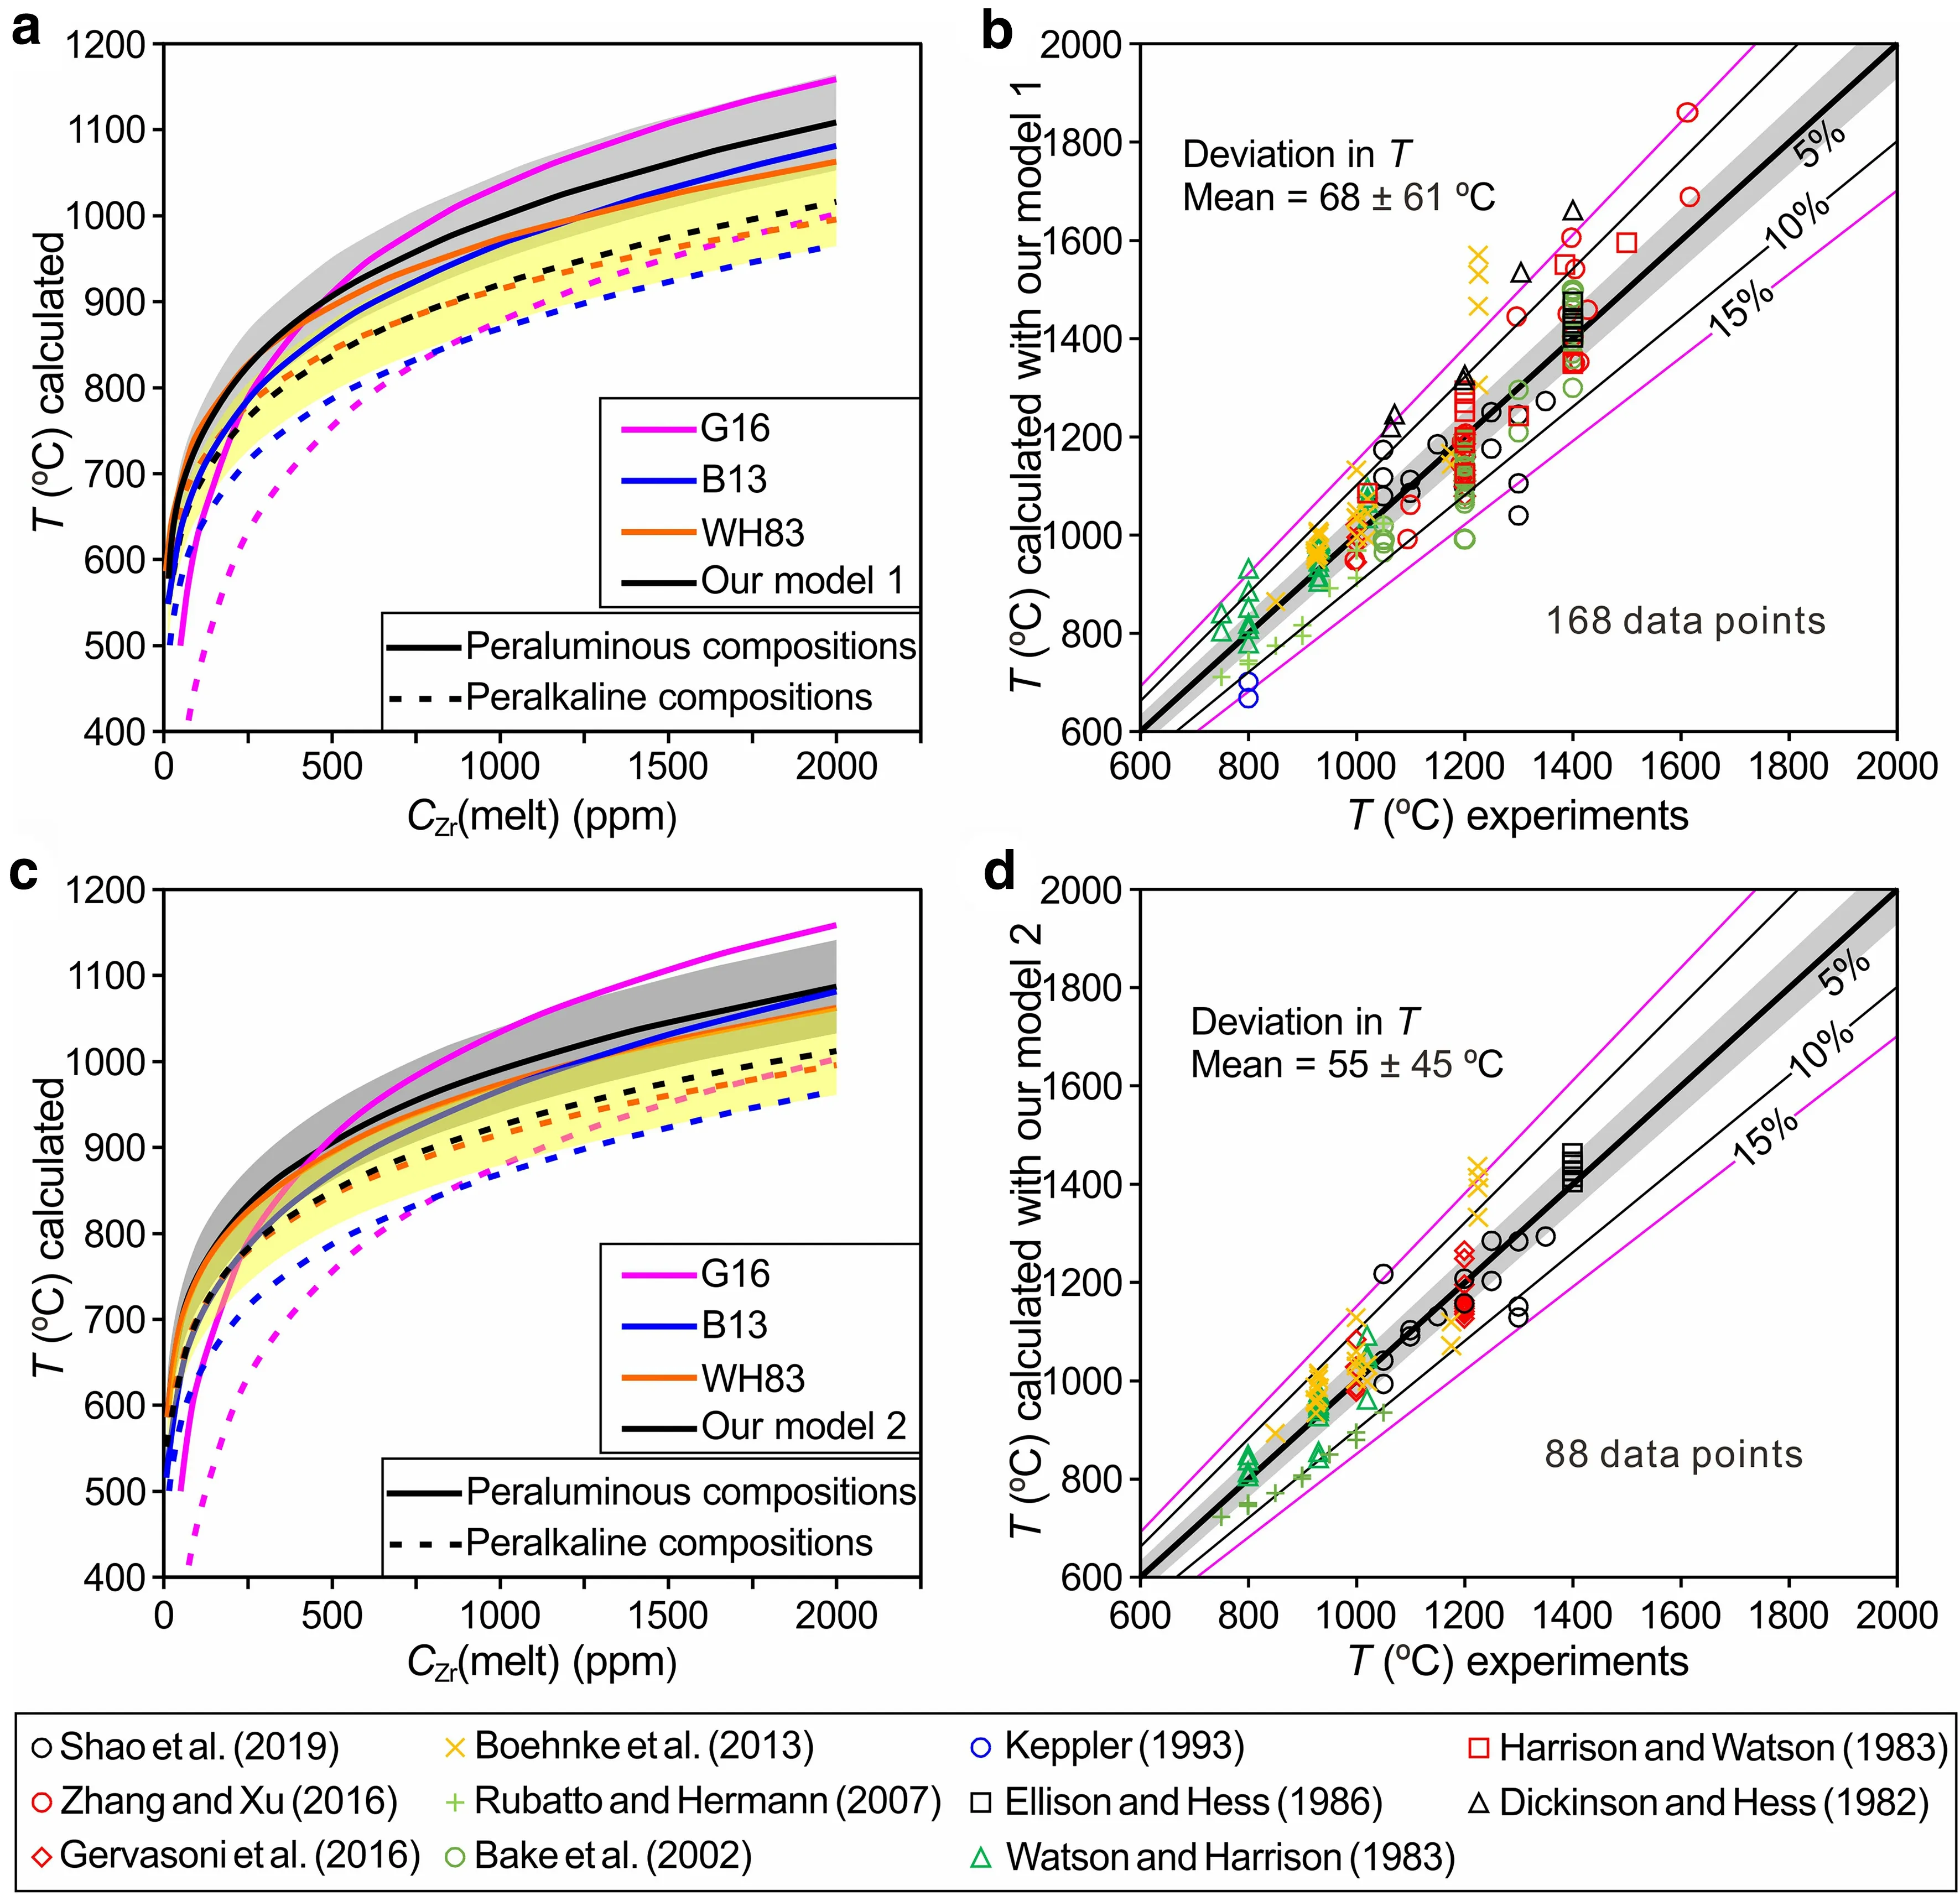
Fig.7 Comparison of our new zircon saturation models with other models (i.e.,WH83,B13 and G16).In Figs.7a and 7b,our new model is given by Eq.(5),lnCZr(melt)=(14.297±0.308)+(0.964±0.066)·M–(11113±374)/T(T in K);in Figs.7c and 7d,the model is given by Eq.(12),lnCZr(melt)=(18.99±0.423)–(1.069±0.102)·lnG–(12288±593)/T(T in K).In Figs.7a and 7c,the solid lines are the variations of temperature and zircon saturation in peraluminous compositions(constant M=1.4 and G=10.5),and the dashed lines are the same variations for peralkaline compositions (constant M=2 and G=5.5).In Figs.7b and 7d,the experimental temperatures from the literature (Baker et al.2002;Boehnke et al.2013;Dickinson and Hess 1982;Ellison and Hess 1986;Gervasoni et al.2016;Harrison and Watson 1983;Keppler 1993;Rubatto and Hermann 2007; Shao et al.2019; Watson and Harrison 1983; Zhang and Xu 2016) are compared with the temperatures calculated with our new models(1 and 2,respectively).The deviations between the experimental temperatures and the temperatures calculated with our two models are characterized by mean values of 68±61°C and 55±45°C.The shaded area in light gray and yellow represents the 5%uncertainty of the measured temperature,and the number on the line represents the boundary of uncertainty
with R2=0.87 (Fig.4f).Compared with the WH83 and G16 models and their updates,the higher determination coefficients achieved by Eqs.(8),(10),and (12) suggest that these models provide better descriptions of the zircon saturation data (Boehnke et al.2013; Ellison and Hess 1986; Gervasoni et al.2016; Rubatto and Hermann 2007;Shao et al.2019;Watson and Harrison 1983).Equation (8)has a higher determination coefficient than Eq.(5)because the former relies on 88 data points,while the latter is based on 168 data points.Although Eqs.(9),(11),and (13) present slightly lower determination coefficients(R2=0.87–0.88),they should also be appropriate for obtaining an approximate estimate because those models were calibrated for a wider range of compositions than the previous models (i.e.,WH83,B13,and G16).Notably,Eq.(12) has a higher determination coefficient than Eq.(7),implying that the former better represents the relationship of zircon saturation with G and temperature.To determine the zircon saturation as a function of several compositional parameters and SiO2,we plot the natural logarithm of Zr concentration in melts[lnCZr(melt)]versus M(Fig.5a),FM (Fig.5b),ASI(Fig.5c),NBO/T (Fig.5d),G (Fig.5e) and SiO2content (Fig.5f).The lnCZr(melt)shows a positive correlation with M,FM,and NBO/T.In contrast,the lnCZr(melt) presents a linear negative correlation with ASI.Similarly,it also has a total negative correlation with G and SiO2content,although the scatter is much greater at larger G values (>9.5) and in the compositional range of intermediate to silicic melts.As shown in Fig.5,the parameter G better distinguishes among melt compositions than the other parameters (e.g.,M and ASI).With increases in the alkaline content (decreases in the G value)or decreases in the SiO2content,zircon saturation increases.The above five parameters versus silica content are plotted in Fig.6 to check whether silica content can represent the melt composition,which was suggested by previous studies to be represented by parameters such as G and M(e.g.,Boehnke et al.2013;Gervasoni et al.2016;Watson and Harrison 1983).As stated by Gervasoni et al.(2016),G can describe the melt compositions of a large variety of zircon-saturated melts better than the other parameters.As shown in Fig.6e,parameter G displays a good linear relation with silica content (R2=0.85),which again demonstrates that silica content can approximate melt composition.In contrast,parameters M,FM,and NBO/T roughly increase with decreasing silica content,especially when silica content is lower than 72 wt%(Fig.6a,b,d).Thus,the poor linear or nonlinear fittings presented in the plots of these parameters (Fig.6) suggest that silica content is not correlated with any of these parameters except for G.
2.4 Comparison of new models with old models
Based on the above comparisons and previous studies(Boehnke et al.2013; Gervasoni et al.2016; Watson and Harrison 1983),M and G are considered the two best parameters for representing melt composition.As stated above,two new models,i.e.,model 1 given by Eq.(5)and model 2 given by Eq.(12),were developed by fitting 168 and 88 data points.Parameters M and G,as well as temperature,were employed for the fitting.Here,the two new recommended models are compared with the WH83,B13 and G16 models for peraluminous (constant M=1.4 and G=10.5) and peralkaline (constant M=2 and G=5.5)compositions.In Fig.7a,the comparison shows that the temperatures calculated by model 1 [Eq.(5)] lie between those calculated by the three old models(WH83,B16,and G16) for peraluminous compositions when the zircon saturation in the melt is greater than 500 ppm.Additionally,the temperatures calculated by the three old models are within the 5% uncertainty range of model 1.For peralkaline compositions,similar temperatures are predicted by all models,although the temperatures calculated by model 1 are slightly higher than or close to those calculated by the WH83 model.Above 800 °C,the temperatures calculated by the other three models (WH83,B13,and G16) also lie within the 5% uncertainty range of model 1.Notably,overlap occurs between the 5%uncertainty range of model 1 for peraluminous compositions and peralkaline compositions.This pattern differs from that of the G16 model,which features a large gap between the 5% uncertainty range for peraluminous compositions and peralkaline compositions.Except for the temperatures (below 800 °C)calculated by the G16 model for peralkaline compositions,all the models are consistent and within the 5%uncertainty range of model 1 (Fig.7a).As indicated in Fig.5a of Gervasoni et al.(2016),for more alkaline compositions(M >2 and G <6),the three old models(WH83,B13,and G16) differ at temperatures lower than 850 °C and are consistent at higher temperatures.Considering that model 1 was also calibrated for alkaline compositions,deviations in the calculated temperatures between model 1 and the G16 model may thus result from the reliance of the older model on fewer data points[their experimental data and a portion of the data from Boehnke et al.(2013)].Similarly,model 2,which links zircon saturation in the melt with temperature and parameter G,yields approximately the same temperatures as the other three models,although the temperatures calculated by the B13 and G16 models are outside the 5%uncertainty range of model 2 at temperatures less than 850 °C for peralkaline compositions (Fig.7c).
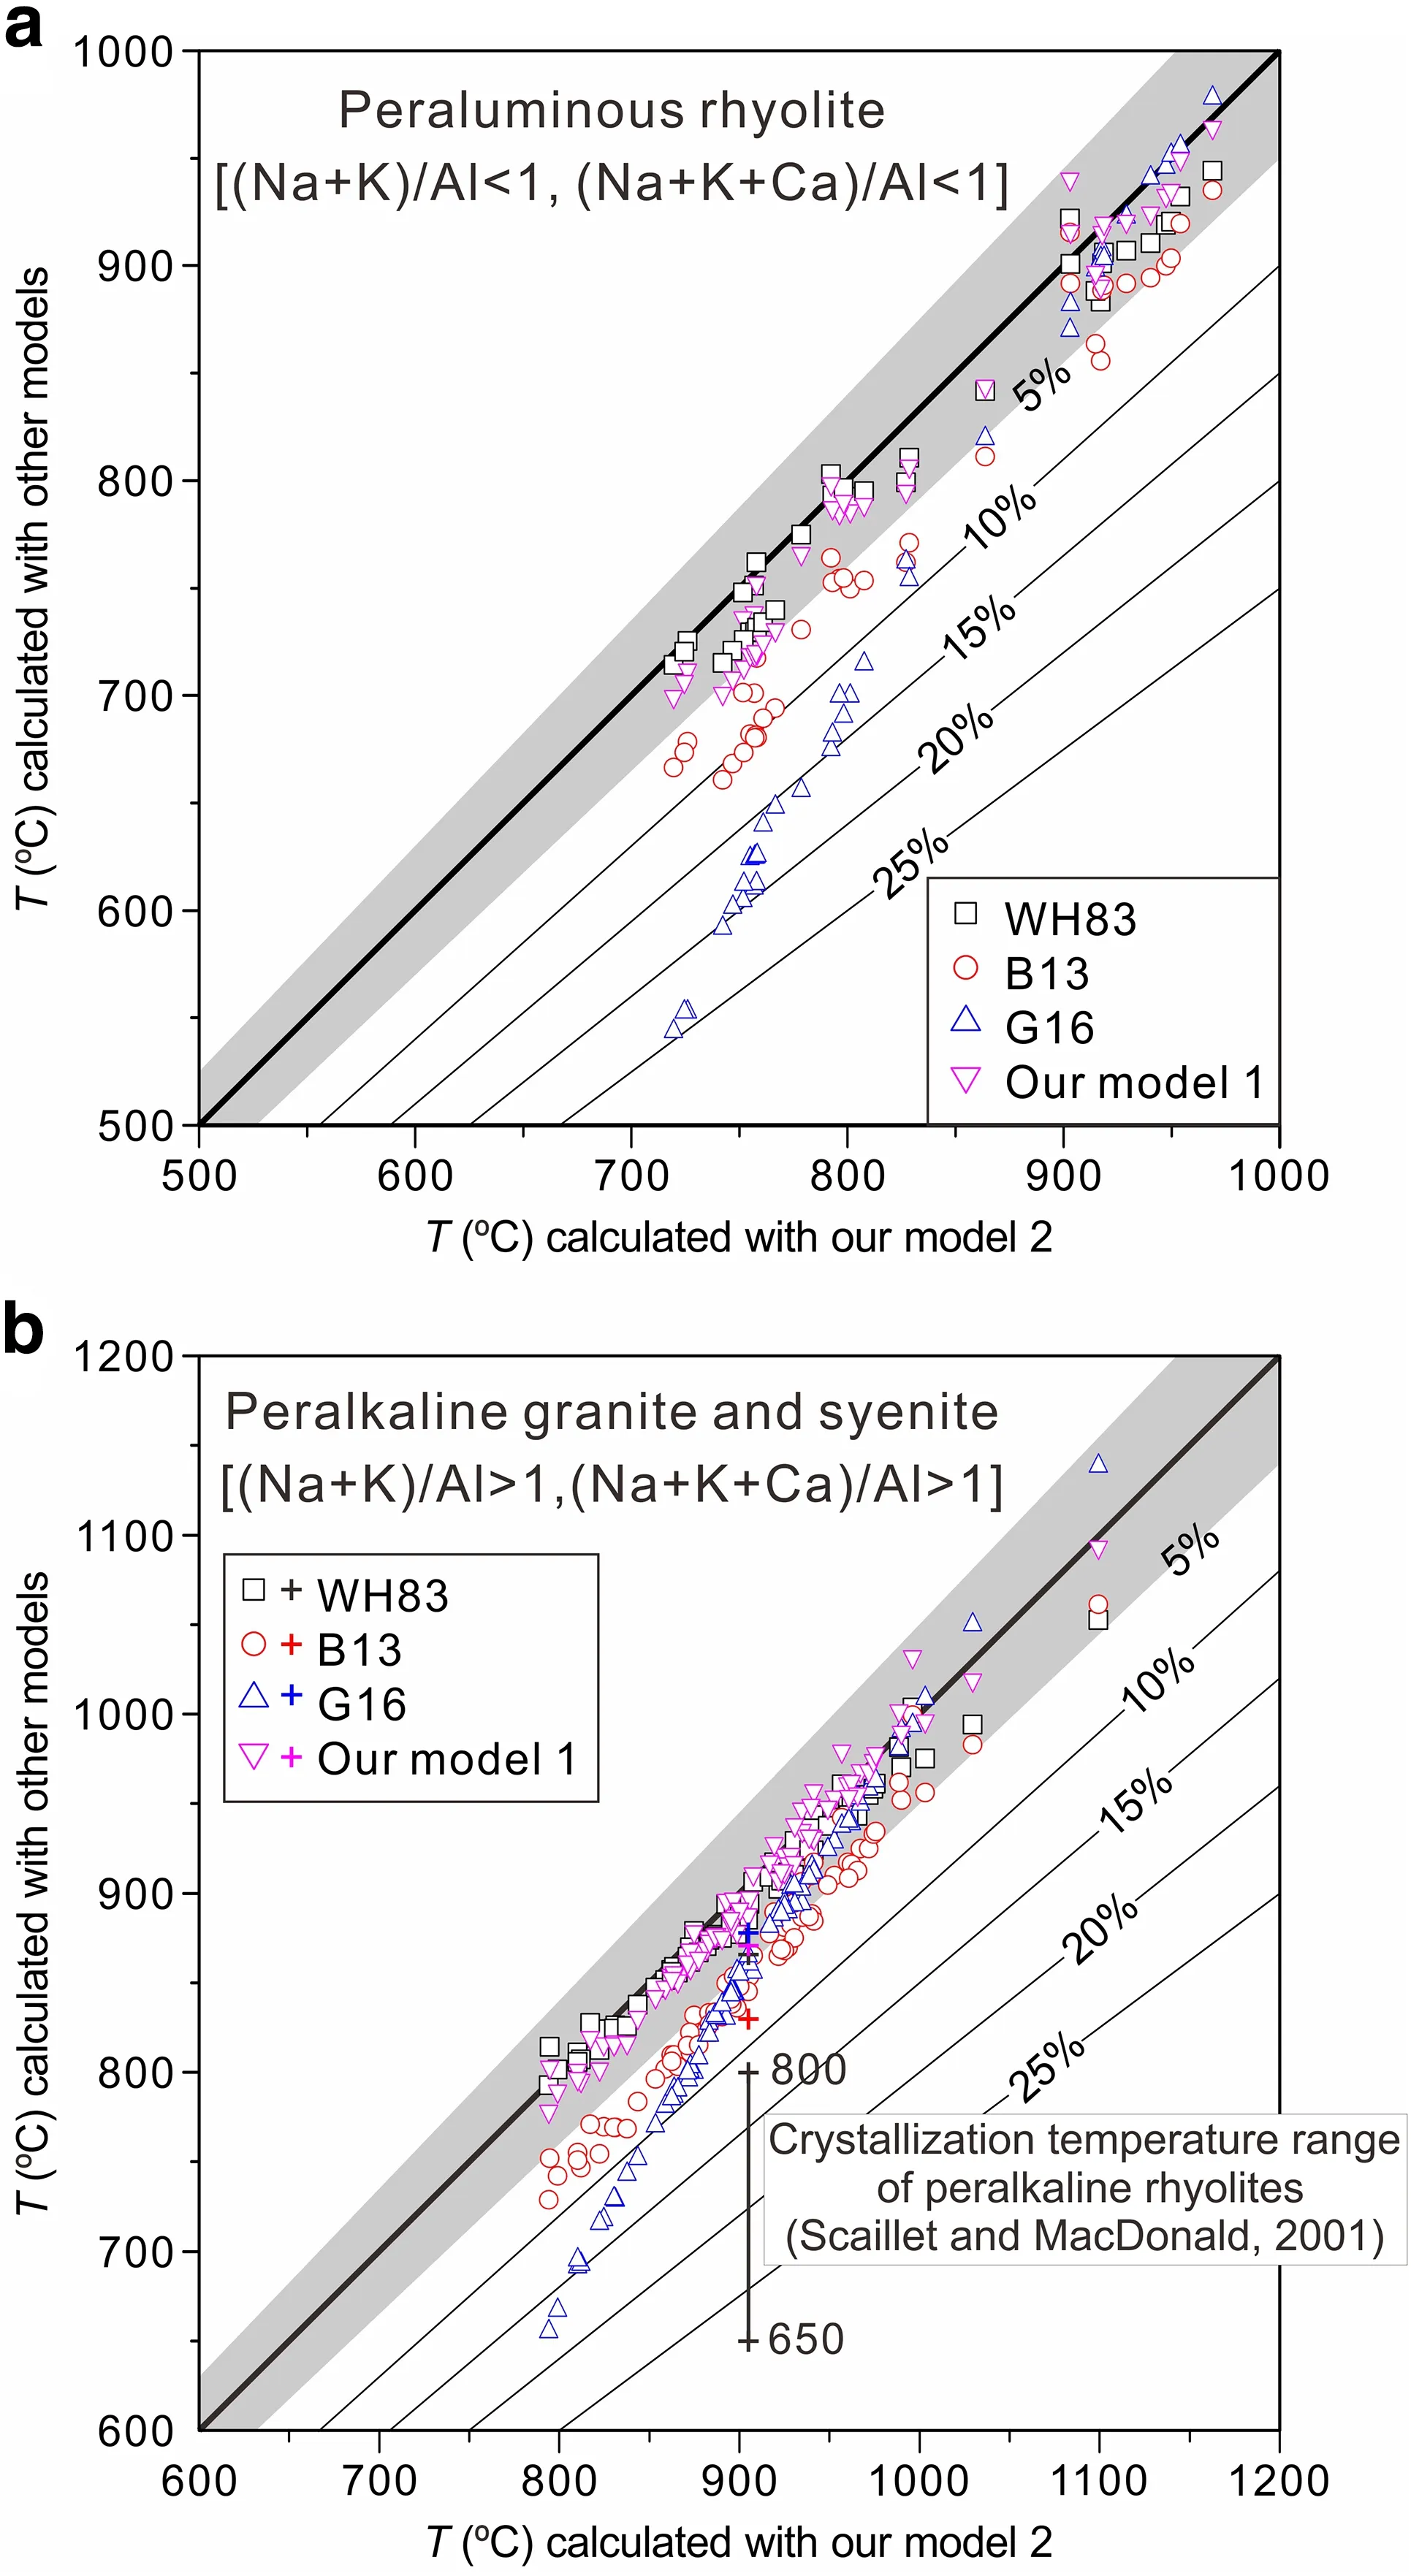
Fig.8 Application of our two new models [Eqs.(5) and (12)] and previous models [B13:Boehnke et al.(2013); G16:Gervasoni et al.(2016); WH83:Watson and Harrison (1983)] in peraluminous rhyolites from literature (Cao et al.2018; Schmitt and Simon 2004;Wang et al.2012,2017,2018; Zhang et al.2018) and peralkaline granites and syenites from Schmitt et al.(2000),Shellnutt and Zhou(2007) and Shellnutt et al.(2009a).The shaded area in light gray represents the 5%uncertainty of model 2,and the number on the line represents the boundary of uncertainty.The plus sign represents the temperatures calculated for the composition of peralkaline rhyolite sample ND002 (Scaillet and MacDonald 2001).The data used to make this figure are shown in Table S2 of the Supporting Material
As shown in Fig.7b,d,we compared measured temperatures from all available experiments(Baker et al.2002;Boehnke et al.2013;Dickinson and Hess 1982;Ellison and Hess 1986; Gervasoni et al.2016; Harrison and Watson 1983; Keppler 1993; Rubatto and Hermann 2007; Shao et al.2019; Watson and Harrison 1983; Zhang and Xu 2016) with those calculated using the proposed models (1 and 2).The results are consistently within the uncertainty range,especially for model 2,where the average difference in temperature between the measured and calculated values is 55 ± 45 °C.Both of the proposed models are consistent with the data from the literature (Baker et al.2002;Boehnke et al.2013;Dickinson and Hess 1982;Ellison and Hess 1986; Gervasoni et al.2016; Harrison and Watson 1983; Keppler 1993; Rubatto and Hermann 2007; Shao et al.2019; Watson and Harrison 1983; Zhang and Xu 2016).Furthermore,for alkaline-rich compositions at higher temperatures,the modeled temperatures are subject to uncertainties (Fig.7b,d).However,a similar situation was observed for aluminous-rich compositions at lower temperatures by Gervasoni et al.(2016)in their Fig.5b.As shown in Fig.7b,d,a greater number of data points in Shao et al.(2019) are within the 5% uncertainty range of model 2 than that of model 1,indicating again that model 2 can better describe the Shao et al.(2019) data.This observation and the more distinguishable melt compositions obtained by parameter G than the other parameters(Fig.5) suggest that model 2 may be the best model and yields appropriate results for mafic to silicic melts with peraluminous to alkaline compositions.
3 Discussion
In this study,the proposed models [Eqs.(5) and (12)] are compared with previous models (i.e.,WH83,B13 and G16),and their validity is confirmed by showing several examples on peraluminous to peralkaline rocks (Cao et al.2018; Schmitt et al.2000; Schmitt and Simon 2004;Shellnutt and Zhou 2007; Shellnutt et al.2009a; Wang et al.2012,2017,2018; Zhang et al.2018) to show their application to natural rocks (Fig.8).Prior to this,we also discuss the caution for the application of zircon saturation models in geology.
3.1 Caution for the application of zircon saturation model in geology
All zircon saturation models were proposed based on laboratory measured zircon saturation in silicate melts.To enable zircon to crystallize in a mafic and/or peralkaline melt,previous studies added much higher ZrO2content than in a natural equivalent to the starting material (e.g.,Dickinson and Hess 1982; Shao et al.2019).This resulted in two obvious differences between in nature and in the laboratory:one is in crystallization time of zircon and the other is in the presence or absence of baddeleyite(ZrO2).In natural mafic melts,zircon crystallizes late by means of crystallization-differentiation (e.g.,Scoates and Chamberlain 1995).In laboratory equivalents,however,the zircon crystallized in the early stage at which the silica activities were relatively low due to much higher ZrO2content added(e.g.,Shao et al.2019).Thus,in contrast to in nature,there is no baddeleyite produced in laboratory where zircon crystallized in mafic melts (Shao et al.2019).Therefore,it requires special care when applying these models to natural rock,as it has long been recognized that zircons in igneous rocks are not always autocrystic (Charlier et al.2005).Instead,they can also be inherited either from the surrounding country rock or source region (xenocrysts)(Miller et al.2007;Qiu et al.2005),or from earlier phases of magmatism or the magmatic plumbing system (antecrysts)(Charlier et al.2005;Miller et al.2007).This means that the bulk composition does not necessarily correspond to the melt composition;if it contains inherited zircon,then the use of the bulk composition to represent the melt composition of intermediate-silicic igneous rock will inevitably result in a high crystallization temperature estimate based on zircon saturation model.For example,the temperatures calculated with the five models for the three peralkaline granites (AM209,AM216 and AM219) from the study of Schmitt et al.(2000) are not lower than 1128 °C,which is due to the high concentrations of Zr(4110,16,800 and 12,200 ppm,respectively) in the bulk compositions of these granites.Clearly,the bulk compositions,in this case,are not identical to the melt compositions for these granites (Schmitt et al.2000).
In nature,the mafic rocks are believed to be Zr-undersaturated and should not have crystallized zircons unless in small isolated (i.e.,interstitial) pockets (e.g.,Ramírez de Arellano et al.2011).However,zircon still appears in natural mafic rocks.For example,there are obviously zircon megacrysts present in the Cenozoic basalts in Mingxi,Fujian Province (southeastern China) (e.g.,Qiu et al.2005).Mineral inclusion and Hf isotope characteristics indicate they are mantle-derived xenocrysts.Using the zirconium content of the bulk composition of mafic rock will therefore inevitably lead to an incorrect crystallization temperature.Most recently,Siégel et al.(2018) compared magmatic temperatures and zircon saturation temperatures for 11,705 igneous rocks in Queensland.They found that with increasing SiO2content,the magmatic temperatures decrease while the zircon saturation temperatures increase,implying that the latter changes during magma crystallization and essentially increases as fractional crystallization proceeds(Zr concentration increases).This results in a cross-over point of these two temperatures being magmatic system dependent and affected by which model is used for calculating temperatures (Siégel et al.2018).According to this comparison and using the WH83 model,they came to an important conclusion that new zircon generally only crystallizes in silicic(granitic/rhyolitic)melts and there are no autocrystic zircons present in igneous rocks with bulk compositions <64 wt% SiO2,although it may contain inherited and minor zircons.It is,therefore,a risky avenue in regards to understanding the meaning of ages of mafic rocks by means of U–Pb dating of zircons (e.g.,Siégel et al.2018).However,baddeleyite is a common accessory mineral that forms in silica-undersaturated mafic,ultramafic and alkaline rocks(e.g.,Bayanova 2006;Scoates and Chamberlain 1995),and it is considered to be an ideal geochronometer for U–Pb and Pb–Pb dating of mafic and ultramafic rock where zircons are extremely rare,because of some favorable physical and chemical properties (Heaman and LeCheminant 1993).In a word,it is an important prerequisite to discriminate autocrystic from inherited zircons in igneous rocks when dating these rocks using zircon.In regard to how to distinguish these different types of zircon,one can refer to a review most recently by Siégel et al.(2018).
3.2 Peraluminous rocks
To assess the applicability and functionality of the above five models,we selected 39 peraluminous rhyolites (Cao et al.2018; Schmitt and Simon 2004; Wang et al.2012,2017,2018; Zhang et al.2018),which have very high SiO2contents from 69.24 to 79.70 wt% and (Na +K)/Al molar ratios from 0.6 to 0.97,to calculate and compare their temperatures with the five models (Fig.8a).From Fig.8a,we observe that temperatures calculated with the WH83 model and our two models are very consistently within~5% uncertainty.In contrast,the uncertainties between the temperatures calculated with the B13 model and those calculated with the three models(i.e.,the WH83 model and our two models) are generally a few percent to 10%.Only those calculated with the G16 model deviate outside of the~10%uncertainty of model 2,especially at temperatures below 800 °C.As a result,the G16 model is unfit for peraluminous rocks because it was specifically designed for more alkaline compositions and was not calibrated at temperatures below 800 °C.
In these rhyolites,ten peraluminous rhyolite glasses(glassy melt inclusions)from the Bishop Tuff were utilized to calculate temperature with older models (e.g.,Schmitt and Simon 2004) and to test these models (Boehnke et al.2013; Gervasoni et al.2016).Here,we recalculated temperatures for the ten rhyolites with the above five models as shown in Table S2.The results are not described in detail as they are basically consistent with those obtained from the 39 samples.Seven rhyolites from the volcanic rocks of Dashizhai Formation in Hanwula of Xi U Jimqin Banner,Inner Mongolia,China,characterized by a SiO2content of 72.30–77.90 wt% and a (Na+K)/Al molar ratio of 0.75–0.89,were also included in the 39 rhyolites to test the five zircon saturation models.Specifically,we applied our two new models to these seven rhyolites,resulting in average temperatures of 894 ± 53 °C(796 <T <940 °C)for model 1 and 898 ± 40 °C (827 <T <940 °C) for model 2.Similar temperature ranges are produced by the WH83 model (799–922 °C,with an average of 883 ± 45 °C),the B13 model (762–915 °C,with an average of 865 ± 56 °C),and the G16 model(762–940 °C,with an average of 872 ± 63 °C).Obviously,these five models agree well with each other when considering the uncertainty.This is because~800–940 °C is within the calibrated temperature range for all these models.Such high calculated temperatures were in agreement with the temperature conditions required to form A-type granites,whose petrological and geochemical features were similar to those revealed by the analysis of these rhyolites (Zhang et al.2018):①enrichment of Si and alkaline,depletion of Ti,Mg,Fe,and Ca,and the abundance in trace elements and REEs,exhibiting a right-inclined seagull-type distribution pattern; ②richer LILE (such as Rb,Th,U,K and LREE) than HFSE (such as Nb,Ta and HREE); ③significantly negative anomalies of Ba,Sr,P,Eu and Ti on the primitive mantle-normalized trace element diagram; and ④an average 10,000 Ga/Al value of 3.6.
To reveal the origin of the crustal melting beneath the northern Tibetan Plateau,Wang et al.(2012) used the zircon saturation thermometry and Ti-in-zircon thermometer in eight strongly peraluminous rhyolites,which are tourmaline-bearing mica and biotite rhyolites in the Bukadaban-Malanshan (BM) area (southern Kunlun Range,near the northern margin of the Tibetan Plateau)with high SiO2contents (69.24–75.50 wt%),(Na+K)/Al mole ratios of 0.68–0.75 and clear negative Eu,Ba,and Sr anomalies.These characteristics are geochemically similar to the Himalayan leucogranites that were interpreted as crustal melts.With the WH83 model,we find average temperatures of 771 ± 29,795 ± 2 and 720 ± 6 °C for the rhyolites from the three areas.Except for the G16 model,which gives a generally lower temperature because it was calibrated only for temperatures above 800 °C,the other models agree well with each other within the uncertainties.Considering there are no Ti-bearing phases such as rutile in the studied rhyolites,Wang et al.(2012)calculated temperatures for aTiO2=0.5 using the revised calibration of the Ti-in-zircon thermometer (Ferry and Watson 2007).The results showed that TZr-Ti(t=1.5 Ma)=770 ± 52 °C,TZr-Ti(t=9.0 Ma)=863 ±26 °C and TZr-Ti(t=3.0 Ma)=763 ± 45 °C for the Bukadaban,southern Malanshan and Hudongliang rhyolites,respectively.In contrast to the temperatures of the Higher Himalayan leucogranites,a few of which are up to 800 °C but with most below 700 °C (Kellett et al.2009),those of these rhyolites are much higher,probably representing the maximum-crystallization temperatures of zircons from leucogranites.If considering the uncertainties,the calculated Ti-in-zircon temperatures are equal to or slightly higher than the calculated zircon saturation temperatures with the models except G16.However,the zircon saturation temperatures based on whole-rock Zr contents may be higher than the melting temperature of their host rock,as the Zr contents of the BM rhyolites may have been elevated by the inheritance of abundant old zircons,which may be the reason why Wang et al.(2012)suggested using the temperature calculated with both thermometers to represent the maximum-melting temperatures of their respective BM rhyolite magmas.Therefore,temperatures calculated with the Ti-in-zircon and zircon saturation thermometers can provide a rough constraint for the maximum-melting temperature ranges of these rhyolites,although the zircon saturation temperature was proved to be a theoretical temperature and cannot be used to constrain magmatic or partial melting temperatures (Siégel et al.2018).
3.3 Peralkaline rocks
Checking the applicability and functionality of models by performing crystallization experiments on natural rock powders and by comparing the crystallization temperature with the zircon saturation temperature calculated with the models are powerful techniques.However,there are few such studies (Scaillet and MacDonald 2001).Using rock powders,Scaillet and MacDonald (2001) carried out crystallization experiments on three peralkaline rhyolite samples (ND002,BL575,and SMN49) and found that normal magmatic oxides,feldspars,and quartz crystallized at temperatures from 650–800 °C.To better compare our new models with the older models,following Gervasoni et al.(2016),we applied our new models [1 given by Eqs.(5) and 2 by Eq.(12)] and the old models (WH83,B13,and G16) to these samples.The temperatures calculated for the ND002 composition [CZr(melt)=439 ppm]are 871 °C (model 1) and 905 °C (model 2),which are roughly consistent with those of the B13,G16,and WH83 models (830,878,and 867 °C,respectively).Assuming analytical or model uncertainties of 10% or higher,these calculated temperatures are also consistent with the crystallization temperature range (650–800 °C) (e.g.,Fig.8b).Furthermore,we calculate zircon saturation with the five models for the ND002 composition at 693 °C and for the BL575 and SMN49 compositions at 700 °C.Zircon saturation values of 73,44,156,120,and 57 ppm were obtained with model 1,model 2,the G16 model,the B13 model and the WH83 model for the melt of the ND002 composition,respectively.Considering a Zr concentration of 439 ppm in the bulk rock,all these models can reasonably explain the presence of primary zircon in sample ND002,which is the only rock containing zircon among these three samples.Also,with the five models,the zircon saturation values of the melt corresponding to the BL575 composition at 700 °C were calculated to be 114 ppm(model 1),65 ppm (model 2),233 ppm (the G16 model),200 ppm(the B13 model)and 86 ppm(the WH83 model).The SMN49 melt composition would need 112,64,231,195,and 85 ppm of Zr to achieve zircon saturation at 700 °C for these different models.The zircon saturations are higher for the BL575 and SMN49 compositions than for the ND002 composition because the first two compositions are more alkaline[(Na+K)/Al >1.3]than the last one [(Na+K)/Al=1.05].These calculated saturation values are much lower than the Zr concentrations (2198 and 2666 ppm) present in samples BL575 and SMN49.However,the presence of~1 wt% F in these rocks can increase the solubility of ZrSiO4by 1 to 2 orders of magnitude (e.g.,Keppler 1993),resulting in a lack of crystallized zircon in these two samples (Scaillet and MacDonald 2001).
To test their model in both volcanic and plutonic rocks,Gervasoni et al.(2016) chose two monzogranites and nine peralkaline granites from the study of Schmitt et al.(2000).Here,we selected seventy-five peralkaline granites and syenites (Schmitt et al.2000,2009a; Shellnutt and Zhou 2007),of which six peralkaline granites from the study of Schmitt et al.(2000) were included but are not stated in detail (Table S2).Applying the five models to all these peralkaline samples and compared with the temperatures calculated with these models,in general,our models yield temperatures between those of the previous models(WH83,B13,and G16) and agree well with each other.Figure 8b shows that most data points consistently fall within the 5%uncertainty range of model 2 and~60%of data points by the B13 model are within the 5–10%uncertainty range.In contrast,eleven data points by the G16 model are outside the 10%uncertainty range,possibly because the temperatures of these data points(655–751 °C)are much lower than the calibrated range(800–1200 °C)of the G16 model.From Fig.8b,we can also find that,at higher temperatures(e.g.,>1000 °C),the WH83 and B13 models display lower values,while the G16 model shows higher values relative to our two models.
In the seventy-five peralkaline samples,sixty-nine granites and syenites (Shellnutt and Zhou 2007; Shellnutt et al.2009a) are from three peralkaline granitic plutons(i.e.,Panzhihua,Baima and Tianhe plutons) of the Late Permian Emeishan large igneous province (SW China).These plutons display M values of 1.77 ± 0.12,1.86 ± 0.06 and 1.73 ± 0.08,all of which are within the experimental range specified by the WH83 model.In addition,magmatic zircons occur within all these plutons with a wide range of Zr concentrations (Panzhihua=285–1400 ppm,Baima=286–1256 ppm,and Tianhe=421–1400 ppm).Furthermore,there are few inherited zircons within these plutons according to U–Pb dating of zircons and Hf isotopic analyses (Shellnutt et al.2009b; Xu et al.2008).All these characteristics suggest that the calculated zircon saturation temperatures may be reasonable(Hanchar and Watson 2003;Siégel et al.2018).With the five models,we calculated zircon saturation temperatures for all three plutons (Table S2; Fig.8b).For thirty Baima syenites,an average temperature of 869 ± 47 °C (801 <T <955 °C) was produced with the WH83 model,of 822 ± 55 °C (742 <T <925 °C) with the B13 model,of 806 ± 81 °C (666 <T <957 °C) with the G16 model,of 869 ± 54 °C (790 <T <969 °C) with model 1,and of 877 ± 50 °C (799 <T <972 °C) with model 2.For seventeen Panzhihua granites,an average temperature of 929 ± 46 °C (793 <T <1003 °C) was generated with the WH83 model,of 896 ± 59 °C(729 <T <999 °C) with the B13 model,of 898 ± 80 °C(655 <T <993 °C) with the G16 model,of 940 ± 55 °C(779 <T <1033 °C) with model 1,and of 935 ± 48 °C(794 <T <996 °C) with model 2.For twenty-two Tianhe granites,an average temperature of 900 ± 34 °C(837 <T <994 °C)was calculated with the WH83 model,of 863 ± 43 °C (783 <T <983 °C) with the B13 model,of 874 ± 62 °C(751 <T <1049 °C)with the G16 model,of 906 ± 41 °C (831 <T <1020 °C) with model 1,and of 914 ± 39 °C (844 <T <1030 °C) with model 2.Of these temperatures,those calculated with the G16 model should be discarded because of abnormally low temperatures and very large uncertainties; however,it is worth noting that this model was specifically designed for alkaline rocks,and it was not calibrated below 800 °C.In contrast,temperatures from the B13 model display larger deviations from those from the WH83 model and our two models.Considering that the temperatures calculated with model 2 are between those by model 1 and the WH83 model,we choose the temperatures based on model 2 as the values for the three plutons.Thus,the Panzhihua granites generated the highest range of temperatures between 794 and 996 °C with the highest mean of 935 ± 48 °C.The Tianhe granites generated an intermediate range of 844–1030 with an intermediate mean of 914 ± 39 °C.The Baima syenites generated the smallest range of temperatures from 799 to 972 °C with the lowest mean of 877 ± 50 °C.The temperatures calculated for the three plutons are consistent with the temperature conditions required for the formation of some A-type granitic rocks(870–950 °C) and with the results of MELTS modeling(e.g.,Shellnutt and Jahn 2009;Shellnutt et al.2009a;White et al.2005).Previous studies suggested that the peralkaline A-type granites are derived from basaltic magma (e.g.,Clemens et al.1986; Price et al.1999).Our calculated temperatures are also close to the value (~950 °C) estimated for the end of oxide-silicate equilibration in the Panzhihua layered mafic intrusion (Pang et al.2008a,b),which may represent the time at which the silicic magmas began to consolidate after fractionation of the mafic minerals in the Panzhihua intrusion.Therefore,the magmatic temperatures calculated with our models are reasonable.
Although these models except for the G16 model generally yield similar temperatures for the same sample within the uncertainties of the models,model 2 should be more appropriate for application to natural rocks,especially rocks with alkaline compositions.As shown in Table S2,the bulk compositions of natural peralkaline rocks normally contain significant amounts of FeO and at least small amounts of MgO(Schmitt et al.2000;Shellnutt and Zhou 2007; Shellnutt et al.2009a),and both can change the melt structure considerably (Gervasoni et al.2016).Compared with the G16 model,model 2,which also depends on temperature and the compositional parameter G,relies on all available zircon saturation data,which range from mafic to silicic melts with peraluminous to peralkaline compositions and present temperatures from 750 to 1400 °C.The above tests of the five models in peraluminous to peralkaline rocks suggest that the G16 model is unfit for peraluminous rocks and cannot be applied at temperatures below 800 °C.The B13 model gives a smaller uncertainty but still shows a larger uncertainty than the other three models (i.e.,the WH83 model and our two models),which agree well with each other.Considering that model 2 is generally between the WH83 model and model 1 for peralkaline compositions,and in addition to temperature,it relies on parameter G,which includes the effect of Mg and Fe,we recommend using model 2 for magmatic temperature estimates of alkaline to peralkaline rock.In contrast,model 1 is derived by fitting much more data than the WH83 model,and it is between model 2 and the WH83 model for peraluminous rocks.Therefore,it is recommended the use of model 1 to estimate the magmatic temperatures of metaluminous to peraluminous rocks.As stressed by Siégel et al.(2018)on the importance of discriminating autocrystic from inherited zircons in igneous rocks,however,prior to applying these models to natural rock,it is necessary to ensure that the zircon used to determine the age of a host magmatic rock crystallized from the rock.
4 Conclusions
This study has reviewed the historical development of models of zircon saturation in silicate melts.The consensus of many experiments resulting in the proposal and development of zircon saturation models is that zircon saturation critically depends on temperature and melt composition,regardless of whether the melt is silicic or mafic.All available data on zircon saturation in silicate melts(ranging from mafic to silicic compositions) were collected to review and update the zircon saturation models in silicate melts with the widest range of compositions from peraluminous to peralkaline based on several important parameters that have been proposed previously (e.g.,M and G).Six new models have been produced based on the parameters M,FM,ASI,NBO/T,and G as well as the silica content,and all six models have high coefficients of determination,suggesting that they can all be applied to mafic to silicic melts with peraluminous to peralkaline compositions.Based on their relatively higher determination coefficients and the consensus that M and G are the two best compositional parameters,only two models [1 given by Eqs.(5) and 2 given by Eq.(12)] are recommended.Comparisons of the compositional parameters M and G with the silica content suggest that silica content approximately represents the melt composition when evaluating zircon saturation in silicate melts,as it not only exhibits a good linear correlation (R2=0.85) with G,which is considered the best parameter for representing the melt composition,but also is directly obtained from electron microprobe measurements.Prior to applying these models to natural rock,it is extremely important to ensure that the zircon used to determine the age of a host magmatic rock crystallized from the rock.The application of our new models [Eqs.(5) and (12)] and the old models(WH83,B13,and G16) to natural peraluminous to peralkaline rocks suggests that model 2,which depends on temperature and the compositional parameter G that includes the effect of Mg and Fe,generally produces the best results for alkaline to peralkaline compositions.In contrast,model 1,which depends on temperature and the compositional parameter M,is recommended for estimating the magmatic temperatures of metaluminous to peraluminous rocks.
AcknowledgementsWe appreciate my editors’ critical and constructive comments,which turned out to be very helpful.Dr.Nanfei Cheng is gratefully acknowledged for critical comments on an early version of the manuscript.This work was financially supported by the Strategic Priority Research Program (B) of the Chinese Academy of Sciences (Grant No.XDB18010402),the National Natural Science Foundation of China (Grant No.41702224),and the Pearl River Talent Plan of Guangdong Province.This work represents a contribution to No.IS-2774 from the GIGCAS.
杂志排行

Acta Geochimica的其它文章
- In-situ nitrogen fate in the vadose zone of different soil types and its implications for groundwater quality in the Huaihe River Basin,China
- Organic geochemistry of the Lower Permian Tak Fa Formation in Phetchabun Province,Thailand:implications for itspaleoenvironment and hydrocarbon generation potential
- Mantle plume:the dynamic setting of the origin of Early Paleozoic mafic dykes in Ziyang,Shaanxi Province,Southern Qinling Block,China
- Using Sr isotopes to trace the geographic origins of Chinese mitten crabs
- Geochemical characteristics and origin of the Neoproterozoic high-K calc-alkaline granitoids in the northern part of Mandara hills,northeastern Nigeria
- A re-assessment of nickel-doping method in iron isotope analysis on rock samples using multi-collector inductively coupled plasma mass spectrometry