A re-assessment of nickel-doping method in iron isotope analysis on rock samples using multi-collector inductively coupled plasma mass spectrometry
2020-06-22HongmeiGongPengyuanGuoShuoChenMengDuanPuSunXiaohongWangYaolingNiu
Hongmei Gong·Pengyuan Guo,5·Shuo Chen·Meng Duan·Pu Sun·Xiaohong Wang·Yaoling Niu,3,4
Abstract Element doping has been proved to be a useful method to correct for the mass bias fractionation when analyzing iron isotope compositions.We present a systematic re-assessment on how the doped nickel may affect the iron isotope analysis in this study by carrying out several experiments.We find three important factors that can affect the analytical results,including the Ni:Fe ratio in the analyte solutions,the match of the Ni:Fe ratio between the unknown sample and standard solutions,and the match of the Fe concentration between the sample and standard solutions.Thus,caution is required when adding Ni to the analyte Fe solutions before analysis.Using our method,the δ56Fe and δ57Fe values of the USGS standards W-2a,BHVO-2,BCR-2,AGV-2 and GSP-2 are consistent with the recommended literature values,and the long-term(one year)external reproducibility is better than 0.03 and 0.05‰(2SD) for δ56Fe and δ57Fe,respectively.Therefore,the analytical method established in our laboratory is a method of choice for high quantity Fe isotope data in geological materials.
Keywords Fe isotope·Ni-doping·Stable isotope·Precision and accuracy·Mass bias correction·Pseudohigh mass resolution
1 Introduction
With the development of the multi-collector inductively coupled plasma mass spectrometry (MC ICP-MS) and improved analytical procedures,Fe isotope data of high precision and accuracy on rock samples can be acquired(Dauphas et al.2017).These data allow studying possible Fe isotopic fractionation during high-temperature geological processes on Earth and other planets(e.g.,Williams and Bizimis 2014; Sossi et al.2016),such as partial melting(e.g.,Weyer et al.2005; Weyer and Ionov 2007),mantle metasomatism (e.g.,Zhao et al.2010,2012,2015; Huang et al.2011; Poitrasson et al.2013) and magma evolution(e.g.,Teng et al.2008; Zambardi et al.2014).However,available iron isotope data still cannot yet be used effectively to trace petrogenic processes until possible mechanisms of iron isotope fractionation are fully understood.The latter still requires more high-quality Fe isotope data on various Earth materials,especially on rocks and minerals of known origin,to discover systematics towards genuine understanding mechanisms of Fe isotope fractionation in geological processes.
Nevertheless,there are analytical challenges in obtaining high-quality Fe isotope data such as polyatomic ion interferences and instrumental mass bias.The polyatomic ion interferences can be overcome using the high mass resolution on Nu Plasma 1700 or pseudo-high mass resolution on Nu Plasma II and Neptune Plus by effectively separating the interfering ions from Fe ions and measuring the left flat-top peak sections of Fe isotopes.This is because the Fe isotopes have a lower mass relative to the polyatomic interferences,so Fe isotopes enter the detector first in a scan and form the left plateau.The center plateau consists of polyatomic interferences and the Fe isotopes,while the right plateau reflects the polyatomic interferences only.The instrumental mass biases can be corrected by using one of the three common methods,i.e.,standardsample bracketing (SSB) (e.g.,He et al.2015; Liu et al.2014; Weyer and Schwieters 2003),double spike (e.g.,Finlayson et al.2015; Millet et al.2012),and element doping (e.g.,Arnold et al.2004; Chen et al.2017a; Dauphas et al.2009; Sossi et al.2015).The SSB method,the most often used method,assumes that mass bias during sample measurements is the same as bracketing standard measurements.But this method requires a well-controlled laboratory environment (e.g.,temperature,humidity,air exhausting rate),instrument stability as well as the highly matched matrix.The isotopic double spike method (e.g.,Malinovsky et al.2003; Millet et al.2012) is not sensitive to laboratory conditions as is the SSB method because the double-spike method can readily correct for instrument mass fractionation.This method is also proved to be able to produce the most precise Fe isotopic data to date (2SD=0.02 ‰; N=51; Millet et al.2012).However,the iterative computation of this method is very complex.In this case,internal elemental doping is the method of choice,assuming that the isotopes of the doped element have similar mass fractionation behavior to isotopes of the element of interest.
For iron isotope analysis,copper or nickel is usually used as the internal standard element for mass bias correction.Because the mass dispersion on the instrument is insufficient to simultaneously collect masses54Fe to65Cu,when Cu is used as an internal standard,the Cu and Fe isotopes cannot be analyzed in one cycle (i.e.,at one magnet scan).In this case,the dynamic mode of the twosequence analysis must be used,which requires extended analysis time and has the potential problem of the magnet inability to achieve stable signals.Thus,nickel is considered as a more suitable internal standard element for mass bias correction for Fe isotope analysis.
In this paper,we present new experimental results on Ni-doping method of iron isotope analysis using pseudohigh mass resolution on Nu Plasma II MC ICP-MS with wet plasma condition.We analyze the effects of Ni/Fe ratio,the match of Ni:Fe ratio between the sample and standard solutions,and the match of Fe concentrations between the sample and standard solutions.These former two variables are crucial to the accuracy of the iron isotope analysis,while the latter one is somewhat not that harsh,which is an obvious advantage compared with the SSB method.Therefore,caution is necessary when using the internal standard doping method.The analyzed Fe isotopic compositions of the USGS reference materials using this method are in good agreement with the recommended values within error.On the basis of repeated analysis over one year’s period,the precision and reproducibility of an in-house standard Alfa Fe solution are ± 0.03 ‰ (2SD)and ± 0.05 ‰ (2SD) for δ56Fe and δ57Fe,respectively.
2 Analytical methods
2.1 Sample digestion
The sample digestion method used in this study is modified from Chen et al.(2017b).Briefly,sample powders(5–10 mg)are weighted in a 10 mL PFA Teflon vial with a successive addition of 1 mL of 3:1 acid mixture of concentrated HNO3+HCl and 0.5 mL of concentrated HF.The Teflon vials are then sealed in a high-pressure bomb for 15 h at 190·C.The sample solutions are then evaporated to incipient dryness at 100 °C,refluxed with 2 mL of concentrated HNO3before being heated again to incipient dryness to remove all the residual HF.The samples are then re-dissolved in 3 N distilled HNO3for 2 h till complete digestion/dissolution.Finally,the samples are dried again and dissolved in 1 mL of 9 N HCl on a hotplate.
2.2 Chromatography procedure
The method of elemental separation and purification follows Cheng et al.(2014) with modification.Polyethylene columns with a length of 4.0 cm and an internal column diameter of 0.8 cm are filled with 1.0 mL of Bio-Rad®AG-MP-1 M resin (200–400 mesh).The resin filled columns are pre-cleaned by eluting 5 mL of Milli-Q water(18.2 MΩ),5 mL of 1 N HCl and 5 mL of 9 N HCl through the columns,successively (Table 1),where the 9 N HCl both cleans and equilibrates the resin by converting it into a chloride form.The HCl used in the whole procedures is double purified using a Savillex DST-1000 sub-boiling distillation system.Sample solutions in 1 mL of 9 N HCl are loaded into the columns,followed by 5 mL of 9 N HCl and 5 mL of 6 N HCl to fully elute matrix elements (e.g.,Na,Mg,Al,Ca,Ti,Cr,Ni,Mn,Co)(Fig.1).0.5 mL of 1 N HCl is then added into the columns,during which ferric chlorides in solutions are visible as a thin yellow ring on the resin migrating from the top to the middle of the columns.Iron fraction was then completely eluted by the following 1.5 mL of 1 N HCl and collected in Teflon beakers(Table 1 and Fig.1).The yieldsof Fe are always >99.5 %.Total procedural blank for Fe were routinely measured and give a long-term average of 79 ng (N=16),which is less than~0.01 % of the processed samples and thus are considered negligible.
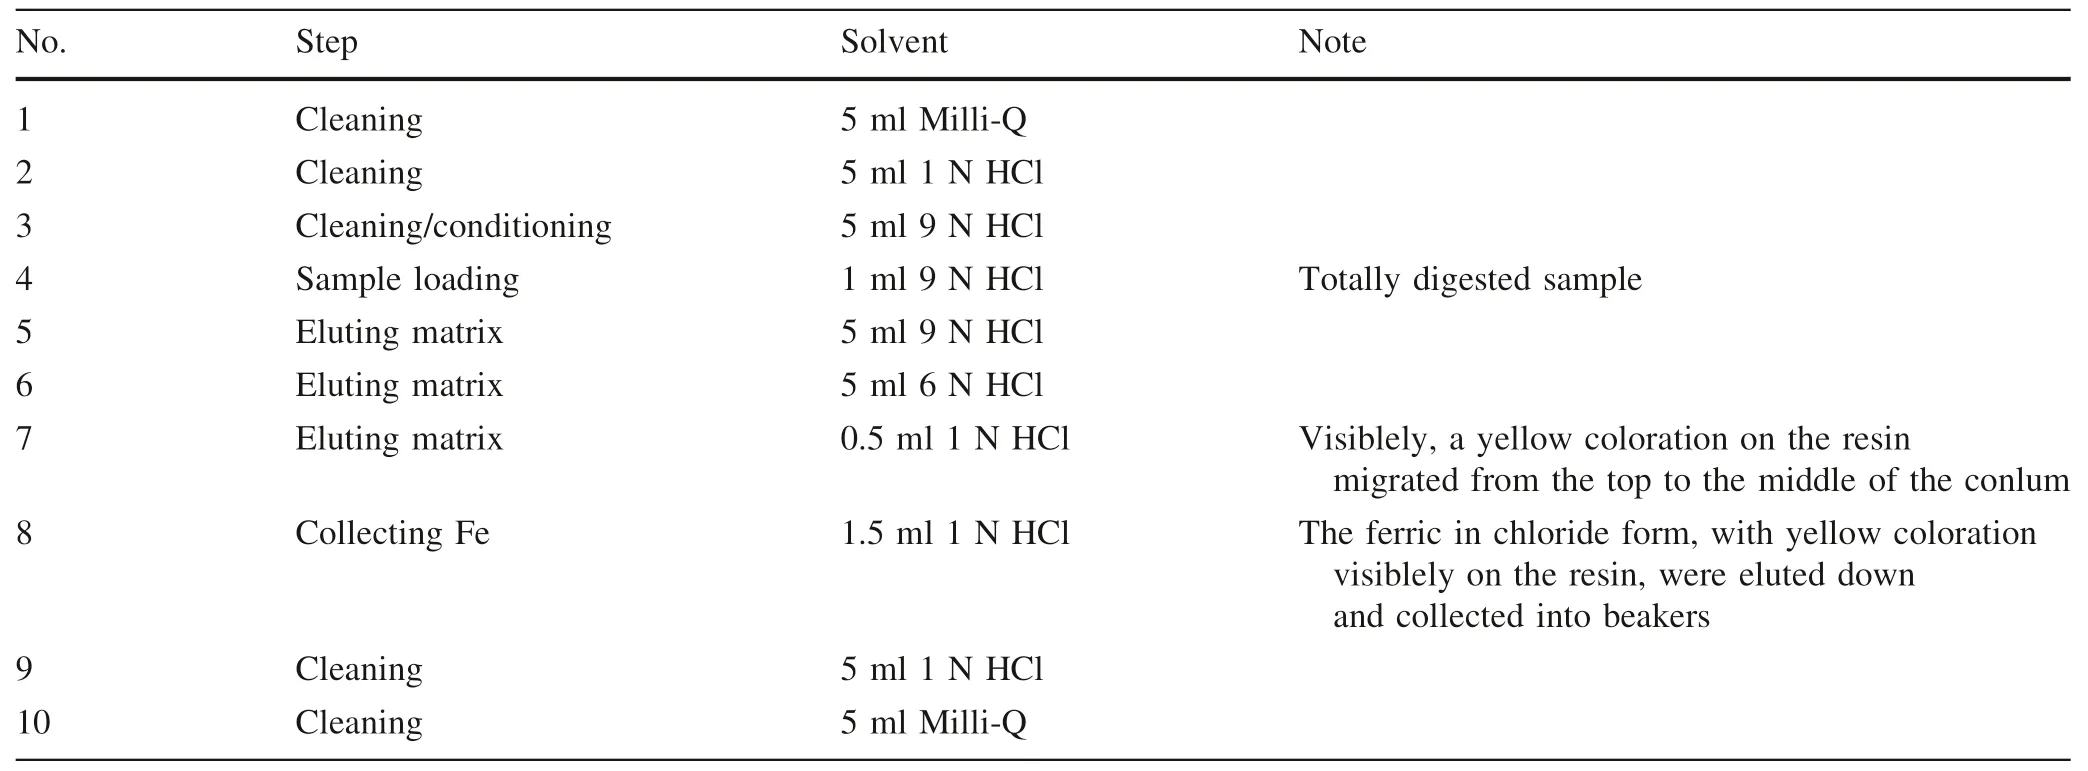
Table 1 Column chromatography procedure for Fe purification
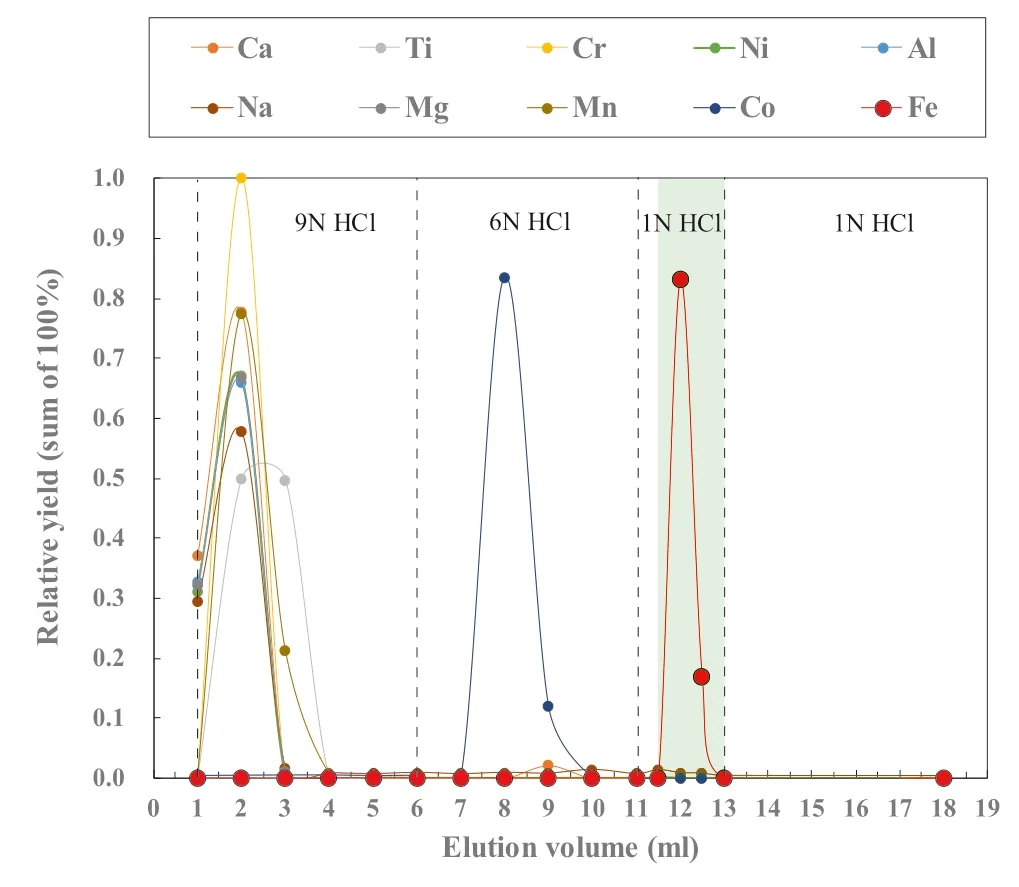
Fig.1 Elution curves for USGS rock standard BCR-2 on a 1 mL resin bed of AG-MP-1 M.The light green band stands for Fe collection
2.3 Mass spectrometry
Iron isotope analysis is done in the Laboratory of Ocean Lithosphere and Mantle Dynamics,Institute of Oceanology,Chinese Academy of Sciences,using a Nu Plasma II MC-ICP-MS equipped with 16 Faraday cups connected to an array of 1011Ω resistor amplifiers in static mode.The introduction of Fe solution consists of a 100 uL/min MicroMist nebulizer (Glass Expansion,Australia) connected to a Scott double-pass quartz cyclonic spray chamber,and pared skimmer cone+sampling cone made from nickel.Such a setup of wet plasma facilitates greater stability than using desolvation nebulizer of dry plasma(Dauphas et al.2009).
Iron isotopic ratios are measured in pseudo-high resolution mode using the 50 μm width source slit and alpha slits in order to correct for beam aberrations.The instrumental parameters are fully tuned to ensure mass resolution better than 7500 for data acquisition.During the measurement,Fe+peaks were resolved from interfering ArO+,ArOH+and ArN+isobars as flat-topped plateaus on the low mass shoulder of argide peaks (Weyer and Schwieters 2003).54Fe,56Fe,57Fe,58(Fe,Ni),60Ni and61Ni isotopes were simultaneously collected by Faraday cups at Low 6,Low 3,Central,High 3,High 8 and High 9 positions,respectively,on our Nu Plasma II instrument(see Table 2).Sample solutions were‘‘spiked’’with GSB Ni(an ultrapure single-elemental standard solution from the China Iron and Steel Research Institute,SN:18040213) for mass fractionation correction.Before that,each sample solution is scanned using Inductively Coupled Plasma Optical Emission Spectrometer (ICP-OES) prior to Fe isotopes analysis to ensure no detectable Cr and Ni.This is because54Cr would interfere54Fe and Ni compositions of the doped GSB Ni solution would be somewhat changed if any matrix Cr and Ni remain in the purified solutions.In our experiment,the Fe concentration of analyte solution is usually ≥12 ppm,corresponding to a~20 V total Fe signal,which is necessary to obtain high-precision iron isotopic results.Data acquisition was performed in one block of 30 measurements,and a total 570 s was required for one analysis.Considering the possible slightly magnet drift,peak centering(magnet centering at a given offset from the bottom of the peak)were carried out before each block.To obtain the high precision data,each sample was repeated atleast four times after a standard analysis,and the reported isotopic compositions are the averages of repeated analyses.More details of the instrumental working parameters are listed in Table 3.

Table 2 Faraday cup configuration used for the iron isotope measurements by Nu Plasma II MC-ICP-MS
During the analysis process,the instrumental mass bias is corrected using simultaneously determined58Ni and60Ni in the sample solution doped with a GSB Ni solution,combined with an exponential law as below:

where β1,β2represent the mass bias fractionation factors for Fe and Ni isotopes,and T,M denote true and measured isotope ratios,respectively.In our correction,we use the natural Ni isotopic abundance ratios=0.385199(Gramlich et al.1989)and assume β1=β2.Note that the58Ni here is58Fe corrected,i.e.,

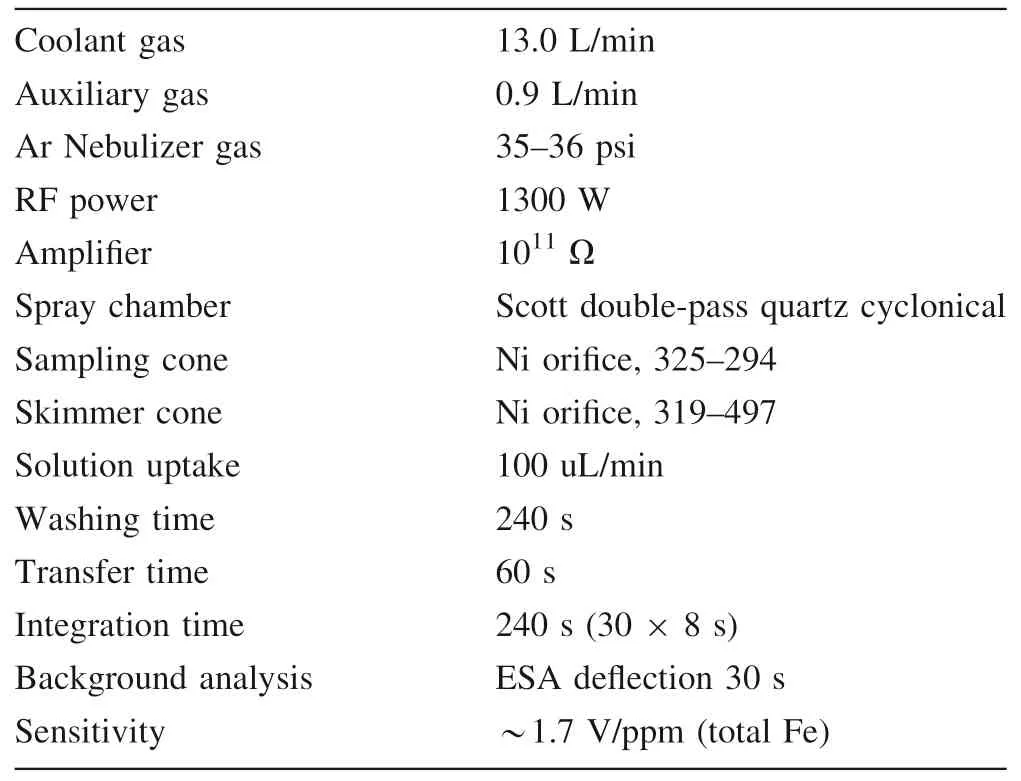
Table 3 Detailed information of the instrumental working parameters
given58Fe/56Fe=0.003074 following Taylor et al.(1992).For comparison,we also conduct the mass bias fractionation correction using61Ni and60Ni (see below).
The Fe isotopic data are reported in standard δ notion in per mil relative to the standard reference material(IRMM-014; Taylor et al.1992):
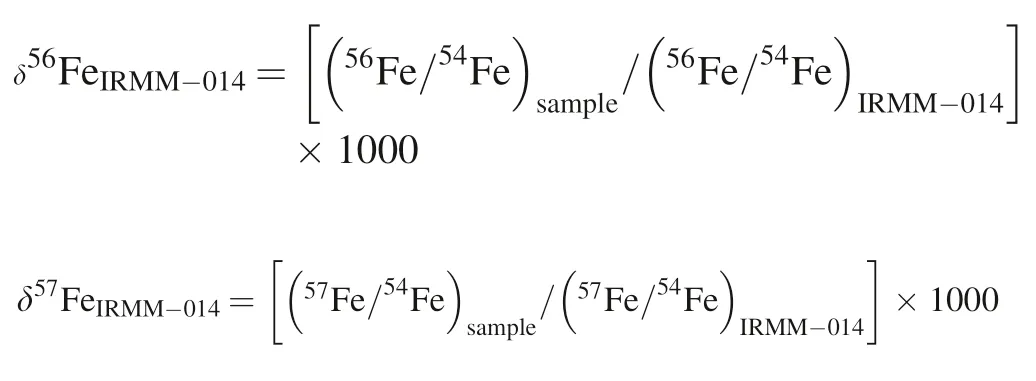
Because of the lack of IRMM-014 in our laboratory,we used GSB Fe solution (from He et al.2015) as the replacement in this study,with transformation of δ56FeGSB=δ56FeIRMM-014-0.729 and δ57FeGSB=δ57FeIRMM-014-1.073 within error of 0.03‰ (2SD).
3 Results and Discussion
3.1 The feasibility of Ni-doping method for mass bias corrections
Before we evaluate the feasibility of Ni-doping method to correct the instrument mass bias fractionation,we need to choose which two of the Ni isotopes’ratio is more reliable to calculate the fractionation factor.As reported previously,both60Ni/58Ni (Chen et al.2017a) and61Ni/60Ni(Poitrasson & Freydier 2005) have been adopted and both methods can produce data with good precision and accuracy.In our case,we prefer60Ni/58Ni than61Ni/60Ni.Figure 2 compares the long-term (Jan.to Apr.2019)measured mass bias fractionation factors for Fe and Ni isotopic ratios obtained through the analyses of the Alfa Fe solution and the GSB Fe standard solution(He et al.2015).Obviously,the correlation coefficients between βFe56-54and βNi60-58are much better than that of the βFe56-54and βFe61-60in both Aalfa Fe and GSB Fe solutions,which implies using βNi60-58is more reliable to correct the Fe isotopes’ mass bias fractionation.In Fig.2,the Alfa Fe data define a linear trend with a slope of 1.0126 ± 0.0887(R2=0.9977,n=281),and the data by GSB Fe-CUGB defines a linear trend with a slope of 1.0151 ± 0.0991(R2=0.9978,n=231).This suggests that the mass bias fractionation factors are slightly different for iron and nickel in our instrument.However,both the above fractionation factors are identical to the theoretical slope within error (TS=1.073,calculated assuming a natural mass weight of Fe and Ni).Furthermore,such a difference in mass bias factors would result in a maximum~0.03 ‰inaccuracy for δ56Fe as discussed in Poitrasson and Freydier (2005),which is comparable to our long-term precision(± 0.03 ‰,see below).Therefore,we assume that Ni and Fe have the same fractionation factor during the Fe isotope analysis in our case.In general,the experiment above justifies that the Ni-doping method is effective to correct for instrumental mass fractionation during the Fe isotope analysis.
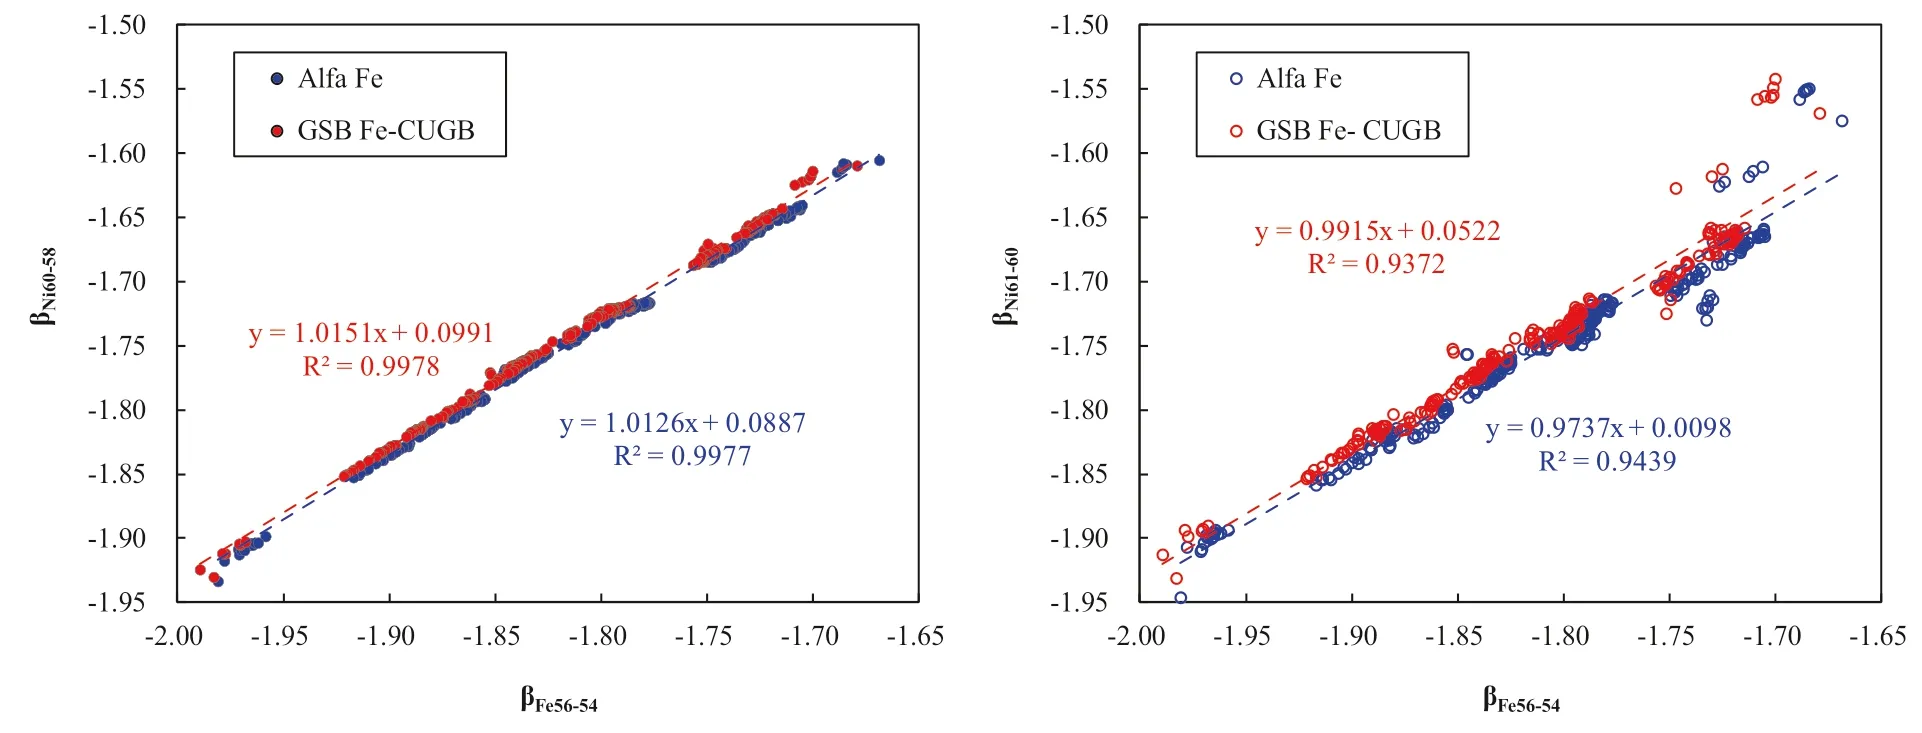
Fig.2 Plot of measured mass fractionation factors for Fe and Ni isotopic ratios obtained through analyses of the GSB Fe-CUGB and the Alfa Fe over the period of four months.Theoretical slope (TS)=ln (Mass56Fe/Mass54Fe)/ln (Mass60Ni/Mass58Ni)=1.073
3.2 The Ni:Fe ratio effect
In order to evaluate the effect of the Ni:Fe ratio in the sample solution on the Fe isotope analysis result,14 ppm Alfa Fe solution was mixed with GSB Ni with Ni:Fe ratios ranging from~0.1 to~3.0.In the experiment,the Ni:Fe ratios in the Alfa Fe solution and in the standard GSB Fe-CUGB were highly matched.The experimental results show that the δ56Fe values of the Alfa Fe solution increase with decreasing Ni:Fe ratios(Fig.3),being consistent with the results in Chen et al.(2017a).According to our experimental results,the Alfa Fe solutions with Ni:Fe ratios ranging from 0.8 to 2.1 can yield accurate δ56Fe values.The Alfa Fe solutions with Ni/Fe ratio <0.5 yield δ56Fe values abnormally higher than reference values(0.52 ± 0.03 ‰).The possible reason might be that low Ni intensity would increase the effect of58Fe on58Ni,which affect the mass bias fractionation factor in return and result in abnormally high δ56Fe as well.On the other hand,the data show that both the accuracy and precision when Ni:Fe >3.0 are not as good as that when Ni:Fe=1.0–2.0,an explanation is that the high concentration of the Ni would suppress the Fe ionization at the touch position.In our laboratory,to achieve the best results,the Ni:Fe ratio in solutions is usually fixed at~1.4–1.5.
3.3 The match of Ni:Fe ratios between samples and standard solutions
The match of Ni:Fe ratios between samples and standards is also an important variable that affects the data.This is because the mismatch of the Ni:Fe ratio between samples and standards solutions would result in different mass bias in the instrument.To explore the effect of the Ni:Fe ratio match between samples and standard,we fixed the Ni:Fe ratio in the standard(GSB Fe-CUGB)at 1.58 with 12 ppm Fe concentration.At a given Fe concentration of 12 ppm in Alfa Fe solutions,the Ni:Fe ratios vary from 0.1 to 3.5.The data show that the δ56Fe values of the Alfa Fe solution increase with the Ni:Festandard/Ni:Fesamplesincreasing(Fig.4).That is,the mismatch of the Ni:Fe ratios between the samples and the standard would greatly affect the analyzed results.For the purpose of accuracy in our laboratory,the recommended difference of Ni:Fe ratios between samples and standards (e.g.,Ni:Festandard-Ni:Fesamples) is less than 20 % in percentage.
3.4 The match of Fe concentration between samples and standards solutions
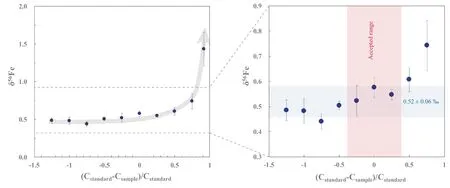
Fig.5 Effect of varying Fe concentration between sample and standard.Error bars represent 2σ uncertainties.The light blue band denotes the recommended Fe isotopic values within 2 σ uncertainties,i.e.,0.52 ± 0.06‰,and the light red band denotes the accepted Fe concentration between samples and standard in our lab
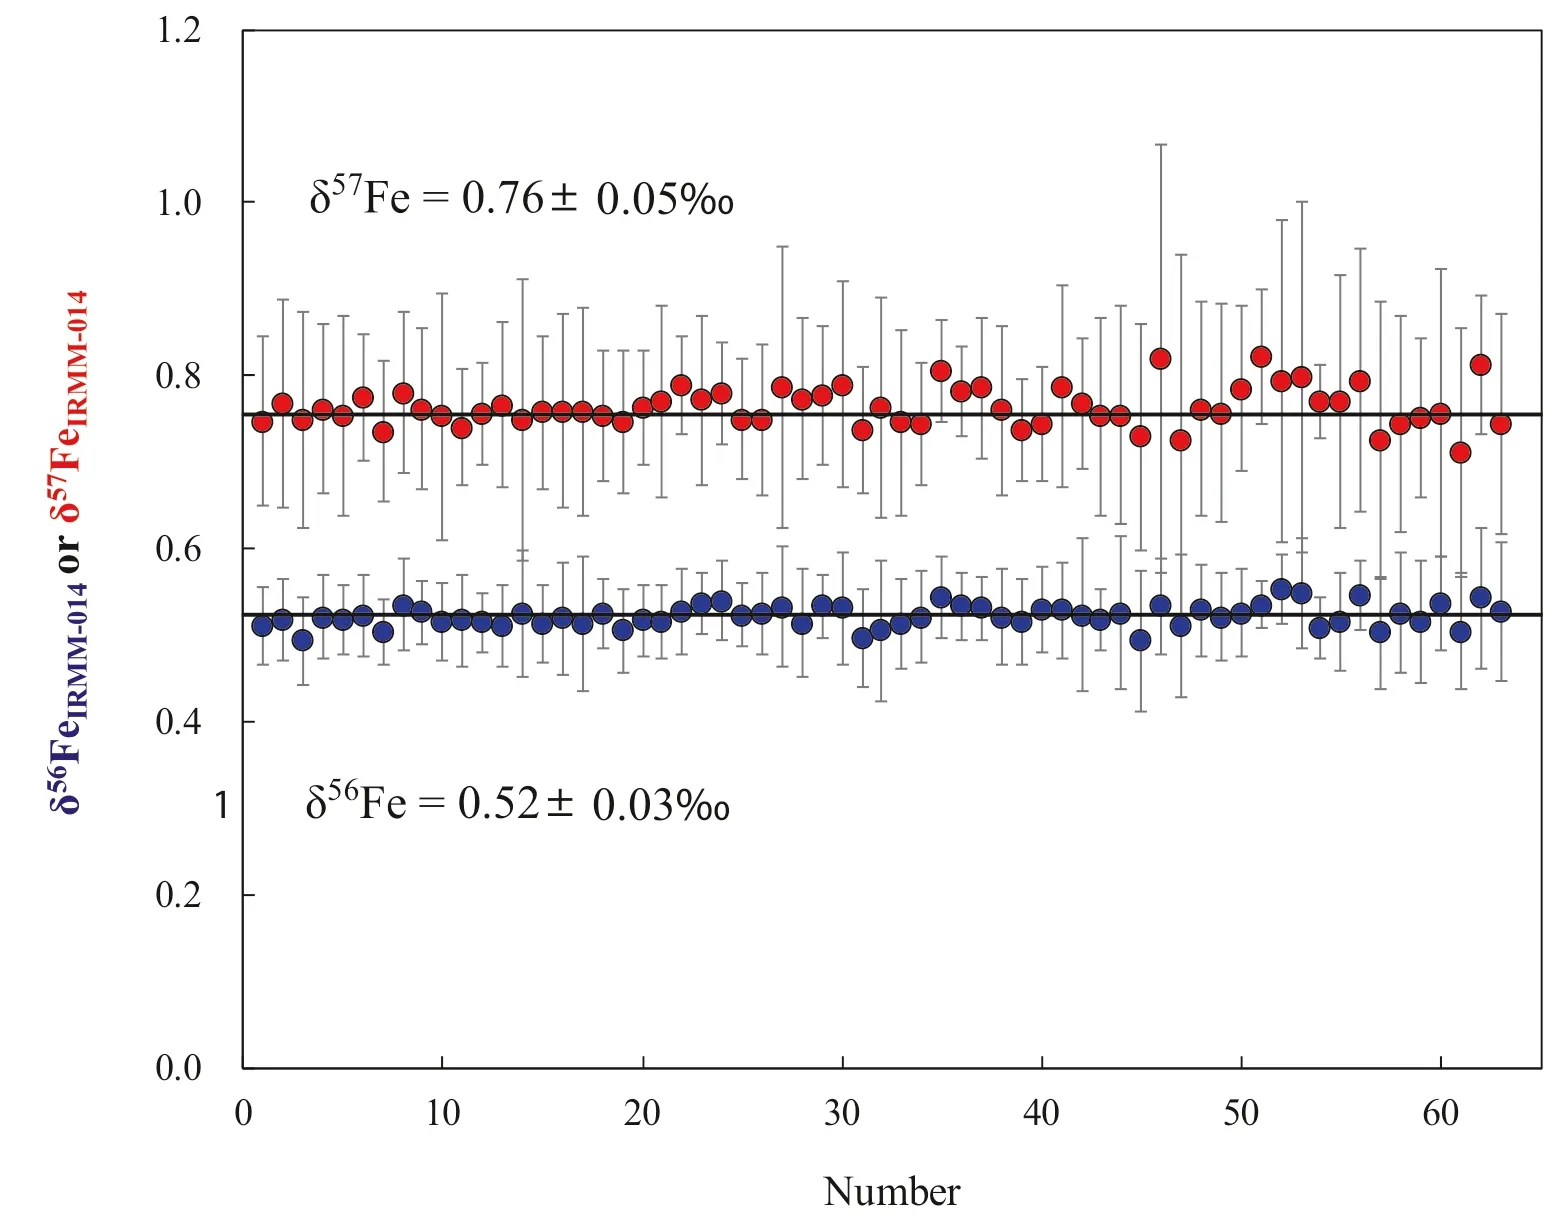
Fig.6 Long-term stability of Fe isotopic compositions of the Alfa Fe.Bars represent.2SD
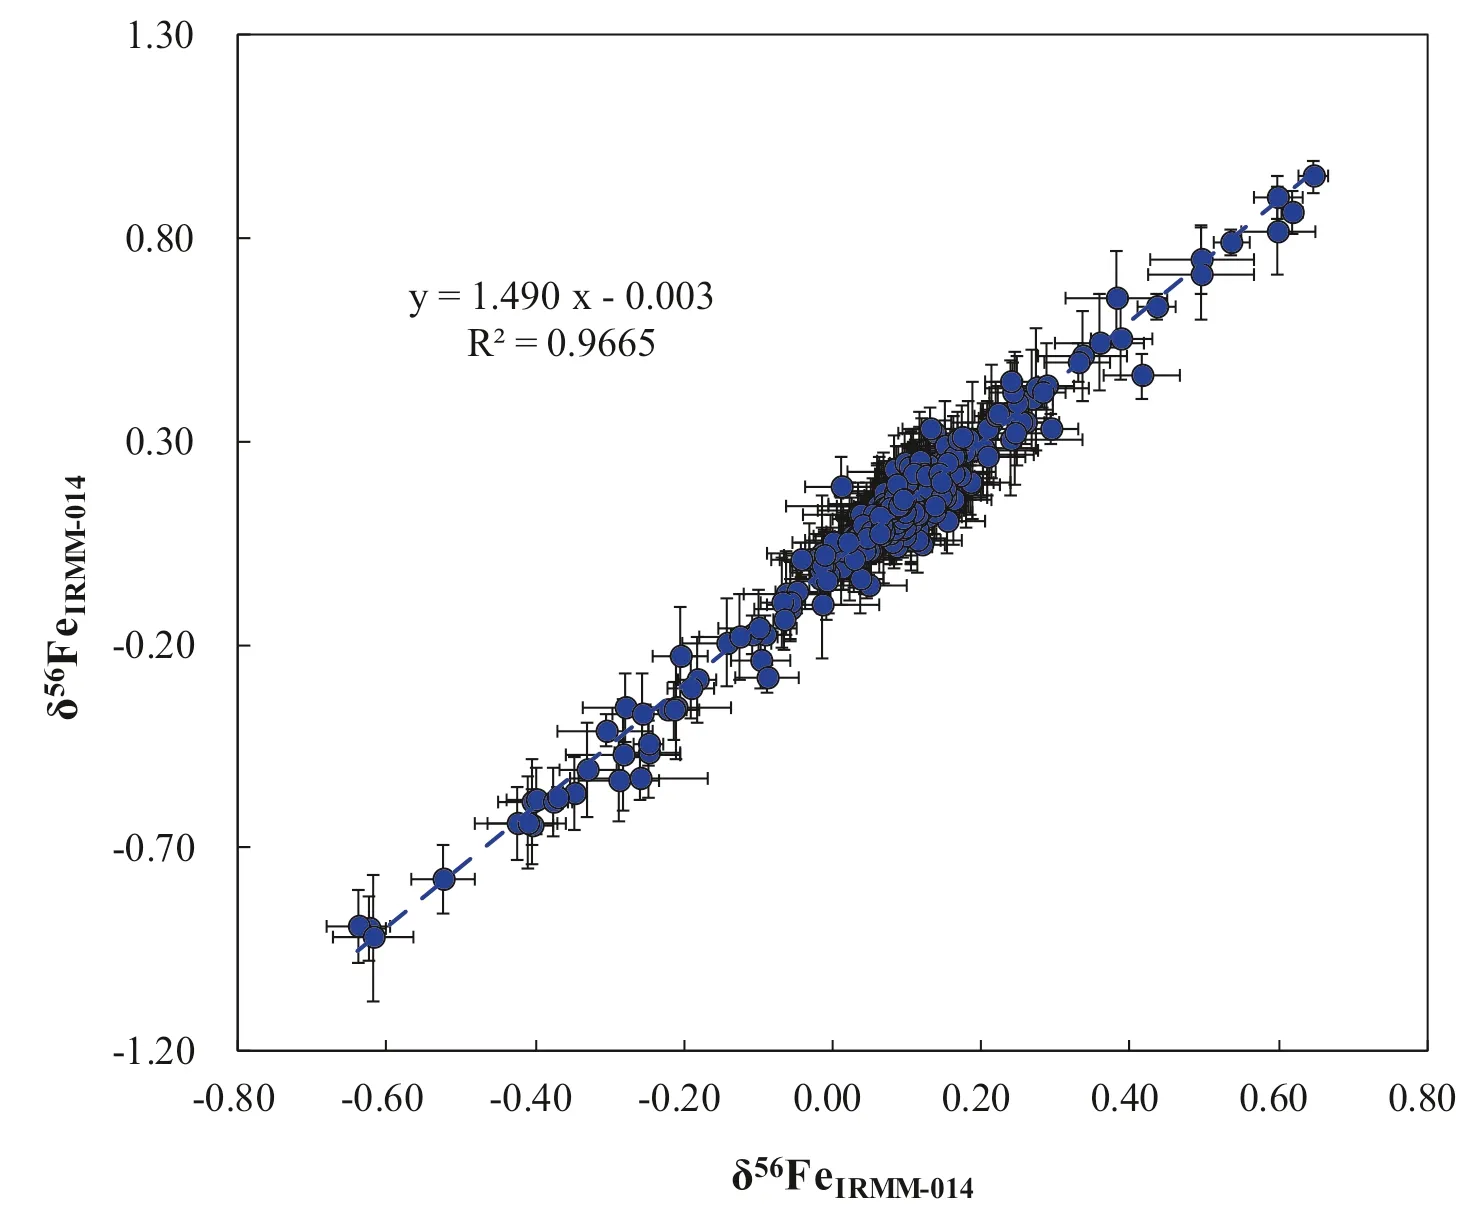
Fig.7 Iron isotope compositions of various geological samples relative to IRMM-014 analyzed over the period of three months.The gray line represents a linear regression of δ56Fe vs.δ57Fe with a slope of 1.490 ± 0.015(SE) (R2=0.9665,N=332).This relationship is statistically consistent with both theoretical predictions of mass-dependent isotope fractionation (slope of 1.475; Young et al.2002) and with previously measured isotopic mass-dependent fractionation trends using Nu Plasma (slope of 1.482; Chen et al.2017a)
As we have demonstrated above,both the Ni:Fe ratio in analyte solutions and match of Ni:Fe ratio between samples and standards solutions are important to ensure good results.However,concentration effects,which refer to the changes in the instrumental mass bias(fractionation factor)with the concentrations of elements in the samples or standard during analysis,is also a key to obtain highquality data (Zhu et al.2002; Chen et al.2017a).For the SSB method,the concentration match between samples and standards is extremely important (Zhu et al.2002).A previous study shows that the concentrations of the samples and the standards differ by more than 15 %would result ina significant deviation between the measured and true values (Chen et al.2017a).In our experiment,the Ni:Fe ratios in both samples and standard were fixed at 1.5.Given that the Fe concentration of the standard(GSB Fe)fixed at 12 ppm,we change the Fe concentration of Alfa Fe from 1 ppm to 27 ppm.The result shows that the δ56Fe values of Alfa Fe solution increase with (Cstandard-Csample)/Csample(Fig.5),where Cstandardstands for the concentration of the standard GSB Fe and Csamplestands for the concentration of the sample (Alfa Fe in our experiment).This suggests that the mismatch of Fe concentrations between samples and standards can also result in the measurement inaccuracy.In this case,we recommend that the Fe concentration difference by 40% between samples and standard is acceptable in our lab.
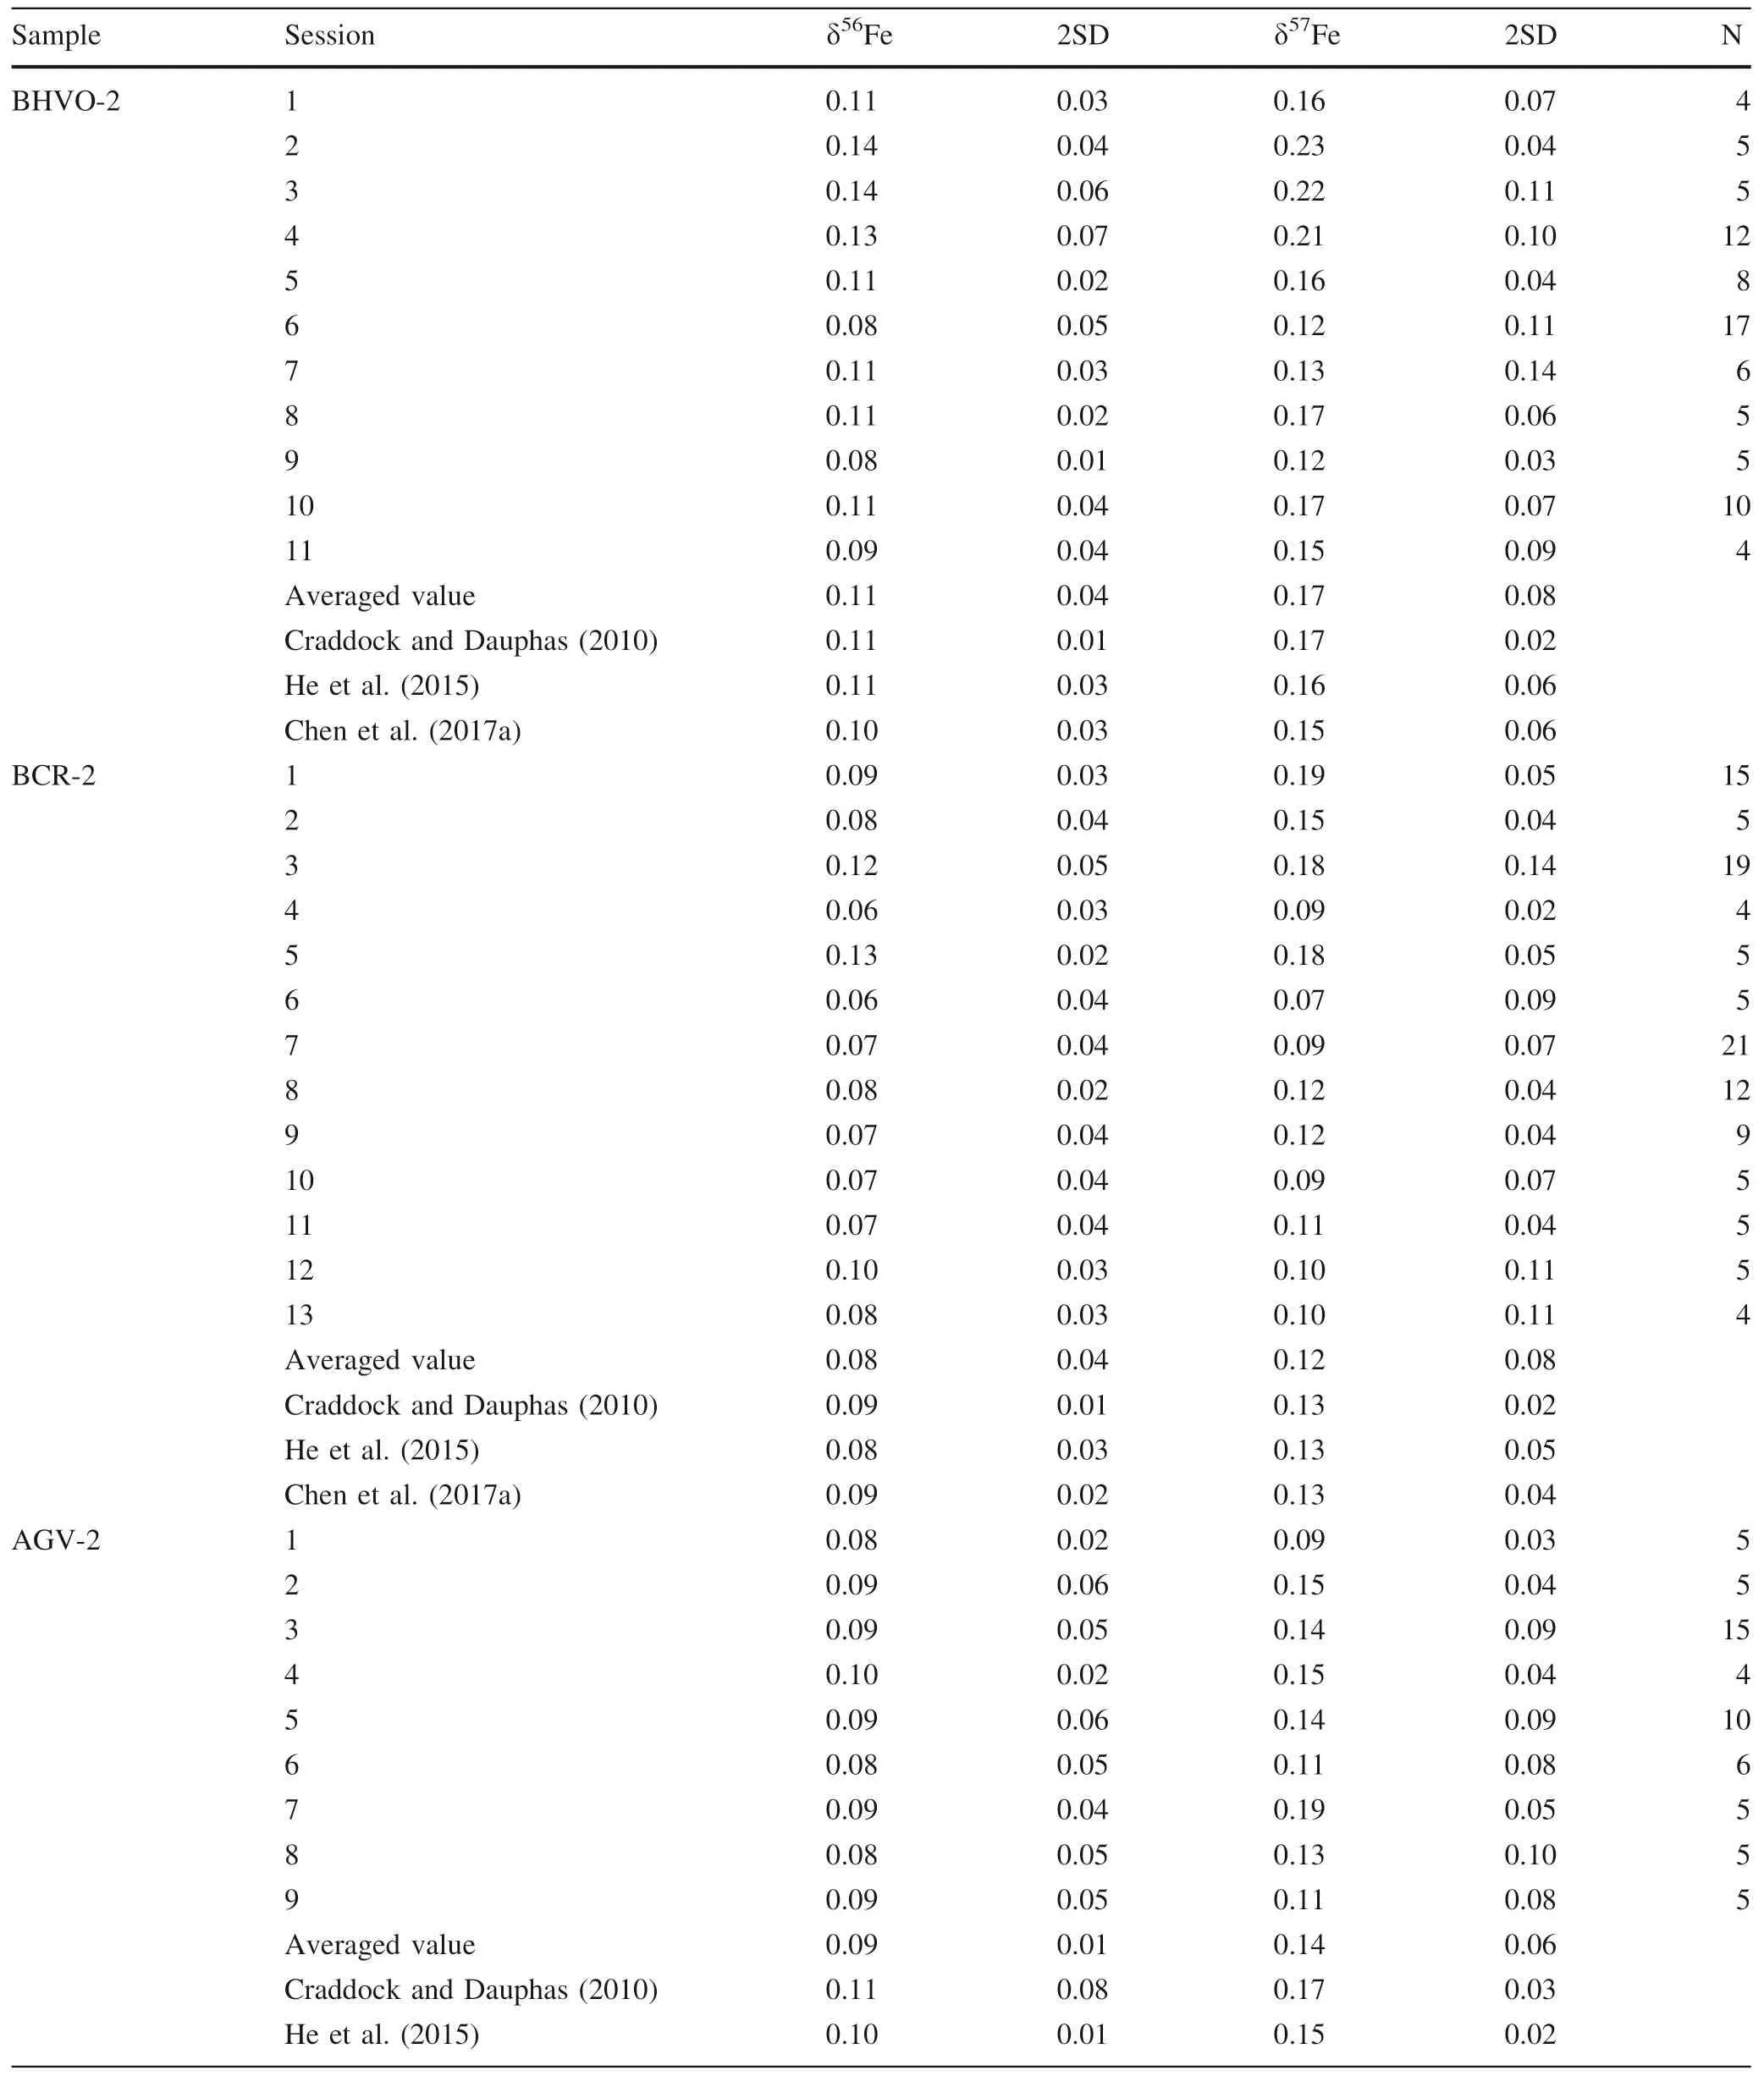
Table 4 Fe isotopic composition of USGS rock materials and geostandards reported in this study
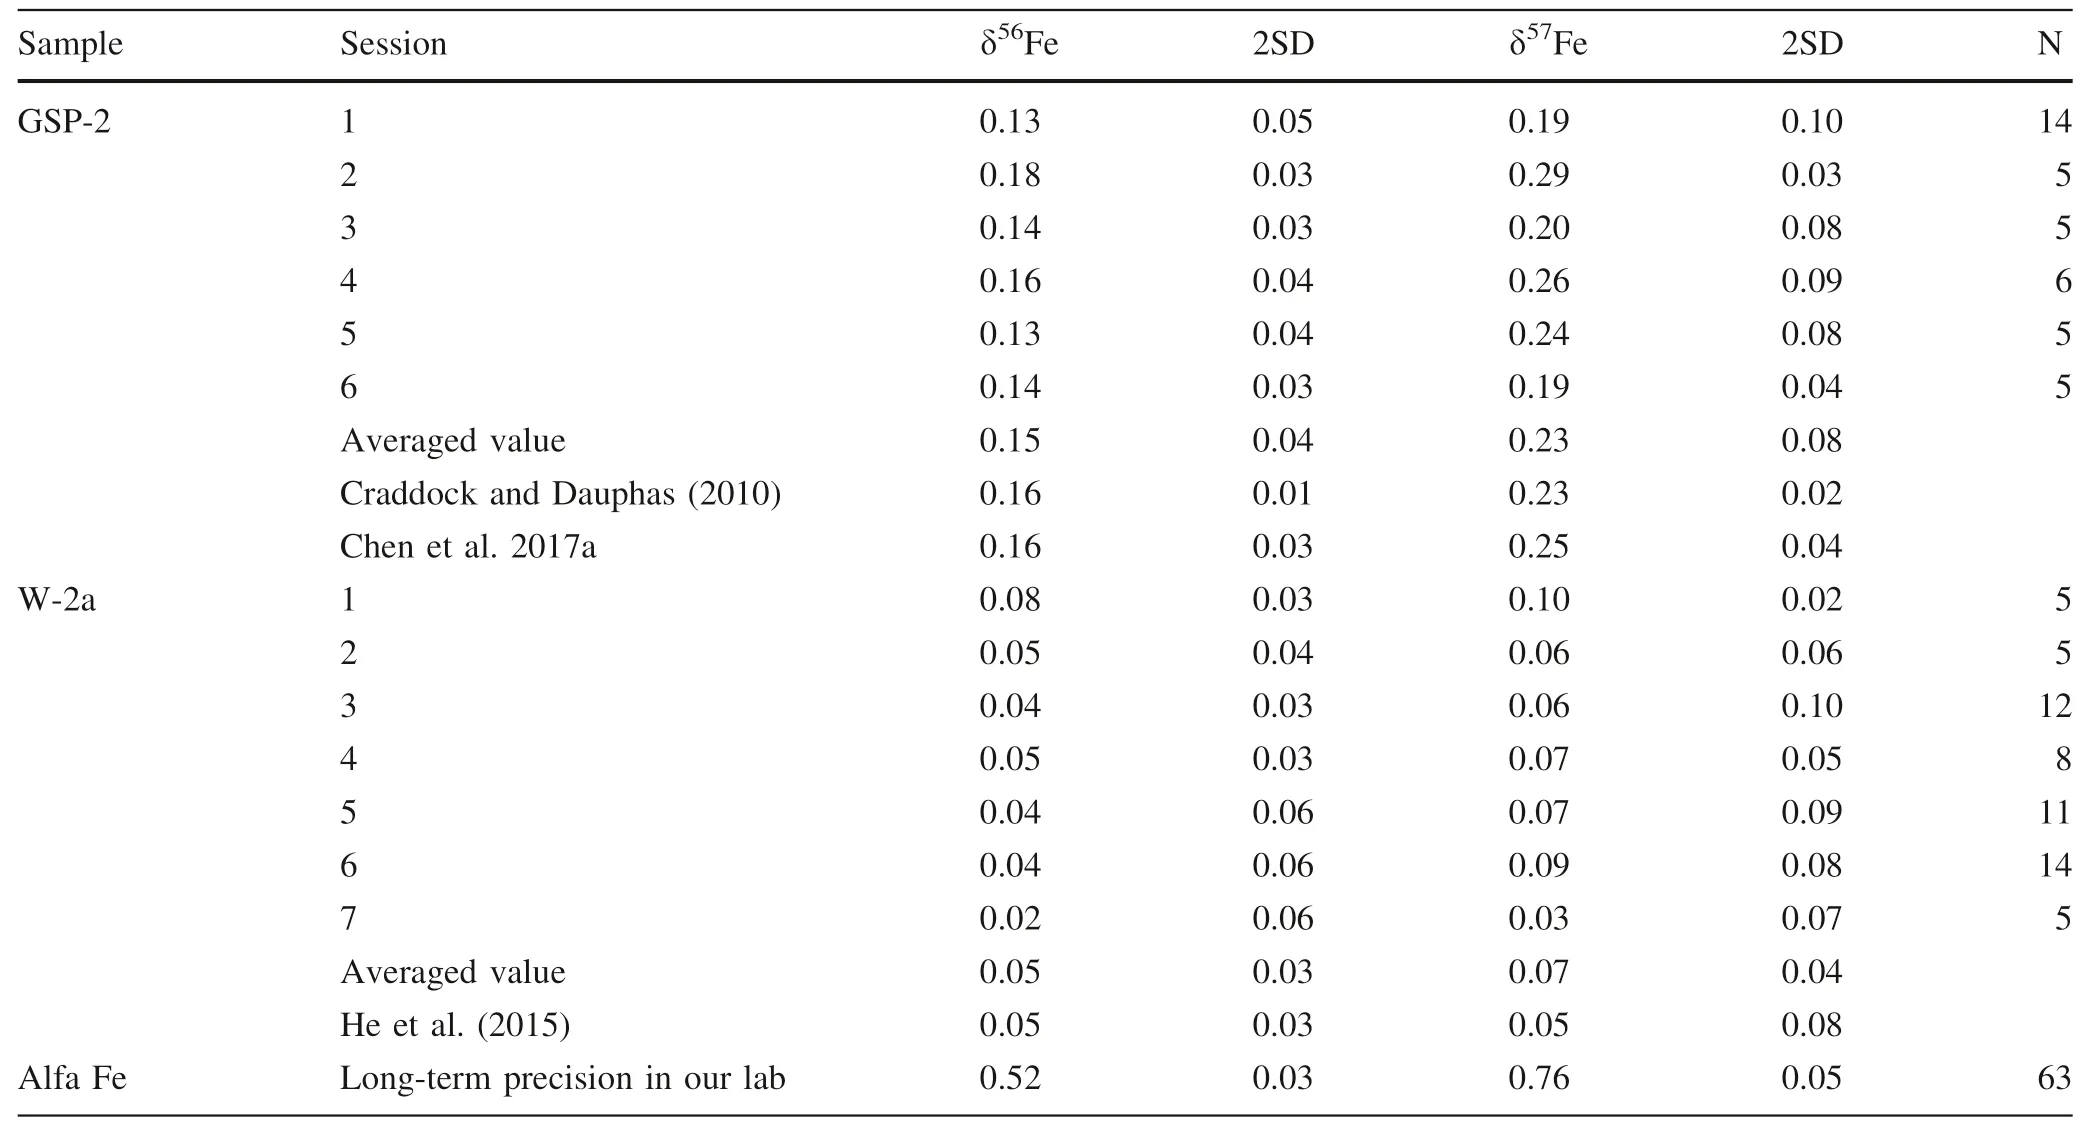
Table 4 continued
4 Geological standards accuracy and precision check
To evaluate the accuracy and precision of Ni-doping method established in our laboratory,the Fe isotope composition of various samples have been measured and delta values were calculated relative to IRMM-014.One year analysis of an in-house standard Alfa Fe solution gives a long-term 2SD=0.03 ‰for δ56Fe,and 2SD=0.05 ‰for δ57Fe (Fig.6).Figure 7 shows that the data form a linear trend between δ56Fe and δ57Fe with a slope of 1.490 ± 0.015 (SE) (R2=0.9665,N=332),which is indistinguishable from theoretical predictions of mass-dependent isotope fractionation.
We analyzed USGS geological reference materials,including diabase (W-2a),basalt (BCR-2,BHVO-2),andesite (AGV-2) and granodiorite (GSP-2),during which the Fe concentration of these geological reference materials and standard (GSB Fe) solutions are~12–14 ppm,with the Ni:Fe ratios well matched (i.e.,Ni:Fe=~1.4–1.6 in all analyte solutions).The results are reported in Table 4.The iron isotopic data obtained in this study are well consistent with the literature values within error(Craddock and Dauphas 2010 and references therein; Liu et al.2014;He et al.2015; Chen et al.2017a; Li et al.2019).
5 Conclusion
To obtain high-quality Fe isotope data in laboratories,Nidoping is the method of choice to effectively correct for the instrumental mass fractionation.However,caution is necessary when using this method.The Ni:Fe ratio should match well between samples and standards,while the Fe concentration match between samples and standards is not that rigorous.The Fe isotopic compositions of USGS rock materials determined using above Ni doping method are in good agreement with the literature data within 2SD uncertainties,and the precision and reproducibility of this method are better than ± 0.03 ‰(2SD,N=63)for δ56Fe and better than ± 0.05 ‰ (2SD,N=63) for δ57Fe,respectively.
AcknowledgementsYongsheng He kindly provided the GSB Fe standard solution.We thank Yue-xing Feng,Kaiyun Chen,Ming Li,Liang Li,Yajun An,Jin Li,Jianfeng Gao and Weiqiang Li for their help during our Fe analysis method establishing process.We acknowledge helpful reviews by the three anonymous reviewers.This work was supported by National Nature Science Foundation of China(Grant Numbers 41776067 and 41630968).
Compliance with ethical standards
Conflict of interestOn behalf of all authors,the corresponding author states that there is no conflict of interest.
杂志排行
Acta Geochimica的其它文章
- In-situ nitrogen fate in the vadose zone of different soil types and its implications for groundwater quality in the Huaihe River Basin,China
- Organic geochemistry of the Lower Permian Tak Fa Formation in Phetchabun Province,Thailand:implications for itspaleoenvironment and hydrocarbon generation potential
- Mantle plume:the dynamic setting of the origin of Early Paleozoic mafic dykes in Ziyang,Shaanxi Province,Southern Qinling Block,China
- Using Sr isotopes to trace the geographic origins of Chinese mitten crabs
- Geochemical characteristics and origin of the Neoproterozoic high-K calc-alkaline granitoids in the northern part of Mandara hills,northeastern Nigeria
- Trace elemental signatures and mineral chemistry of clays associated with the alteration halos of the Paleoproterozoic U mineralization in Bijawars of the Sonrai Basin,Central India
