Organic geochemistry of the Lower Permian Tak Fa Formation in Phetchabun Province,Thailand:implications for itspaleoenvironment and hydrocarbon generation potential
2020-06-22PiyaphongChenraiSupawichFuengfu
Piyaphong Chenrai·Supawich Fuengfu
Abstract The outcrop samples of the Tak Fa Formation(Lower Permian) in Phetchabun Province have been studied to determine their organic geochemical characteristic,depositional paleoenvironment,and hydrocarbon generation potential.The total organic carbon (TOC) values ranging from 1.42 to 4.58 wt% and extractable organic matter values ranging from 76.84 to 197.65 ppm of the Tak Fa Formation were generally low and associated with low S2 values (0.00–0.50 mg HC/g rock) and hydrogen index values in range of 0–32 mg/g TOC,although this could reflect highly thermal maturity and complex tectonic history.Thus,kerogen classification can be based on a nonbiomarker study for these outcrop samples instead.The non-biomarker plot,Pr/n-C17 and Ph/n-C18 from this study indicates that organic matter originally comes from type II/III kerogen.The samples were also investigated and indicated that the organic matter inputs were derived from mixed marine and terrigenous sources and deposited under suboxic to oxic conditions.The depositional environment of the Tak Fa Formation in this study is interpreted to be an estuarine environment or restricted lagoonal carbonate platforms.This has been achieved from normal alkane and isoprenoids distributions,terpane,and sterane biomarkers.Thus,the Tak Fa Formation is considered to be a hydrocarbon source rock during the time of the deposition.Although the geochemical data in this study indicate that the Tak Fa Formation has experienced high maturation,one or more locations could meet a condition that places this formation to be an active source rock.The approach and concepts presented in this study can be applied to similar evaporite-carbonate deposits in Thailand to find more petroleum plays.
Keywords Biomarker·Depositional environment·Source inputs·Tak Fa Formation·Khao Khwang Platform
1 Introduction
Similar to the rest of the world,petroleum energy demand has been increasing in Thailand every year,but domestic petroleum production has been insufficient.In addition,import of petroleum products includes liquid gas,oil,and crude oil make up a significant portion for adequate demand to commercial and household petroleum consumption in Thailand.Thus,Thailand needs more petroleum exploration and production works for the nation.The Khorat Plateau,containing onshore gas fields in the country,covers an area of approximately 200,000 km2of Mesozoic continental sedimentary rocks of the Khorat Group.The only two petroleum commercial fields producing presently are Nam Phong and Sin Phu Horm.Hence,this plateau has a potential petroleum field for commercial production and development.Petroleum potential reservoirs in this plateau have been discussed within three different rocks including (1) Permian carbonate of the Pha Nok Khao Formation of the Saraburi Group,(2) fluvial sandstones of the Khorat Group and (3)basement reservoirs (Racey 2011).However,Permian fractured carbonates of the Saraburi Group is the main proven reservoir encountered to date (Racey 2011).
Racey(2011)summarized a potential source rock in the Khorat Plateau that can be predicted from the three source rocks including (1) Lower Cretaceous Khorat Group containing few centimeters of woody organic materials in its lateral red bed sequence producing minimal gas by locally mature stage (2) Triassic Huai Hin Lat organic-rich shale(Kuchinarai Group),and (3) Upper Carboniferous—Upper Permian in the Saraburi Group,which was proved to be a petroleum source rock by total organic carbon (TOC)0.3–1.6 wt%with kerogen type II and III,comprising both micritic limestone and marine shale (Si That Formation).Deposited under shallow marine to basinal sedimentary conditions,these limestones and shales are believed to be the main hydrocarbon source rocks of the Khorat Plateau,including two significant producing petroleum fields.However,there is no well penetrated to the source rock strata due to the thick sedimentary rocks of the Khorat Group (Racey et al.1996).Thus,petroleum geochemistry data of these three source rocks are not sufficient to prove where the petroleum found in the Khorat Plateau originates from.Outcrop geochemistry data would help to get a better understanding of hydrocarbon source rocks in the region.
Upper Carboniferous—Upper Permian in the Saraburi Group was identified as the major source rock unit for petroleum gas field in the Khorat Plateau and its organic geochemical character was expected to be regionally extensive throughout the Permian carbonate platforms.The Permian rock strata in this region consist of three major elements:the Khao Khwang Platform/Tak Fa Formation,the Pha Nok Khao Platform and the Nam Duk Basin located in the west,the east and middle of the Loei-Phetchabun Fold Belt,respectively,as presented in Fig.1(Wieldchowsky and Young 1985).Chonglakmani and Sattayarak(1984)suggested these two platforms have ever been an identical platform before the collision event during the end of Permian to Early Triassic.Due to the fact that the organic-rich carbonate sequence in the Pha Nok Khao Platform was established as the dominant source sequence for the gas fields in the Khorat plateau(Racey 2011).Thus,organic richness is probably distributed in both shale and carbonate rocks in the Khao Khwang Platform as well as the Pha Nok Khao Platform.This study provides the first description of petroleum geochemistry data in the Khao Khawang Platform area.In addition,geochemical data can be also used to identify the depositional environment in the study area.This study focuses on the organic geochemical characteristic and depositional paleoenvironment of the Tak Fa Formation to gain a better understanding of the hydrocarbon source rocks in the study area.
2 Geological setting
The study area is part of the Khao Khwang Platform and belongs to the Tak Fa Formation which is a correlative of the Khao Khwang Formation of the Saraburi Group (Udchachon et al.2014).Geologically,the Saraburi Group is interpreted as a suite of Permian rift basin fills on the southern margin of the Indochina terrane controlled by extensional faults (Booth and Sattayarak 2011; Morley et al.2013).The Indochina terrane is interpreted to drift away from the northern margin of Gondwana by the Early-Middle Permian (Yan et al.2018).These Permian basins are simplified as large basins and platforms based on outcrop data (Wieldchowsky and Young 1985).However,the seismic reflection data from the Khorat Plateau area suggests that the geological setting and stratigraphy of these basins are more complex,with rift basins filled with clastics and mixed clastic and carbonate sediments associated with small carbonate platforms (Booth and Sattayarak 2011).
The Khao Khwang/Tak Fa Formation is widely distributed in the northern Saraburi Province to southern Phetchabun Province.The formation was deposited in a shallow-marine carbonate platform environment characterized by massive to medium-to-thick,well-bedded limestone with subordinate sandstone and shale (Ridd et al.2011).The age of the Tak Fa Formation is correlated to the late Early Permian to early Middle Permian (Chitnarin et al.2012; Metcalfe and Sone 2008).The fauna found within the Tak Fa Formation is representative of the Equatorial Warm Water Province,close to Indochina Terrane during the Kungurian (late Early Permian) (Metcalfe and Sone 2008).The ostracod study from Chitnarin et al.(2008) also suggests that the Tak Fa Formation was deposited within a shallow marine,euryhaline,nearshore environment.
At the end of the Guadalupian in the Khao Khwang Platform,the limestone sequence was truncated by two major erosional surfaces which were related to global sealevel lowstands (Udchachon et al.2014).Late Permian environmental change is indicated by paralic and nonmarine deposits along the western margin of the Indochina Terrane (Udchachon et al.2014).Plant and wood fossils are found in the Late Permian sequences in the Phetchabun area and further to the north along the Loei-Phetchabun Fold Belt(Chonglakmani and Fontaine 2000).There was a tectonic uplift in parts of the Loei-Phetchabun Fold Belt,possibly around the Guadalupian–Lopingian boundary which continued up to the Triassic (e.g.Bunopas 1983;Chonglakmani and Sattayarak 1984; Chonglakmani and Helmcke 2001).The Permian strata of the Tak Fa Formation are separated from the Mesozoic sediments by the Indosinian I unconformity.Most Paleozoic strata in the region were deformed during this Indosinian I event (Ridd et al.2011).

Fig.1 The study area and outcrop samples collected from four outcrop exposures within the Tak Fa Formation/Khao Khwang Platform
3 Materials and methods
Four outcrop locations of the Tak Fa Formation covering in three districts of Phetchabun Province,including Bueng Sam Phan (BP),Nong Pai (NP),and Chon Daen (CD)districts were collected for this study (Fig.1).Bueng Sam Phan samples were collected from the southern part of the study area.While the northern part of the study area includes Chon Daen in the west and Nong Phai in the east.Generally,bitumen and kerogen were packed within sedimentary rocks such as shale or limestone,thus organic hydrocarbon compaction can be observed with the naked eye to consider the possible organic matter richness.For example,black shale can be referred to as organic-rich shale while organic matter within brown shale is relatively less than black shale.In this study,nine rock samples were collected as a purposive selection method based on darkcolored samples for geochemical analysis including total organic carbon measurement,Rock-Eval pyrolysis,bitumen exaction,and gas chromatography-mass spectrometry.The nine samples were classified as limestone and shale including argillaceous limestone.The lithological description is used to quantify organic matter richness in different rock types (Table 1).
The samples referred to as ‘outcrop samples’ in this paper were not taken directly from the surface (outcrop wall).Instead,they were collected by digging about 0.10 and 0.30 m into the outcrop to ensure that visibly unweathered material was obtained.However,it should be noted that the weathering process of rocks at outcrops in this region is usually high due to the hot and humid conditions in Thailand.The remaining weathered parts of the samples are removed before the next procedures.The rock samples are minimized into remnants by a hammer and a jaw-crusher,respectively.Then,the samples are ground into powders by an agate ball mill,which is cleaned between samples by grinding with baked quartz sand multiple times.The containing glassware and the ball mill are also washed with distilled water and then rinsing withacetone followed by dichloromethane to prevent contaminations.

Table 1 Rock type,total organic carbon(TOC),extractable organic matter(EOM),and Rock-Eval pyrolysis results of the samples from the Tak Fa Formation
3.1 Extractable organic matter
Organic matters within pore space in sedimentary rocks are deformed under certain condition,they can be divided into two types:kerogen and bitumen.Bitumen or extractable organic matter (EOM) from source rocks is reconstructed during organic sediment deposits by diagenesis,catagenesis,and metagenesis processes (Tissot and Welte 1984).Thus,bitumen within rocks can be extracted by organic solvent with solid–liquid extraction technique(e.g.Li et al.2015; Sachse et al.2011).The bitumen was extracted from 50 g of powdered samples with dichloromethane (DCM).After the extraction process was done,the massive solvent was removed from an extracted and collected for isolation by a rotary evaporator.A concentrate of the solution was fractionated into saturated hydrocarbons,aromatic hydrocarbons,and resin by column chromatography on silica gel recording in part per million(ppm),which is equivalent to milligram of extractable organic matter per kilograms rock (mg/kg).
3.2 Total organic carbon (TOC) measurement
The pulverized samples were analyzed for TOC contents by SHIMADZU TOC analyzer with solid sample module(SSM-5000A).Details of the TOC measurement are given in Sleutel et al.(2007).The TOC content was measured on nine rock samples of the Tak Fa Formation and reported in percentage per rock weight (wt%).Rocks that have TOC values exceeding 0.2 wt% from limestone and 0.5 wt%from shale are considered as a hydrocarbon potential source rocks (Tissot and Welte 1984; Hunt 1996).
3.3 Rock-Eval pyrolysis
The Rock-Eval-6 instrument provides a rapid source rock analysis(37 min/sample)on a small sample(50–70 mg)of rock by heating over a temperature range of 300–650 °C,after an initial gas purge at 90 °C.This analysis quickly evaluates the concentration of volatile and soluble organic matter,the amount of pyrolysis organic matter and thermal maturity.The sample is rapidly heated to 300 °C.This vaporizes the hydrocarbon already present in the samples,allowing it to be quantified by a flame-ionization detector and recorded as the S1peak.Hence,S1corresponds to the quantity of hydrocarbon release during isothermal temperature step at 300 °C and shows the temperature of free hydrocarbons contained in the rock samples that are possible represented bitumen and/or methane migrating from other sources.The temperature is then raised progressively at a rate of 25 °C/min to 600 °C converting all remaining petroleum potential of the kerogen into bitumen and gas,and the S2peak is thus measured.S2then corresponds to the quantity of hydrocarbon release between 300 and 600 °C and represents the hydrocarbon generated from thermal cracking of kerogen.The maximum temperature of peak hydrocarbon generation due to thermal cracking of kerogen with the peak of S2is called Tmax.The S3corresponds to the quantity of hydrocarbon release between 300 and 390 °C and represents organic carbon dioxide release.The units of S1and S2are milligrams of hydrocarbons per gram of rock (mg HC/g rock) (Behar et al.2001).
3.4 Gas chromatography-mass spectrometry
Gas Chromatography–Mass Spectrometry (GC–MS) is a usually instrumental technique for identifying the molecular mass of an organic compound by ionized composition.In this study,GC–MS was used to analyze biomarker compounds in the bitumen extracts.The sample solution is injected into the ionizing chamber by electron impact,ionized gas flows through the column and separated into compounds by polarity and molecular weight.The separated substances throughout from column and then flow into the mass analyzer equipment.Mass analyzer identifies compounds by the mass of the analysis molecule under the electromagnetic field.
In this study,the saturated hydrocarbon fraction was dissolved in n-pentane and analyzed with an Agilent 7000C GC/MS(triple quadrupole)with the ion source temperature of 250 °C and ionizing energy of 70 eV.The column used in this study is a 30 m long DB-5 (5% Phenyl Methyl Siloxane) with 250 μm inner diameter and 0.25 μm film thickness.Starting temperature is 80 °C and held for 3 min.The column temperature is heated from 80 to 310 °C at 4 °C/min and held for 30 min at 310 °C.The total analysis time is 90 min.Chromatograms were acquired in scanning:35–700 molecular weight and selected-ion-monitored (SIM) for compound identification and integration.The distribution of organic compounds in the bitumen extracts was monitored by fragmentograms of n-alkane (m/z 85),terpanes and hopanes (m/z 191),and steranes(m/z 217).Details of the analytical procedure used are summarized in Moustafa and Morsi (2012).
In addition,to avoid the possible sources of analytical errors such as contamination,measurement errors and mechanical/instrumental errors on the GC–MS results,a cautious procedure was needed in order to minimize these errors(Akande 2012).For example in this study,a fraction needed to be at high concentration and re-run using selected ion monitoring (SIM) mode to enhance the signal to noise ratio.
4 Results and discussions
4.1 Source rock characterization
The source rock quantification was the issue of prior consideration,then investigating the quality of source rock followed.In addition,the quality of organic carbon is used to define source rock potential and to specify the origin of organic matter,due to the fact that different organic matter types can generate different petroleum products (e.g.oil and/or gas).A diagnostic depositional environment was also used to confirm the source of organic matter by using biomarker identification.
The bitumen(or EOM)contents of pulverized rock from the study area was extracted in range of 76.84–197.65 ppm,the highest content appeared on the carbonate rock sample from CD-1/1.On the other hand,the lowest was the shale sample from NP-1/3 (Table 1).The average bitumen content of the samples in this study was 118.67 ppm.The bitumen contents of the study area are less than 500 ppm suggesting a poor potential source rock at present-day based on Peters and Cassa (1994).
The TOC values vary with locations as presented in Table 1.The average TOC value of the Tak Fa Formation is 2.63 wt%,with a range of 1.42–4.58 wt%.The samples can be classified as good to excellent hydrocarbon potential at present-day by TOC contents based on Peters and Cassa(1994).In addition,the northern part of the study area exhibits high TOC values.The TOC values of the samples of the northern part were relatively high compared to the south,whereas low TOC values were recorded in shale samples at Nong Phai area.
These results indicate that TOC generally exceeds the kerogen threshold of 0.2 wt% for limestone and 0.5 wt%for shale necessary for a generation of hydrocarbon(Tissot and Welte 1984),however,EOM point out in a different direction than the Tak Fa Formation in this area which is a poor potential source.It should be noted that TOC contents can be only used to determine the amount of organic matter in sedimentary rock.TOC analysis cannot be used to represent types and origins of organic matter that caused misinterpretation a hydrocarbon potential source rock.Thus,other parameters are used to support organic facies and origin of the source rock in this study area to confirm the organic matter type.
S1and S2values of samples in this study area were relatively very low;S1ranging from 0.01 to 0.07 mg HC/g rock and S2ranging from 0.00 to 0.50 mg HC/g rock.The highest values were recorded in the northern part of the study area,where the TOC values were also high(Table 1).The highest S2value was 0.50 mg HC/g rock recorded at Nong Phai area (NP-1/1).Genetic potential is the amount of hydrocarbon that can be generated and remain in source rock by summation of S1and S2.All samples in this study fall into the poor zone (S1+S2<2 mg HC/g rock) indicating a low hydrocarbon potential source rock at presentday based on Peters and Cassa (1994).Generally,source rocks with S2values less than 4.0 mg HC/g rock are considered to have poor genetic potential,while yields greater than 4.0 are common in known hydrocarbon source rocks.However,Erik (2016) documented that if an S2value is less than 0.2 mg HC/g rock;pyrolysis data are not reliable.Possibly,the low values of S1and S2in this study area can partly be due to advance thermal maturity,highly weathering,and complex tectonic history,which would lead to the reduction in S1and S2values.
The TOC variation between the rock samples of the northern part and the southern part of the Tak Fa Formation can be explained through sedimentary conditions.The relatively low organic-matter content of the southern part of the Tak Fa Formation is probably due to its deposition under well-oxygenated conditions or due to the dilution effect caused by clastic sediment supply (e.g.Alkhafaji et al.2015).Less favorable preservation of organic matter and stronger clastic input may lead to the formation of organic-lean sediments as well as land plant materials and oxidized materials at near-shore environments.
4.2 Quality of organic carbon (kerogen classification)
Types of organic matters can be defined by the coherence of pyrolysis parameters and TOC contents for converting to hydrogen index (HI) and oxygen index (OI) contents and used to plot in Pseudo Van-Krevelen diagram.Moreover,the relevance of HI and OI depends on a prototype of organic matter and condition for preserving organic matter.High HI content shows that organic matter is deposited under anoxic condition,while high OI content is usually related to oxidized organic matter.The relationship of HI and OI is used to define the type of organic matter or kerogen type including kerogen type I,II,and III.Moreover,when organic matter overmatures or biodegrades from microbes,it turns into kerogen type IV as non-potential hydrocarbon generation which mostly consists of a nitrogen,sulfur,and oxygen-rich molecular structure(Tissot and Welte 1984).
The HI values from this study range from 0 to 32 mg/g TOC,with an average of 5.6 mg/g TOC (Table 1).The highest values are recorded in the northern part of the study area (shale NP-1/2).The HI values of this study indicate that the Tak Fa Formation has poor hydrocarbon generation potential at present-day based on Peters (1986).However,HI can be reduced with increasing maturity.Therefore,it is believed that the low HI values of the Tak Fa samples from this study are partly caused by a higher level of thermal maturity.This is supported by the plot between HI and Tmax (Fig.2a).
Kerogen types of the Tak Fa Formation in this study were determined using the Pseudo Van-Krevelen diagram(Fig.2b).The studied samples fall into the corner of the diagram due to low HI and low OI.This makes it hard to interpret the source of the organic matter of the formation.The organic matter of the samples from the Tak Fa Formation consists of type IV kerogen.In addition,type IV kerogen is usually derived from oxidized terrestrial plants or reworked from other sources (Tissot and Welte 1984),which was strongly degraded,either during deposition or during thermal maturation leading to the reduction in HI values.From Fig.2b,the Pseudo Van-Krevelen diagram is seemingly unqualified for kerogen classification from this study by low HI and OI.Thus,isoprenoid/n-alkane is used for kerogen classification for organic matter by using pristane (Pr)/n-C17and phytane (Ph)/n-C18diagram (e.g.Shanmugam 1985; Sachse et al.2011; Alkhafaji et al.2015).The diagram shows that organic matter from the studied samples of the Tak Fa Formation are originally from type II and III kerogens (Fig.3).Furthermore,Pr/n-C17and Ph/n-C18ratios are usually used as indicators of depositional environments,approximate organic matter maturation,and level of biodegradation(Peters et al.2007).
4.3 Molecular geochemistry
The study of the organic matter inputs and depositional condition of this study area is complicated due to the fact that TOC and pyrolysis data are poor,possibly due to strong maturation.In this study,the prototype of the organic matter and the depositional condition was determined using alternative tools such as non-biomarker and biomarker parameters.
4.3.1 n-alkanes and isoprenoids
The gas chromatograms of saturated hydrocarbon fractions from hydrocarbon samples are shown in Fig.4 and derived parameters are listed in Table 2.The saturated gas chromatograms of these samples display a full suite of saturated hydrocarbons between C15–C34n-alkanes and isoprenoids,pristane (Pr),and phytane (Ph).The distribution of nalkanes can be used to indicate the prototype of an organic matter source.Short-chain n-alkanes (lower than C20) are characteristic of microbial input.In addition,middle chain n-alkanes(C11–C20)are considered to indicate algal and/or bacterial origin for the organic materials.Long-chain nalkanes (more than C20),high boiling point n-alkane,are commonly attributed to the contribution of terrestrial waxes,especially in the C25-C33range (Peters and Moldowan 1993).

Fig.2 a A range of thermal maturity of the samples based on HI and Tmax relationship.b Classification of the kerogen types by hydrogen index versus oxygen index based on Pseudo Van-Krevelen diagram of the organic matters of the Tak Fa Formation

Fig.3 Plot of pristane/n-C17 (Pr/n-C17) versus phytane/n-C18 (Ph/n-C18) for the samples from the Tak Fa Formation
The distribution patterns of n-alkanes from both northern and southern parts of the study area suggest that the organic materials are derived from different sources.The nalkane distribution of the southern area (BP) shows a mixed source of organic materials.A predominance of medium to long molecular weight compounds(nC24–nC30)suggests a significant high contribution of terrigenous organic matter with minor marine organic matter contribution in two studied sample,others two studied samples exhibit a predominance of short molecular weight compounds (nC15–nC18) suggesting algal and microorganism inputs (Tissot et al.1978; Murray and Boreham 1992).Similar to the northern area (CD and NP),the n-alkane distribution also shows a mixed source of organic materials.Thus,the sources of organic matters in the study area are more likely to be a mixed source of depositional environment.
Isoprenoids occur in a significant amount in all studied samples,and diagnostic biomarker ratios are listed in Table 3.Pristane (C19H40) and phytane (C20H42) are regular isoprenoid hydrocarbons,which both were derived from the phytol side chain of the chlorophyll molecule(Miles 1989).The phytol can be transformed into pristane or phytane depending on the depositional environment.The pristane/phytane(Pr/Ph)ratio is one of the most commonly used geochemical parameters to indicate the redox conditions in the depositional environment and source of organic matter (Powell 1988; Chandra et al.1994; Large and Gize 1996).High Pr/Ph values (>3.0) indicates oxic conditions often associated with terrigenous organic matter input,while low values (<1.0) typify anoxic conditions,commonly hypersaline or carbonate environments(Peters et al.1995,2005) and values between 1.0 and 3.0 suggest intermediate conditions (suboxic conditions) (Amane and Hideki 1997).In addition,Lijmbach (1975) divided Pr/Ph ratios into three groups including (1) ratio lower than 2 indicating reducing-aquatic deposition (including marine,fresh water,and brackish water),(2) intermediate ratios 2–4 indicating fluvio-marine and coastal swamp deposits,and (3) ratio more than 4 indicating peat swamp in an oxidizing environment.
In this study,pristane occurs in relatively high concentrations,possessing Pr/Ph ratios in the range of 1.26–15.10(Table 3) suggest that the studied samples are considered to be derived from source rock contain mixed organic facies and suboxic to oxic depositional conditions (e.g.Peters and Moldowan 1993;Hakimi et al.2012).Thus,the sources of organic matters in the study area are more likely to be a mixed source of depositional environment.
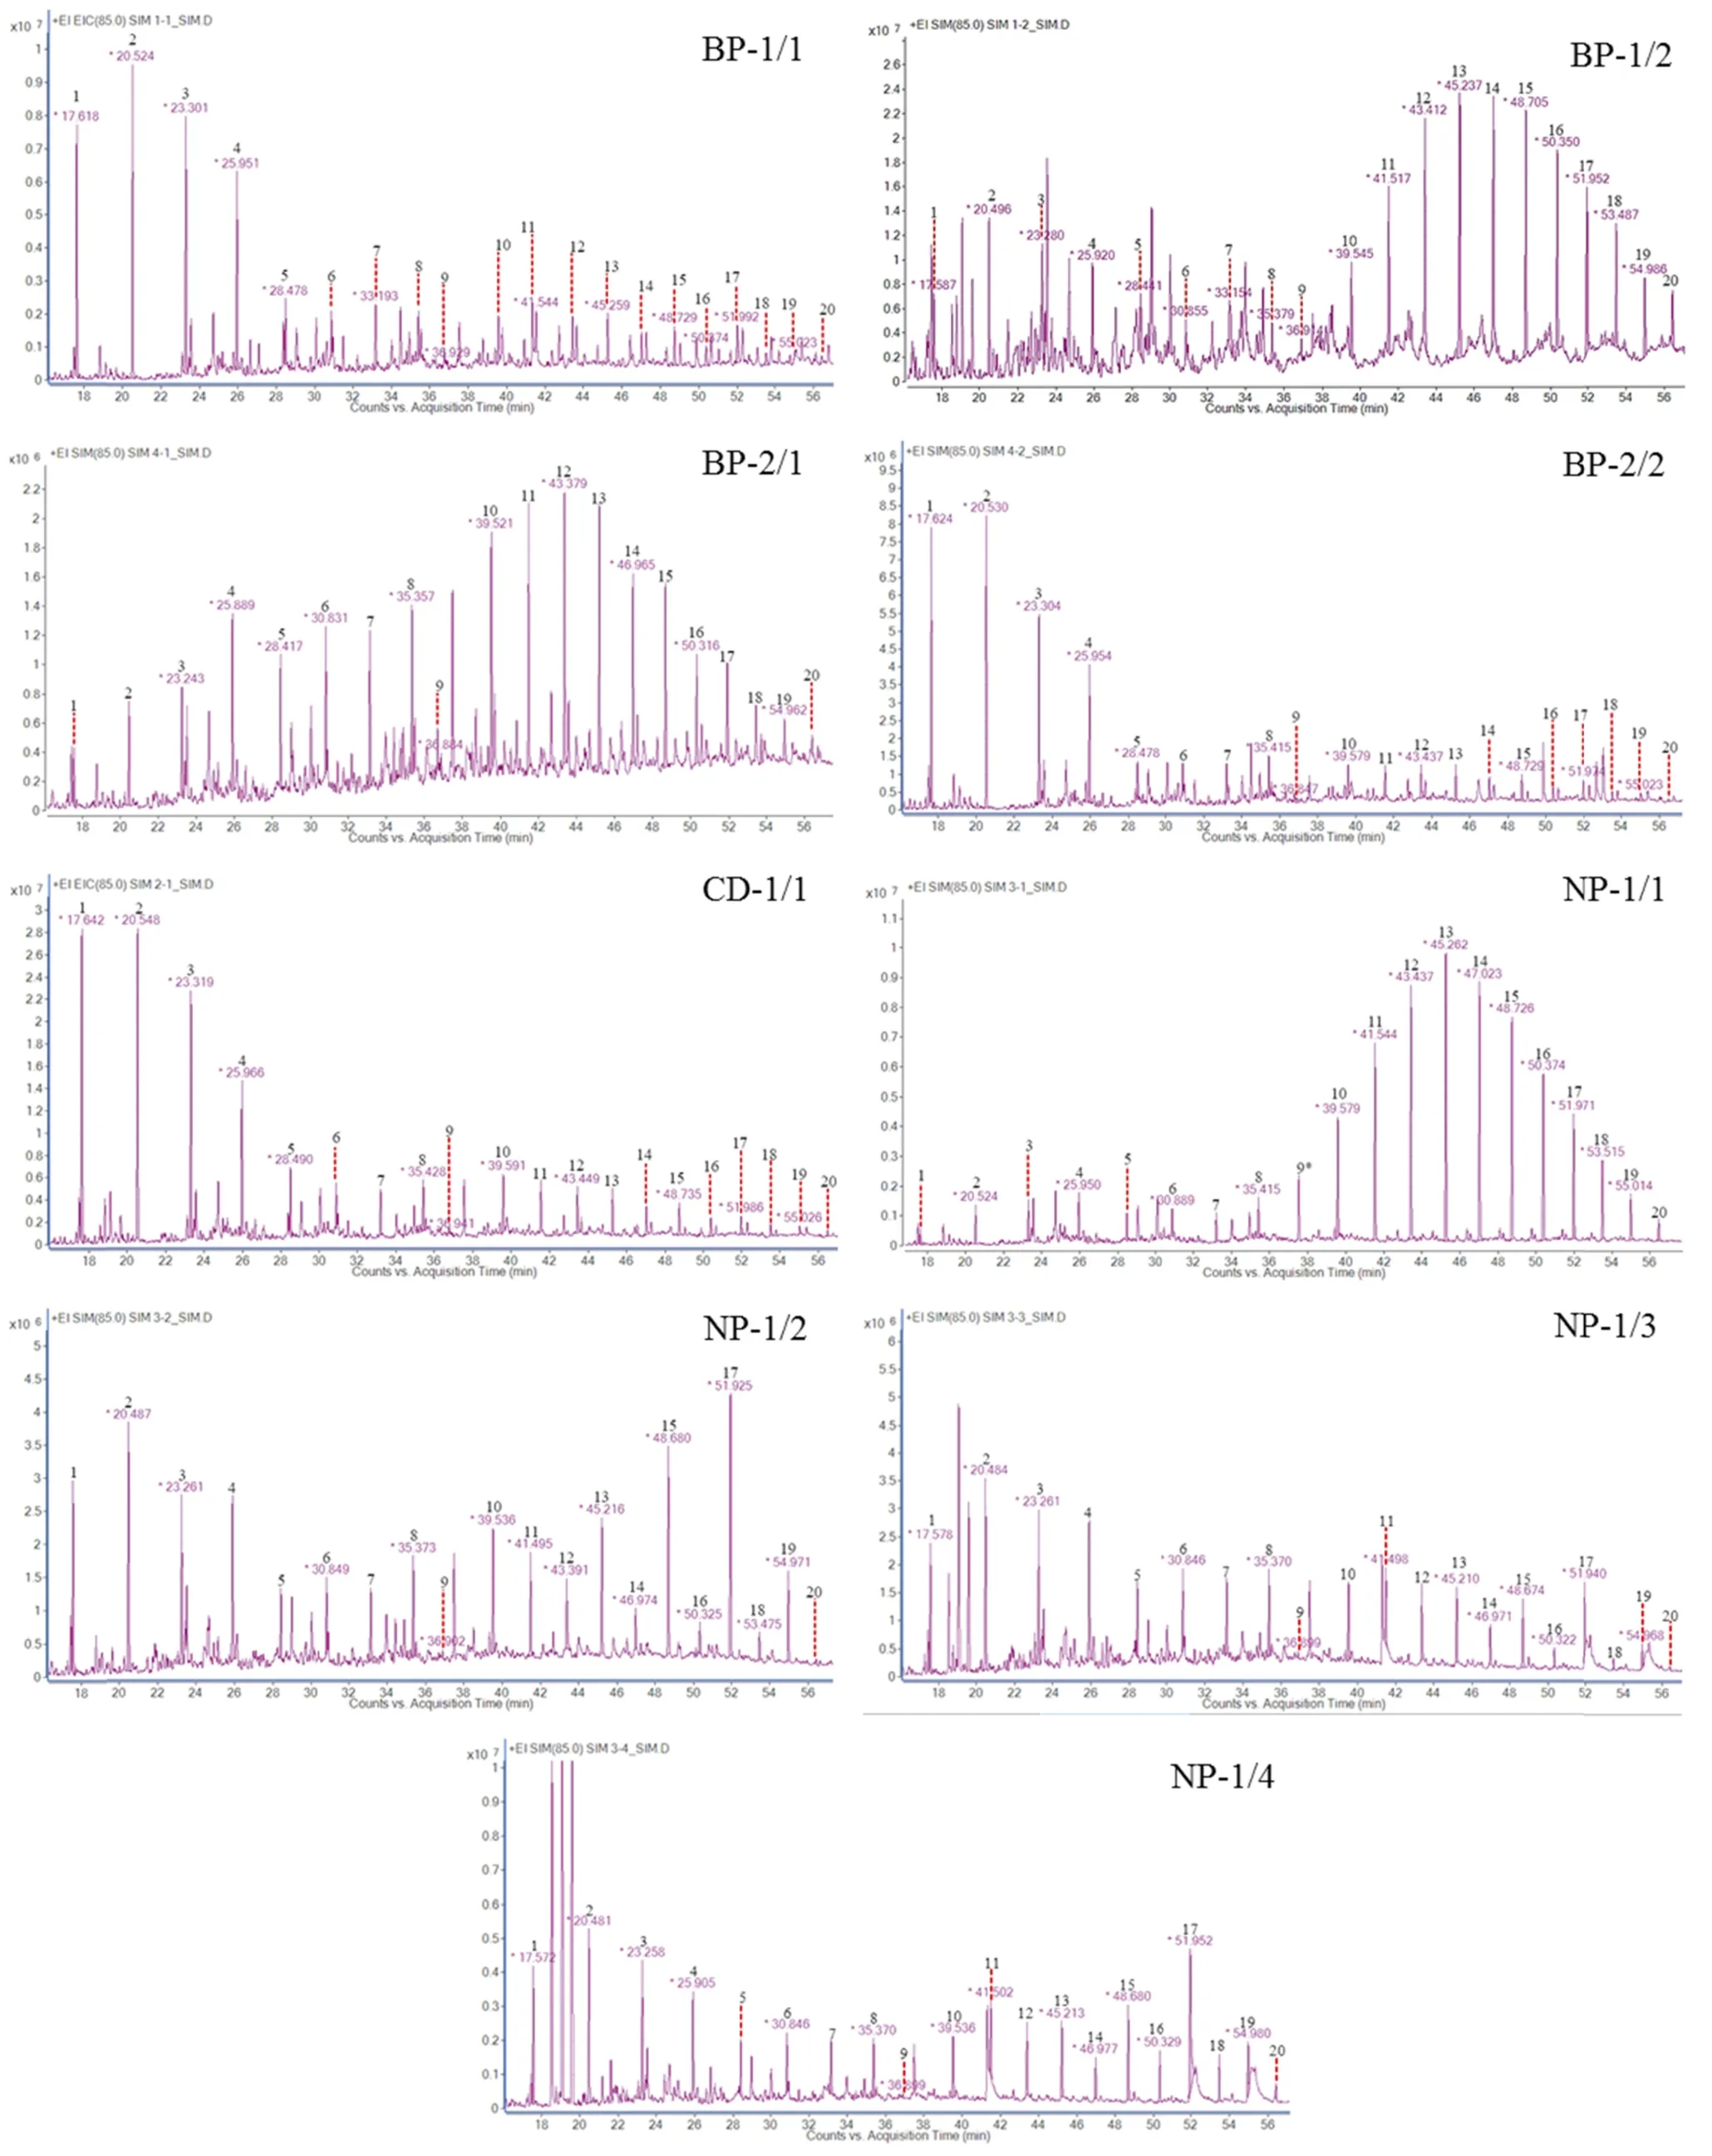
Fig.4 The gas chromatogram of saturated hydrocarbon by selected-ion monitoring(SIM)at 85 m/z of the samples from the Tak Fa Formation
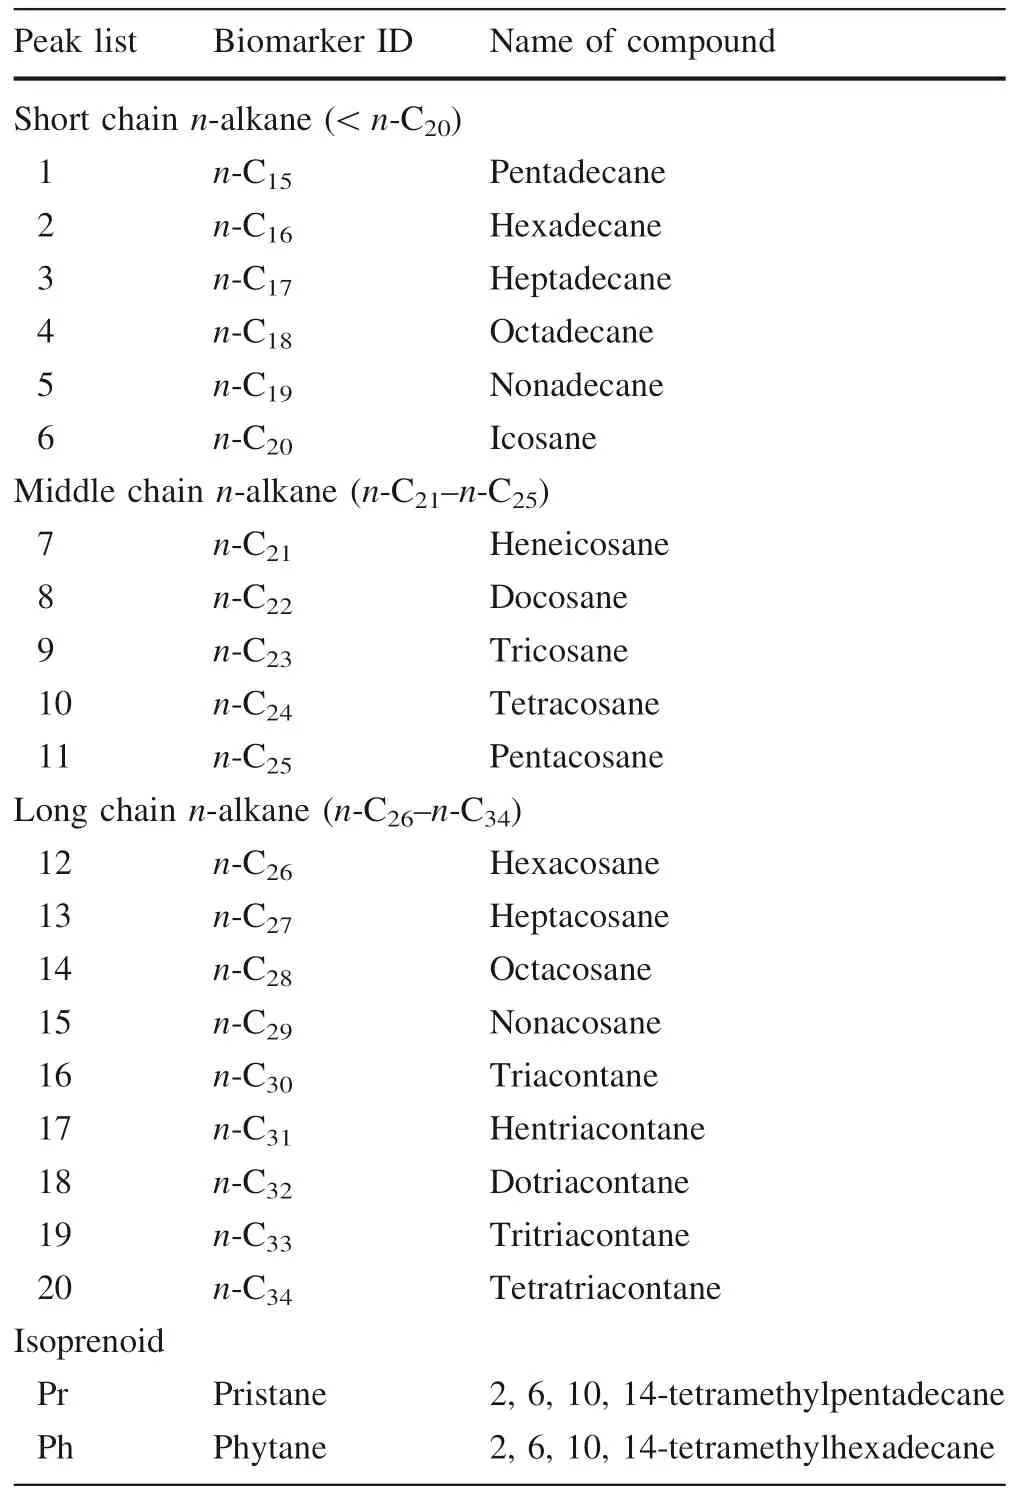
Table 2 Short,middle,and long chain n-alkane peaks identification by SIM 85 m/z
4.3.2 Steranes and terpanes
The distributions of steranes and terpanes are commonly studied using GC–MS by monitoring the ions m/z 217 and m/z 191,respectively(Peters et al.2005).The examples of Terpanes (m/z 191) and steranes (m/z 217) from the study area are presented in Figs.5 and 6,respectively,and derived parameters are listed in Table 4.
The distributions of diasterane and the sterane(C27,C28,and C29) are characterized by the m/z 217 ion chromatograms and are used to indicate organic matter input.Relative abundances of C27,C28,and C29regular steranes are calculated and the results are given in Table 3.C29steranes are predominantly in terrestrial higher plants and brown and green algae; C28steranes are predominantly from yeast,fungi,plankton,and algae; C27steranes are mainly from marine plankton (Volkman 1986,2003).However,microalgae or cyanobacteria can also be an important source of C29steranes.On the other hand,the presence of higher C27steranes content suggests a marineinfluenced system from micro-plankton and micro-marine algae.In addition,some C28and C27steranes may derive from freshwater plankton and/or algae (Volkman and Maxwell 1986).Thus,the relative abundance of C27,C28,and C29steranes from this study was converted to a percentage and plotted in a ternary diagram (Fig.7).The regular steranes contents of all the samples from the Tak Fa Formation are generally similar distributions in the diagram.These similar distributions may also reveal genetic associations that the studied samples possibly derived from similar types of organic matter or similar depositional environments.The samples display a mixed regularsteranes which is an indicator of the mixed marine/terrigenous organic matters(Fig.7).This is also supported by Pr/n-C17and Ph/n-C18ratios (Fig.3).

Table 3 The geochemical results and biomarker ratios of saturated hydrocarbon of the samples from the Tak Fa Formation
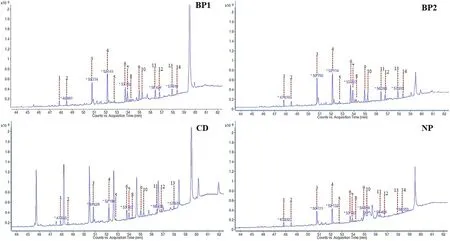
Fig.5 Pentacyclic terpanes (m/z 191) from the study area

Fig.6 Regular steranes (m/z 217) from the study area
The regular steranes distribution of the Tak Fa samples in this study indicates an estuarine environment (Fig.7).The summarized relative abundance of C27,C28,and C29regular steranes is 33.88,38.89,and 27.22%,respectively(Table 3).It reveals the C28steranes are slightly higher than concentrations of C27or C29steranes (C27<C28->C29).The predominance of C27and C28steranes in studied samples is interpreted as a marine environment with minor freshwater organisms.However,a significant presence of C29steranes in all samples is interpreted that terrestrial input was an influencing factor as it is typically associated with land plants in this study area (Volkman et al.1986).Thus,it seems likely that there is a mixed source of organic matter within this study between marine and terrestrial sources.The transitional zone of the depositional environment is determined in samples by an increased ratio of C27and C28regular steranes relative to C29steranes.

Table 4 Pentacyclic terpanes and regular steranes peaks identification

Fig.7 Ternary diagram of relative abundance of C27,C28,C29 regular steranes shows the sources and depositional environment of the sample from the Tak Fa Formation
4.4 Thermal maturation
In this study,a variety of biomarker maturity indicators have been used to evaluate the level of thermal maturity including gammacerane index and sterane isomer ratios(Table 3).Tmax can also be used to evaluate the maturity level of organic matter.In addition,Tmax can be combined with PI to consider and confirm the maturity level of organic matter (i.g.Hatampour 2014; Adelzadeh et al.2014).The studied samples range in late to over-mature stage from PI and Tmax cross plot providing source rock maturation level (Fig.8).
4.4.1 C3122S/(22S+22R) homohopane isomerization ratio
Homohopane isomerization ratio is used as a maturity indicator.It is measured from the m/z 191 mass chromatogram by SIM mode.22S/(22S+22R) homohopane ratio describes the isomerization conversion of the biological 22R to the geological 22S configuration of homohopane molecules,so this ratio has range 0 to around 0.6 at equilibrium during maturation.The ratio values ranging from 0.50 to 0.54 show maturity of organic matter almost reached to oil generation and the ratios from 0.57 to 0.62 indicate that the oil window has been reached (Moldowan et al.1986).
C3122S/(22S+22R) homohopane isomerization ratios of the study area have values ranging from 0.58 to 0.61(Table 3).These ratios suggest that organic matters in this study have been reached a mature stage,except for the sample NP-1/2 with 0.30 indicating immature source rock.These C3122S/(22S+22R) homohopane isomerization ratio results of the Tak Fa Formation samples are consistent with Tmax from pyrolysis data indicating that most samples have been reached an over mature level.
4.4.2 Ts/(Ts+Tm)
Ts(C2718α(H)-22,29,30-trisnorneohopanes)and Tm(C2717α(H)-22,29,30-trisnorhopane)ratios are used for the Ts/(Ts+Tm) unit and can be measured from m/z 191 mass chromatogram by SIM mode.This ratio can also be used as thermal maturation and lithology of the source rocks(Moldowan et al.1985).During catagenesis of petroleum generation,Tm is less stable than Ts (Seifert and Moldowan 1986).Organic source rock is mature when the values of the Ts/(Ts+Tm) ratio are between 0.35 and 0.95(Peters et al.2007).In addition,the Ts/Ts+Tm ratio may also be influenced by variation in lithology,in which carbonate petroleum source rocks are significantly lower than clay-rich siliclastic source rocks (Waples and Machihara 1991; Peters and Moldowan 1993).The studied samples contain a mixture of land and marine-derived organic matter; thus,the variation of Ts/Tm ratios appear to be more strongly influenced by maturity instead of the source input.The Ts/(Ts+Tm)ratios from this study range from 0.46 to 0.65 with a mean value of 0.56 indicating that the organic matter is in a mature stage.The result of Ts/(Ts+Tm) ratios in this study coincide with Tmax data.

Fig.8 PI and Tmax cross plot provides source rock maturation level of the sample from the Tak Fa Formation
4.4.3 Moretane/(hopane+moretane) ratio
The ratio of 17β (H),21α (H)-moretanes and 17α (H),21β(H)-hopanes are used as a thermal maturation indicator by using the moretane/(hopane+moretane) ratio and can be measured by m/z 191 mass chromatogram by SIM mode.Moretanes are less stable than hopanes under thermal condition,and the abundance of moretanes decreases relative to the corresponding hopanes with increasing thermal maturity.Thus,the ratio of moretane to their corresponding hopanes decreases with increasing thermal maturity,from about 0.8 in immature sediments to about 0.15–0.05 in mature source rocks and oils (Mackenzie et al.1981; Seifert and Moldowan 1986).The C29and C30compounds are used for the moretane/(hopane+moretane) ratio (Peters et al.2007).
Moretane/(hopane+moretane) ratios from this study range from 0.09 to 0.74 with a mean value of 0.18 indicating that the samples in this study have been reached at mature stage.In addition,moretane/(hopane+moretane)ratios and all sterane isomerization ratios of the Tak Fa Formation from this study are consistent.
4.5 Paleoenvironment characteristics
Biomarker analysis of soluble organic matter in the rock samples has contributed to a better understanding of the characteristics of the depositional environment of the area(e.g.Waples and Machihara 1991; Sivan et al.2008).In this study,organic facies and depositional environment are interpreted using pristane/phytane ratios,terpane (m/z 191),and sterane(m/z 217)distributions.In addition,nonbiomarker parameters such as n-alkane,isoprenoid,Pr/Ph,Pr/n-C17and Ph/n-C18,can be used to identify the source of organic matter and depositional environment (e.g.Shanmugam 1985).
The samples from the Tak Fa Formation have similar nalkane isoprenoid,sterane,and terpane distributions both in the north and south of the study area and thus similar in depositional environment,organic matter type and maturity.In gas chromatograms of the studied samples,dominant n-alkanes suggest the influence of terrestrial and marine organic matter input,indicating a mixed source of depositional environment.
17α (H)-homohopane ratios are essential as a paleoclimate indicator (Waples and Machihara 1991).A decrease in the C31–C35extended hopanes reflect a clastic facies,and the C3122S/(22S+22R) homohopane ratio can be correlated with peat and coal (e.g.Villar et al.1988).The C31homohopane/C30hopane ratio can be used to distinguish between marine and lacustrine source rock environments(Table 3).This ratio is generally higher than 0.25 for marine environments and lower than 0.25 for lacustrine environments (Peters et al.2007).In this study,the C31homohopane/C30hopane ratio was relatively high in most of the studied samples,except sample (NP-1/3 with 0.21)from the Nong Phai area (Table 3).
Gammacerane is C30pentacyclic triterpene can be measured in m/z 191 mass chromatogram by SIM mode.Gammacerane is eluted after C31homohopane 22S and 22R doublet.Gammacerane indicates a stratified water column in marine and non-marine depositional environments and is associated with increasing salinity of the depositional environment (Peters and Moldowan 1993).The gammacerane index is shown as the ratio of gammacerane/(gammacerane+C30αβ-hopane).All samples from the Tak Fa Formation in this study have gammacerane index ranging from 0.1 to 0.67,thus,the organic matter source of the Tak Fa Formation is from saline water environment.
On the basis of these data,the studied rock samples are believed to have been deposited in a lagoonal/estuarine environment which was periodically influenced by marine and fresh-water conditions at a nearshore area.Evidence includes the common evaporitic textures (Fig.9) and high gammacerane index values (Table 3).These observations suggest a shallow,stratified,evaporative (saline) facies association in which organic matter was deposited and preserved.Chitnarin et al.(2008)suggested that the Tak Fa Formation in Bueng Sam Phan area is a shallow marine,euryhaline,nearshore environment.Similarly to this study,the geochemical analysis indicated a estuarine environment by C27,C28,C29regular steranes.The estuarine environment is in a transitional zone,that is,a transition from fresh to saline water.Organic facies are confirmed by a bivariate plot between Pr/n-C17and Ph/n-C18as shown in Fig.3.The observed organic sedimentary rocks from this study were possibly deposited in restricted lagoonal marine conditions or back-reef environment.
It should be noted that highly weathering can cause a significant decrease of TOC,the bulk composition of organic matter,as well as changes in carbonate content,extract yields and percentage yields of organic fractions and could significantly influence paleoenvironmental,source and maturity interpretations (Littke et al.1991;Marynowski et al.2011).Thus,unknown paleoweathering history of the area may affect the interpretation of this study area.

Fig.9 The polygonal evaporitic texture in argillaceous limestone form BP-2 as indicator of high evaporate conditions at near shore area
4.6 Source rock potential
Subtropical arid climatic conditions during the Tak Fa deposition and restricted lagoonal carbonate platforms could have enhanced the accumulation of organic carbon through the increased production of phytoplankton and terrestrial sediment input,leading to enhanced bacterial organic matter accumulation on the subtidal platform slopes and in intertidal lagoons.The TOC values in this area are relatively high compared to general shallow marine carbonates,and this is possibly the result of low to moderate energy,restricted water condition,and a suboxic to oxic environment,so that organic matter can be preserved in the sediments.However,geochemical data from this study suggest that organic matters are originally type II and III kerogens which suggest more gas-prone generation.These organic matters exhibit highly maturation through complex tectonic events of the area.
Moreover,a subtropical arid climate in super tidal environment favors the development of microbial mats or algae mats with relatively high organic-rich layers,especially where hypersalinity has inhibited the activity of burrowers and a scavenging benthos (Gerdes et al.1991).The productivity of these algae mats could have been amplified by their impact on the anoxic-suboxic conditions in the water column at restricted lagoonal facies in the study area.
Based on these interpretations,we suggest that the development of organic-rich carbonate lagoonal environments like this area can be regarded as a useful source rock.For instance,the organic matter value in the intertidal hypersaline carbonate lagoons of Abu Dhabi can be ranged between 1 and 2.7% (Kenig et al.1990).Thus,the Tak Fa Formation can be a hydrocarbon source rock of the area during the time of deposition.Although the geochemical data in this study indicate that the Tak Fa Formation has experienced high maturation,one or more locations could meet a condition that places this formation to be an active source rock.The close association of this organic-rich formation,with good reservoir facies confined to carbonate platform margins,could create an excellent petroleum system in the area.The approach and concepts presented here can be applied to similar evaporite-carbonate deposits in Thailand to find more petroleum basins.
5 Conclusions
The study of organic geochemical investigations of the Tak Fa Formation from this study leads to the conclusion that this formation has high TOC values(more than 2.0 wt%in carbonate rock and more than 5.0 wt% in shale),but the rock samples in the study area have experienced highly maturation at the present day as indicated by Tmax and biomarkers.Considering S1and S2hydrocarbon values,the samples show low values that can partly be due to high thermal maturity,large amounts of weathering,and complex tectonic history,which would lead to the reduction in S1and S2values.In this study,Tmax and biomarker data suggest that the reduction of S1and S2values are more likely due to high thermal maturity.Thus,pyrolysis data are not useful for source rock assessments from outcrop sample in the study area.Kerogen classification can be based on a non-biomarker study for outcrop sample instead.The bivariate non-biomarker plot,Pr/n-C17and Ph/n-C18,form this study indicates that organic matter originally comes from type II/III kerogen.
The depositional environment of organic matter of the Tak Fa Formation in this study area is interpreted to be a estuarine environment or a restricted lagoonal carbonate platforms based on C27,C28,and C29regular steranes occurrence.Thus,the Tak Fa Formation is considered to be a hydrocarbon source rock of the area during the time of the deposition.Although the geochemical data in this study indicate that the Tak Fa Formation has experienced high maturation,one or more locations could meet a condition that places this formation to be an active source rock.The approach and concepts presented in this study can be applied to similar evaporite-carbonate deposits in Thailand to find more petroleum plays.
AcknowledgementsThe authors gratefully acknowledge the financial support from the Ratchadaphisek Somphot Endowment Fund under Outstanding Research Performance Program,Science Super III(Department)-009,Chulalongkorn University.Anonymous reviewers are thanked for their useful and constructive comments.
杂志排行

Acta Geochimica的其它文章
- In-situ nitrogen fate in the vadose zone of different soil types and its implications for groundwater quality in the Huaihe River Basin,China
- Mantle plume:the dynamic setting of the origin of Early Paleozoic mafic dykes in Ziyang,Shaanxi Province,Southern Qinling Block,China
- Using Sr isotopes to trace the geographic origins of Chinese mitten crabs
- Geochemical characteristics and origin of the Neoproterozoic high-K calc-alkaline granitoids in the northern part of Mandara hills,northeastern Nigeria
- A re-assessment of nickel-doping method in iron isotope analysis on rock samples using multi-collector inductively coupled plasma mass spectrometry
- Trace elemental signatures and mineral chemistry of clays associated with the alteration halos of the Paleoproterozoic U mineralization in Bijawars of the Sonrai Basin,Central India