Transition to forefoot strike reduces load rates more effectively than altered cadence
2020-06-10ErinFutrllDouglasGrossDaryRismanDaviMullinauxIrnDavis
Erin E.Futrll *,K.Douglas Gross ,Dary Risman ,Davi R.Mullinaux ,Irn S.Davis
a Department of Physical Therapy,Springfield College,Springfield,MA 01109,USA
b Spaulding National Running Center,Harvard Medical School,Cambridge,MA 02138,USA
c Department of Physical Therapy,MGH Institute of Health Professions,Boston,MA 02129,USA
d Department of Physical Therapy,University of Delaware,Newark,DE 19713,USA
e School of Sport and Exercise Science,University of Lincoln,Brayford Pool,Lincoln,Lincolnshire,Brayford Pool,LN6 7TS,UK
f Department of Physical Medicine and Rehabilitation,Harvard Medical School,Boston,MA 02115,USA
Abstract Background:Excessive vertical impacts at landing are associated with common running injuries.Two primary gait-retraining interventions aimed at reducing impact forces are transition to forefoot strike and increasing cadence.The objective of this study was to compare the shortand long-term effects of 2 gait-retraining interventions aimed at reducing landing impacts.Methods:A total of 39 healthy recreational runners using a rearfoot strike and a cadence of ≤170 steps/min were randomized into cadence(CAD)or forefoot strike(FFS)groups.All participants performed 4 weeks of strengthening followed by 8 sessions of gait-retraining using auditory feedback.Vertical average load rates(VALR)and vertical instantaneous load rates(VILR)were calculated from the vertical ground reaction force curve.Both cadence and foot strike angle were measured using 3D motion analysis and an instrumented treadmill at baseline and at 1 week,1 month,and 6 months post retraining.Results:ANOVA revealed that the FFS group had significant reductions in VALR(49.7%)and VILR(41.7%),and changes were maintained long term.Foot strike angle in the FFS group changed from 14.2˚dorsiflexion at baseline to 3.4˚plantarflexion,with changes maintained long term.The CAD group exhibited significant reduction only in VALR(16%)and only at 6 months.Both groups had significant and similar increases in cadence at all follow-ups(CAD,+7.2%to 173 steps/min;and FFS,+6.1%to 172 steps/min).Conclusion:Forefoot strike gait-retraining resulted in significantly greater reductions in VALR and similar increases in cadence compared to cadence gait-retraining in the short and long term.Cadence gait-retraining resulted in small reductions in VALR at only the 6-month follow-up.2095-2546/©2020 Published by Elsevier B.V.on behalf of Shanghai University of Sport.This is an open access article under the CC BY-NC-ND license.(http://creativecommons.org/licenses/by-nc-nd/4.0/).
Keywords:Foot strike;Gait-retraining;Physical therapy;Running;Step rate
1.Introduction
Impact mechanics during running have received much attention in recent literature due to their reported relationship to injury.Impacts are highly related to the manner in which the foot interacts with the ground.It has been reported that up to 95%of runners in conventional shoes land with a rearfoot strike(RFS)pattern.1,2This pattern results in a distinct impact peak of the vertical ground reaction force early in stance.3-6This impact peak is associated with high rates of loading.High load rates during running have been found to be related to a variety of overuse musculoskeletal injuries.3-5This association of load rates with running injuries has led to the development of interventions aimed at retraining gait to reduce landing impacts.7-11
Two primary retraining techniques have emerged to reduce excessive running impacts. The first involves increasing cadence, or number of steps per minute, typically by 5%-10%.For a given speed,this is done by reducing the stride length.Increasing cadence by 7.5%has been shown,in an uncontrolled study,to reduce vertical load rates by 19%.8However,increasing cadence does not typically result in a change in foot strike pattern.12
The second type of retraining involves landing on the ball of the foot,or using a forefoot strike(FFS)pattern.Unlike an RFS pattern,an FFS pattern does not result in an impact transient that is associated with high rates of loading.In fact,the load rates associated with a habitual FFS pattern are approximately 35%-45%lower than that of a habitual RFS pattern.13Transition to an FFS pattern has been associated with a 35%-65%reduction in vertical load rates.7,14
It has been suggested that RFS runners should have cushioning under their heels to attenuate some of their impact.15FFS runners habituated to conventional cushioned shoes have exhibited greater resultant load rates than FFS runners habituated to minimally cushioned shoes.16This is due to the greater posterior and medial load rates exhibited by FFS runners using conventional cushioned shoes.The additional heel height and sole flares likely contribute to these increases.Therefore,it has been recommended that transitioning to an FFS pattern is best done with minimally cushioned footwear.17It has also been suggested that minimal footwear encourages an FFS pattern because it is usually uncomfortable to land on the heel without cushioning.However,some runners continue to land on their heels in minimal shoes.18Therefore,it has been recommended that gait-retraining and minimal footwear be implemented together if an FFS pattern is desired.19
Learning a new motor pattern such as running gait requires the ability to detect error.20The RFS and FFS patterns have very different initial kinematics at the ankle.21An RFS pattern is associated with dorsiflexion at ground contact,while an FFS pattern is associated with plantarflexion at ground contact.The larger difference in foot and ankle mechanics may provide the runner with greater ability to detect error than a small increase in cadence.12With greater ability to detect error,the motor pattern of FFS may be better retained than an increase in cadence.
Despite positive short-term changes,gait-retraining is only meaningful if it can be maintained over time.There have been numerous reports of successful gait-retraining programs.9,10,22-24However,most of these studies had relatively short follow-up periods,with only 2 extending beyond 3 months.10,24There are no long-term follow-up studies of either cadence or FFS retraining.Maintaining a pattern over time also indicates that learning has occurred.20However,runners may intentionally produce the desired gait pattern during assessments,making it difficult to discern if motor learning and retention has truly occurred.Thus,it may be useful to distract runners from their gait pattern while analyzing the effects of gait-retraining.
The purpose of this investigation was to compare the shortand long-term effects of gait-retraining on vertical load rates when either increasing running cadence or when transitioning to an FFS gait pattern.With retraining,we expected that both groups would increase their cadence,but the cadence retraining group(CAD)would increase more,and only the FFS retraining group would change foot angle.It was hypothesized that both groups would demonstrate reduced load rates,but the FFS group would exhibit the greatest reduction.It was also hypothesized that changes in mechanics and load rates would be better maintained over the long term in the FFS group compared with the CAD group.
2.Methods
2.1.Participants
All activities took place at the Spaulding National Running Center in Cambridge,Massachusetts.An a priori analysis based on expected change in load rates indicated that 14 subjects per group would be necessary to adequately power the study(α=0.05,β=0.90,Cohen’s d=0.7).To allow for 15%attrition,17 subjects were targeted per group.Runners were recruited from the community with paper and digital advertisements.To be included,participants had to be recreational runners who ran an average distance of 8.0-24.1 km/week in conventional cushioned shoes,with no running-related injury in the previous 90 days.The definition of“injury”was any running-related musculoskeletal pain in the lower limbs that caused a restriction on or stoppage of running(distance,speed,duration,or training)for at least seven days or three consecutive runs,or that required the runner to consult a health professional.25Additionally,runners with a history of stress fracture to the foot or ankle were excluded because these individuals typically need a longer time to adapt to retraining than was allotted for this investigation.26Those who met the initial inclusion criteria signed an informed written consent statement that was approved by the Partners Human Research Committee Institution Review Board.Participants next underwent an initial screening on a treadmill at their self-selected long-run pace to determine both their pre-intervention foot strike pattern and running cadence.Participants were recorded in the sagittal plane with high-speed video(125 Hz)to determine foot strike type using the pattern that occurred for the majority of 10 consecutive right steps.Initial contact with the heel was considered RFS,initial contact with the forefoot was considered FFS,and contact of the heel and forefoot together was considered midfoot strike.To determine cadence,the number of right foot strikes was counted over 30 s.This was repeated twice,averaged together,then multiplied by 4 to determine the number of steps per minute.12All participants using an RFS at initial contact and demonstrating a cadence of ≤170 steps/min were included.Increasing the cadence of a runner with a high cadence(>170 steps/min)may be injurious.8A total of 59 runners were screened,yielding 39 participants who met the final inclusion criteria(Fig.1).Using block randomization based on age and sex,these runners were assigned to either the FFS or CAD group,with a block size of 4(randomization scheme created with Microsoft Excel 2011;Microsoft Corporation,Redmond,WA,USA).
2.2.Data collection procedures
Participants underwent a baseline assessment.Markers were placed on the foot to determine the foot strike angle.Heel markers were placed directly onto the calcaneus through holes cut into the shoes,and the remaining markers were affixed to the shoe over the 1st and 5th metatarsal heads and the 2nd toe distal phalanx.Because all participants were habituated to conventional shoes,all were tested in a conventional,neutral cushioned shoes(Nike Air Pegasus;Nike Inc.,Beaverton,OR,USA)for their baseline measure.
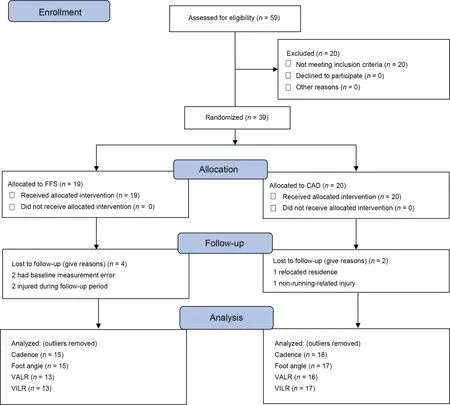
Fig.1.CONSORT flow diagram.CAD=cadence;FFS=forefoot strike;VALR=vertical average load rate;VILR=vertical instantaneous load rate.
Runners were recorded using an instrumented treadmill(AMTI,Watertown,MA,USA)and an 8-camera 3-dimensional motion capture system(Vicon Motion Systems Ltd.,Yarnton,Oxford,UK).After a 3-min warm-up run,20-s of data were collected at each participant’s self-selected longrun pace.Kinematic data were sampled at 250 Hz,and kinetic data were sampled at 1500 Hz.To limit the possibility of performance bias,participants were asked to perform a cognitive distraction task(modified Stroop test)during the data collection.27For this task,participants were shown a written list of names of colors,in which the name of the color and the color of the text did not match.They were instructed to say aloud the color of the text,but not the word itself.Participants were not told the purpose of the distraction task,but were assured there were no speed or accuracy requirements to the words they read aloud.
2.3.Data processing
Before processing,all data were de-identified.Kinetic and kinematic data were filtered at 50 Hz and 12 Hz,respectively,with a 4th-order low-pass Butterworth filter.Data were processed using Visual3D(C-motion,Germantown,MD,USA)and customized Matlab code (Mathworks, Natick, MA,USA).To determine load rates,the customized code first identified 3 types of vertical ground reaction force(VGFR)curves.13These included one with a defined vertical impact peak with a local maxima,one that had an impact transient where the slope levels off but without a local maxima,and one that had neither an impact peak nor an impact transient(Fig.2).In all cases,a point of interest(POI)was then determined to establish the end of the range over which the load rates were calculated.The POI was defined as the point just prior to the slope reducing by 15 BW/s.In addition,the POI had to exceed a participant’s body weight.This was to ensure that an early low-force peak in the vertical ground reaction force curves was not used as the POI.Both the vertical average load rate(VALR)and the vertical instantaneous load rate(VILR)were calculated.The VALR was defined as the average slope between 20%and 80%of the most linear part of the curve in the region between foot strike and the POI.VILR was defined as the peak slope within the region between 20%and 100%of the curve between foot strike and POI.Foot angle was calculated as the foot with respect to the global coordinate system.Foot strike was classified as FFS if the angle between the foot and treadmill was negative(ankle plantarflexion)and as RFS if the angle was positive(ankle dorsiflexion).Cadence was defined as number of steps per minute and was determined with ground reaction force data.All data were extracted from the first 10 right foot strikes and averaged for data analysis.
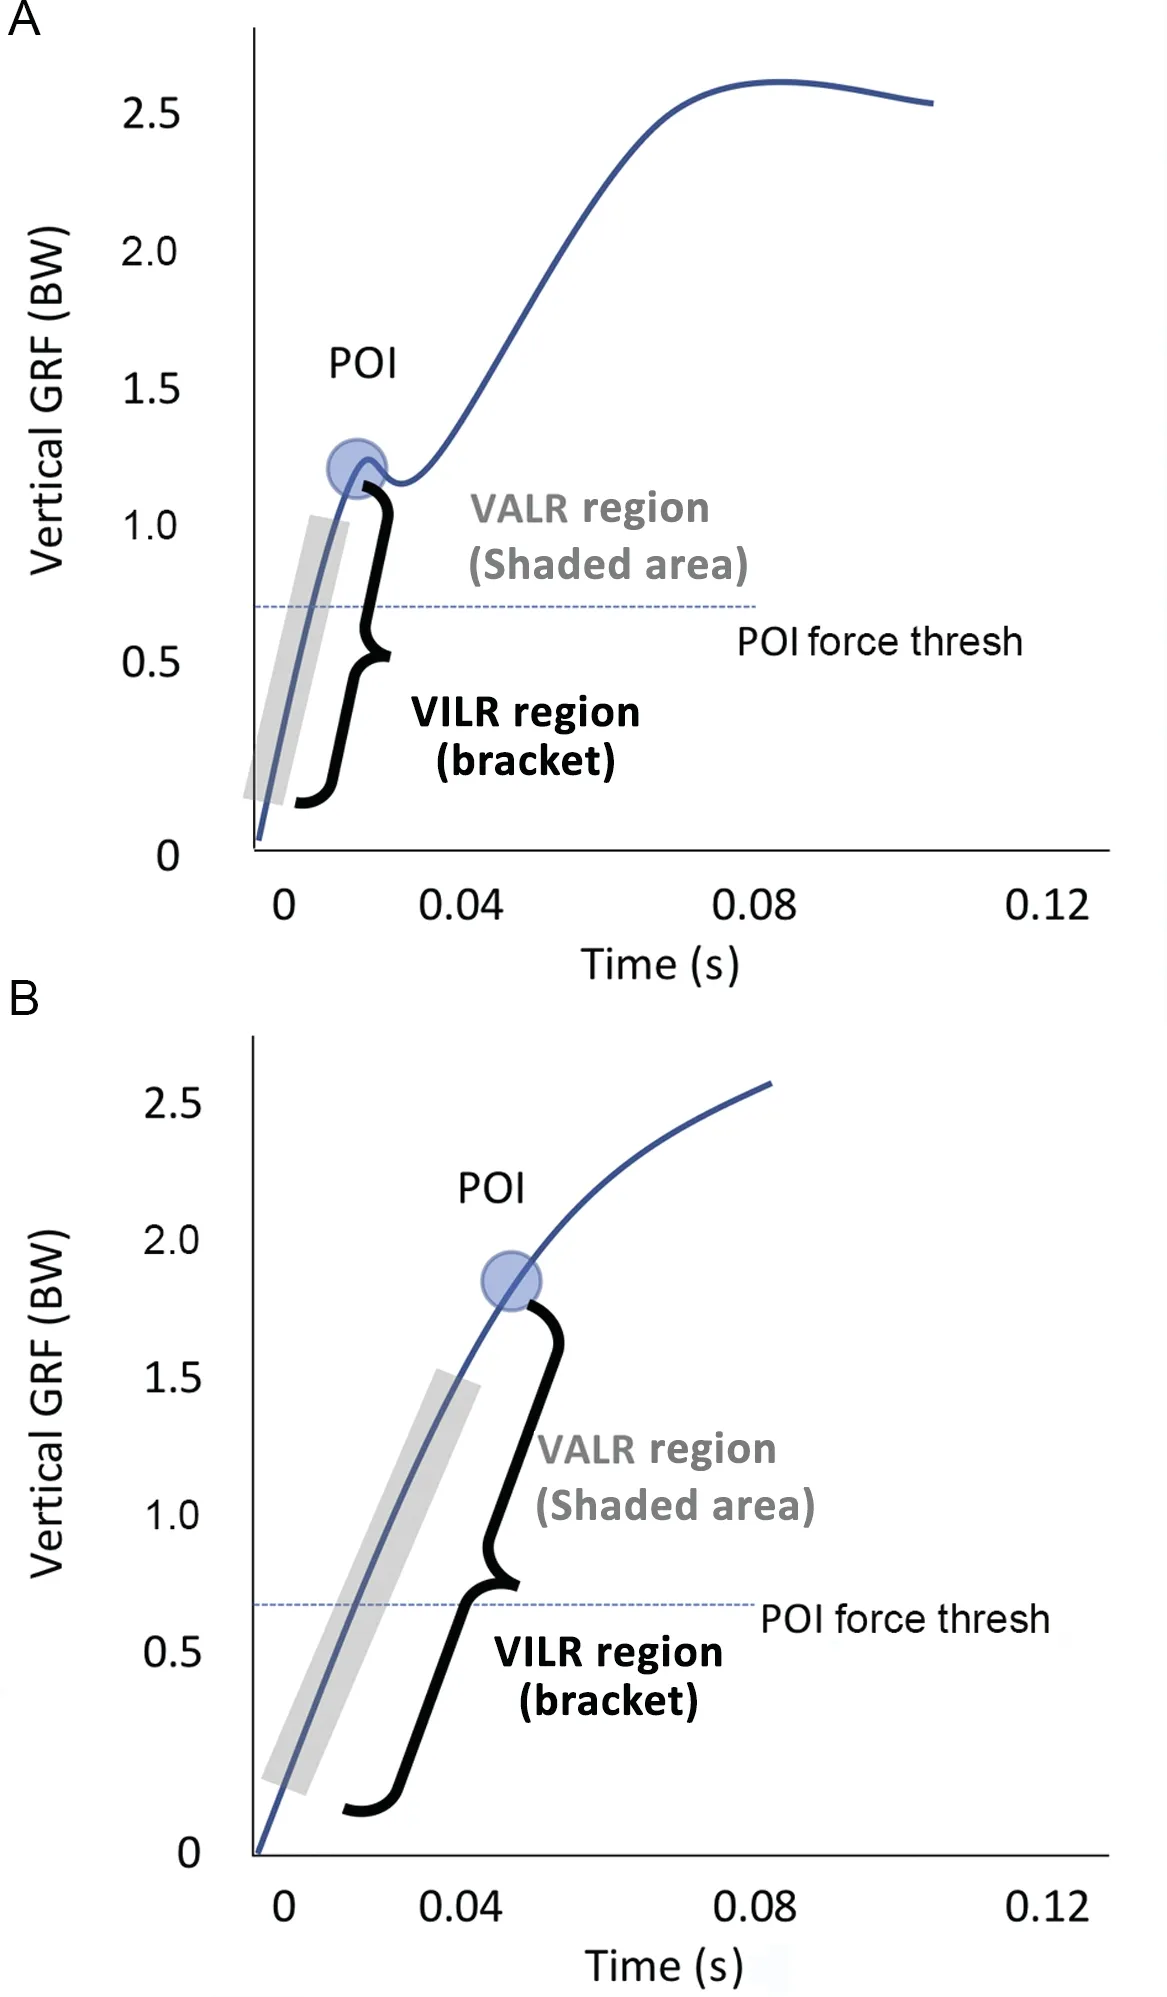
Fig.2.A diagrammatic sketch of vertical ground reaction force(GRF)curve identifying the point of interest as well as the range over which the load rates were calculated.(A)Sample curve with defined impact peak,typical of rearfoot strike.(B)Sample curve with no impact peak,typical of forefoot strike.The vertical average load rate(VALR)is the average slope along the shaded region,and the instantaneous load rate(VILR)is the peak slope between any 2 successive points within the bracketed region.POI=point of interests.
2.4.Strengthening and gait-retraining procedures
After the baseline analysis,participants in both groups were instructed in a strengthening program for the feet and lower legs.This helped to prepare musculoskeletal tissues for the demands of a new running pattern.They performed exercises independently and kept a journal for 28 days.All participants returned to the lab 7 days after the initial instruction to be monitored for proper technique(exercise details in Supplementary Table S1).
After completion of the exercise period,participants returned for 8 gait-retraining sessions over a period of 2-3 weeks.To ensure tissue rest,sessions could be scheduled 2 days in a row but never 3 days in a row.Participants were instructed not to do any running outside of the retraining.The FFS group was provided with minimalist footwear(Inov-8 BareXF 210 V1;Inov-8LLC,Southborough,MA,USA)as part of the intervention because this type of footwear helps promote an FFS pattern without excessive inversion and plantarflexion.28-30The CAD group was provided with conventional neutral cushioned footwear(Inov-8 Road Claw 275,Inov-8LLC)since these participants were not expected to change their foot strike pattern and thus needed the cushioning under their heel.12,31Therefore,the footwear in each group was matched to fit the needs of the foot strike pattern.17Photos of the footwear and Minimal Index score32are in Supplementary Fig.S1.Participants were given the footwear as remuneration and allowed to wear it for daily use as desired.They brought their footwear to each session.All retraining was conducted on a treadmill(Woodway,Waukesha,WI,USA)in a physical therapy clinic.
We chose methods of feedback that could easily be implemented in a clinic.Therefore,we used a digital metronome for providing auditory feedback to the CAD group.The metronome was set to 7.5%above the runner’s natural CAD determined at baseline.8,12Subjects were instructed to match their foot strikes to the audible beat of the metronome.As the foot moves quickly in the sagittal plane,it is difficult for a subject to visualize the foot strike angle in real time.However,the pattern of tibial shock changes markedly between RFS and FFS landing(Fig.3).Because tibial accelerometers are now clinically available,we chose to use them for foot strike auditory feedback.Participants wore a wireless tibial accelerometer(Noraxon USA,Scottsdale,AZ,USA)affixed with pre-wrap and athletic tape 3 cm above the right medial malleolus on the flattest and most vertical portion of the distal medial tibia.The tibial shock signal was transferred wirelessly to a desktop computer and displayed to the researcher.Participants began with their RFS,then transitioned to the FFS pattern for approximately 3 min.The peak value during the FFS pattern was used as the criterion value that indicated an FFS pattern(in Fig.3,this would be set at 50 m/s2or approximately 5 g). When that value was exceeded,an audible beep was given to remind the runner to land on the forefoot.Auditory feedback was used for both groups because it has been shown to provide a more transferable extrinsic cue compared to visual feedback.33
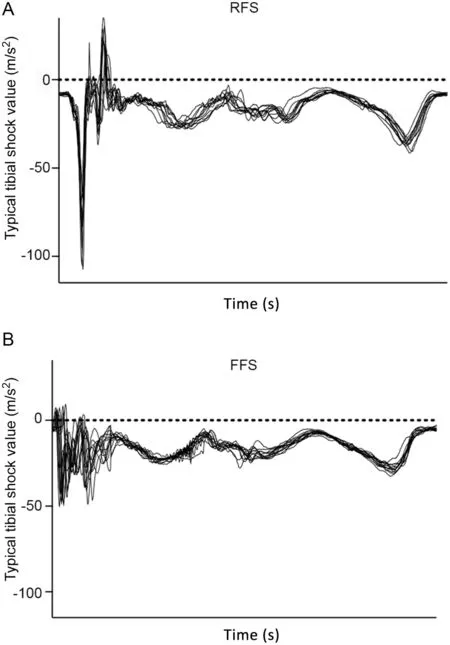
Fig.3.(A)Typical tibial shock values(m/s2)for(A)a rearfoot strike(RFS)and(B)a forefoot strike(FFS).
Self-selected speed from the baseline assessment was used for all retraining sessions.Before running,a verbal explanation of the gait method was given using a written script(Supplementary Table S2).At the first session,participants were provided a 3-min warm-up run on the treadmill,after which retraining began.The same verbal cues from the script were given only during the first 4 min of running to reduce bias of coaching individual participants.
For both groups,run time was gradually increased from 10 min to 30 min over the 8 sessions.Auditory feedback from the metronome(CAD group)or from the accelerometer(FFS group)was provided constantly during the first 4 sessions and then systematically reduced over the last 4 sessions.This retraining schedule has been used successfully in a number of studies.9,22,23After each session,both groups were asked to rate the feeling of“naturalness”of the new gait pattern.They reported this on a 0-10 verbal analog scale,where 0 was“completely natural” and 10 was “completely unnatural”.Additionally,runners reported any pain experienced after each retraining session.This was reported on a 0-10 verbal analog scale,with 0 being“no pain”and 10 being“worst pain imaginable”.After completion of the 8 retraining sessions,participants were instructed to continue with their new gait pattern independently with their provided footwear.They were given written instructions to increase running distance by no greater than 10%per week until they reached their desired distance.34
The instrumented gait analysis was repeated at 1 week,1 month,and 6 months following the intervention.However,at the post-intervention analyses, FFS group members were tested in minimal shoes because these were considered part of the intervention.The CAD group members were tested in conventional neutral shoes.
2.5.Statistical analysis
SPSS Version 25.0(IBM,Armonk,NY,USA)was used for statistical analysis. Outliers were removed based on the median absolute deviation(MAD)method of Leys et al.35To be more conservative, this method was further modified according to Mullineaux and Irwin.36These authors applied a more stringent criteria of scaling MAD using a maximum t statistic of 0.001.35,36Using this approach,no more than 2 participants were ever removed from each variable assessed.The number of participants included for each variable’s analysis is given in Supplementary Table S3.
Independent t tests(p <0.05)were conducted to compare groups at baseline for participant demographics and outcome variables. A 2×4 repeated measures analysis of variance(ANOVA)was used to compare differences within and between the 2 retraining groups(CAD vs.FFS)over 4 time points:baseline,and post-retraining at 1 week,1 month,and 6 months.Based on Mauchly’s test of sphericity,Greenhouse-Geisser corrections were used for VALR,VILR,and foot angle.Withingroup effect sizes were reported using Cohen’s d.37Cohen’s d was calculated as the ratio of the mean difference of each variable between time points,to the pooled standard deviation.Effect size was interpreted as small (d ≤ 0.2), moderate(d=0.4-0.6),and large(d ≥0.8).For variables with significant interaction effects,simple main effects of group and time were explored using one-way ANOVA.
3.Results
Of the 39 participants initially included,2 participants in the FFS group withdrew due to foot pain that occurred during the follow-up phase of the study(Fig.1).Only 1 participant exceeded the recommended running dosage after retraining.She was later diagnozed by a physician and radiograph with a 3rd metatarsal stress fracture.The other participant followed the recommended weekly distance.She did not seek medical consultation,but rested and then returned to running without issue.Groups were similar in demographics and outcome variables at baseline(Table 1).The data in Supplementary Table S3 include mean values and results of within and between group comparisons for all outcome variables across all time points.
3.1.Cadence
There was no interaction effect of Time×Group for cadence.Therefore,the main effects of group and time were assessed.Cadence significantly increased by 7.2%for the CAD group and 6.1%for the FFS group following the retraining.However,there were no significant differences in cadence between the CAD group and the FFS group at any time point.The increased cadence persisted across all follow-up times(Fig.4A).
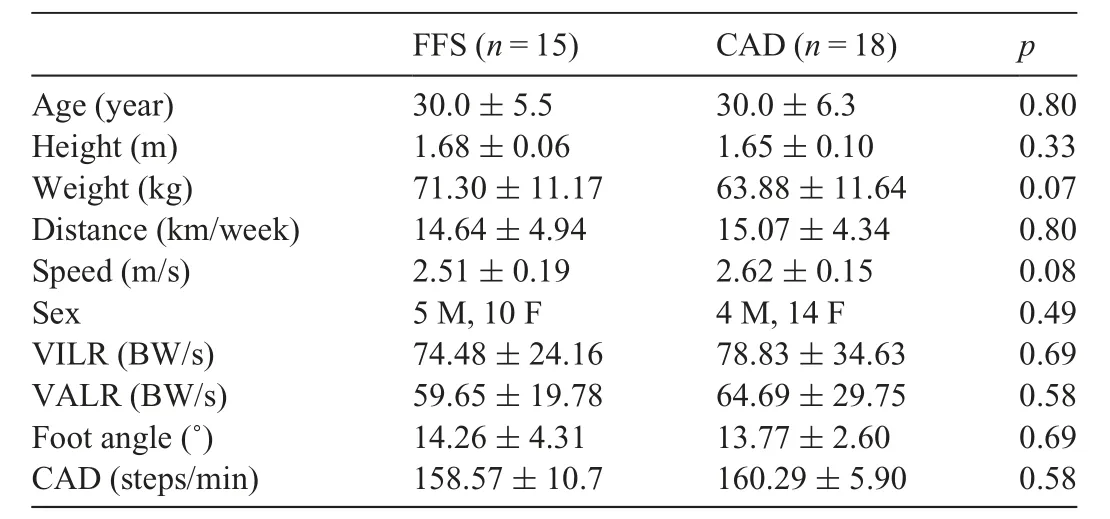
Table 1 Mean±SD baseline values for participant demographics and outcome variables.
3.2.Foot angle
A significant Time×Group interaction was noted for foot angle;therefore,simple main effects were assessed.Foot angle was not significantly different between groups at baseline.However,foot angle was significantly lower in the FFS group following retraining,changing from 14.2˚dorsiflexion to 3.4˚ plantarflexion at initial contact(Fig.4B).The change in the FFS group foot angle was maintained across all follow-ups.Foot angle was unchanged in the CAD group following the retraining and during follow-ups.
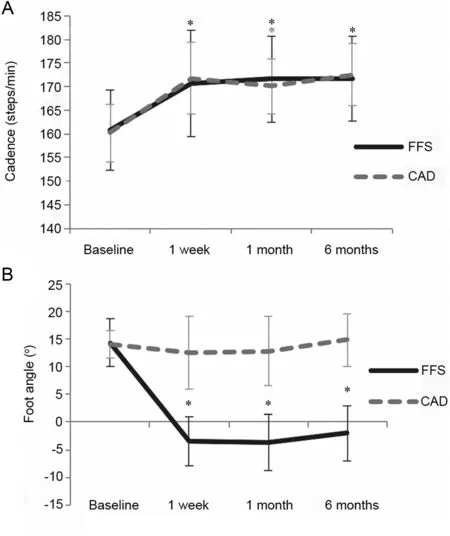
Fig.4.(A)Mean cadence values and(B)mean foot angle values for CAD(n=17)and FFS(n=15)groups over 4 time points.Negative foot angle indicates plantarflexion.Error bars are SD.*p ≤0.05,indicates significantly different from baseline).CAD=cadence;FFS=forefoot strike.
3.3.Vertical load rates(VALR and VILR)
There were significant Time×Group interactions for VALR and VILR;thus,simple main effects of time and group were analyzed.For the FFS group,VALR was reduced by 49.7%at the 1-week post-retraining follow-up(Fig.5A).This reduction was significantly lower than baseline(p <0.005)and did not vary between follow-ups.VILR was statistically reduced by 41.7%from baseline to 1-week post-intervention(p=0.001)and then remained unchanged across follow-ups(Fig.5B).For the CAD group,VALR was reduced by 14.1%from baseline to 1-week post-intervention(Fig.5A).This change was not statistically significant(p=0.07),but showed a moderate effect(d=0.5).VALR remained unchanged across the follow-up periods.In terms of VILR,there were no significant reductions from baseline to 1-week post-intervention for the CAD group(p=0.13),nor across the follow-up periods(Fig.5B).At the 6-month follow-up,VIRL was reduced for the CAD group by 11.7%,which was not significantly lower than baseline (p=0.07) and showed a moderate effect(d=0.4).When comparing load rates between the groups,VALR and VILR were not significantly different between groups at baseline,but were significantly lower for the FFS group at all follow-up times(Fig.5).
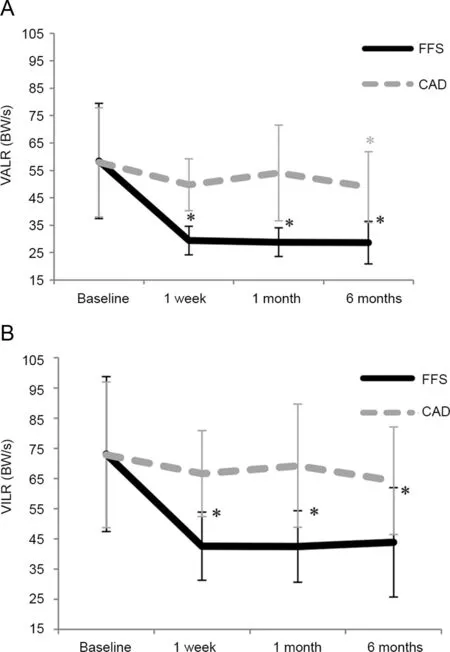
Fig.5.A,Mean VALR for CAD(n=16)and FFS(n=13)groups over 4 time points.B,Mean VILR for CAD(n=17)and FFS(n=13)groups over 4 time points.Error bars are SD.*p <0.05,indicates significantly different from baseline.CAD=cadence;FFS=forefoot strike;VALR=vertical average load rate;VILR=vertical instantaneous load rate.
3.4.Naturalness of gait
The FFS group reported a higher initial rating of unnaturalness(6/10)than the CAD group(4/10)during retraining.However,by the final session,both groups gave an average rating of 2/10(Fig.6).At the 6-month follow-up,naturalness was 2.4/10 for the CAD group and 2.5/10 for the FFS group.
3.5.Pain with new running gait
Both groups reported mild pain with use of the new gait patterns.The FFS group had a slightly higher rating of pain(2/10)for the first 3 sessions compared to the CAD group(1/10).By the final session,average pain was 1/10 for both groups.Areas of pain reported in the FFS group included foot,ankle,calf/Achilles,knee,and hip.The vast majority of complaints were in the calf/Achilles,followed by the foot.For the CAD group,areas of pain included foot,ankle,calf,anterior leg,knee,hip,and low back.The most common area of pain in the CAD group was the foot,followed by the knee.
4.Discussion
The purpose of this study was to compare the short-and long-term biomechanical effects of increasing cadence and adopting an FFS pattern.Specifically,we aimed to assess the effect of these interventions on cadence,foot angle,and vertical load rates.We expected that participants in both groups would increase their cadence,with the CAD group increasing the most,but that only the participants in the FFS group would alter their foot angle at contact.We expected that both groups would demonstrate reduced load rates,with the FFS group exhibiting the greatest reduction.Finally,we expected that changes in mechanics and load rates would be better maintained over the long term in the FFS group compared with the CAD group.
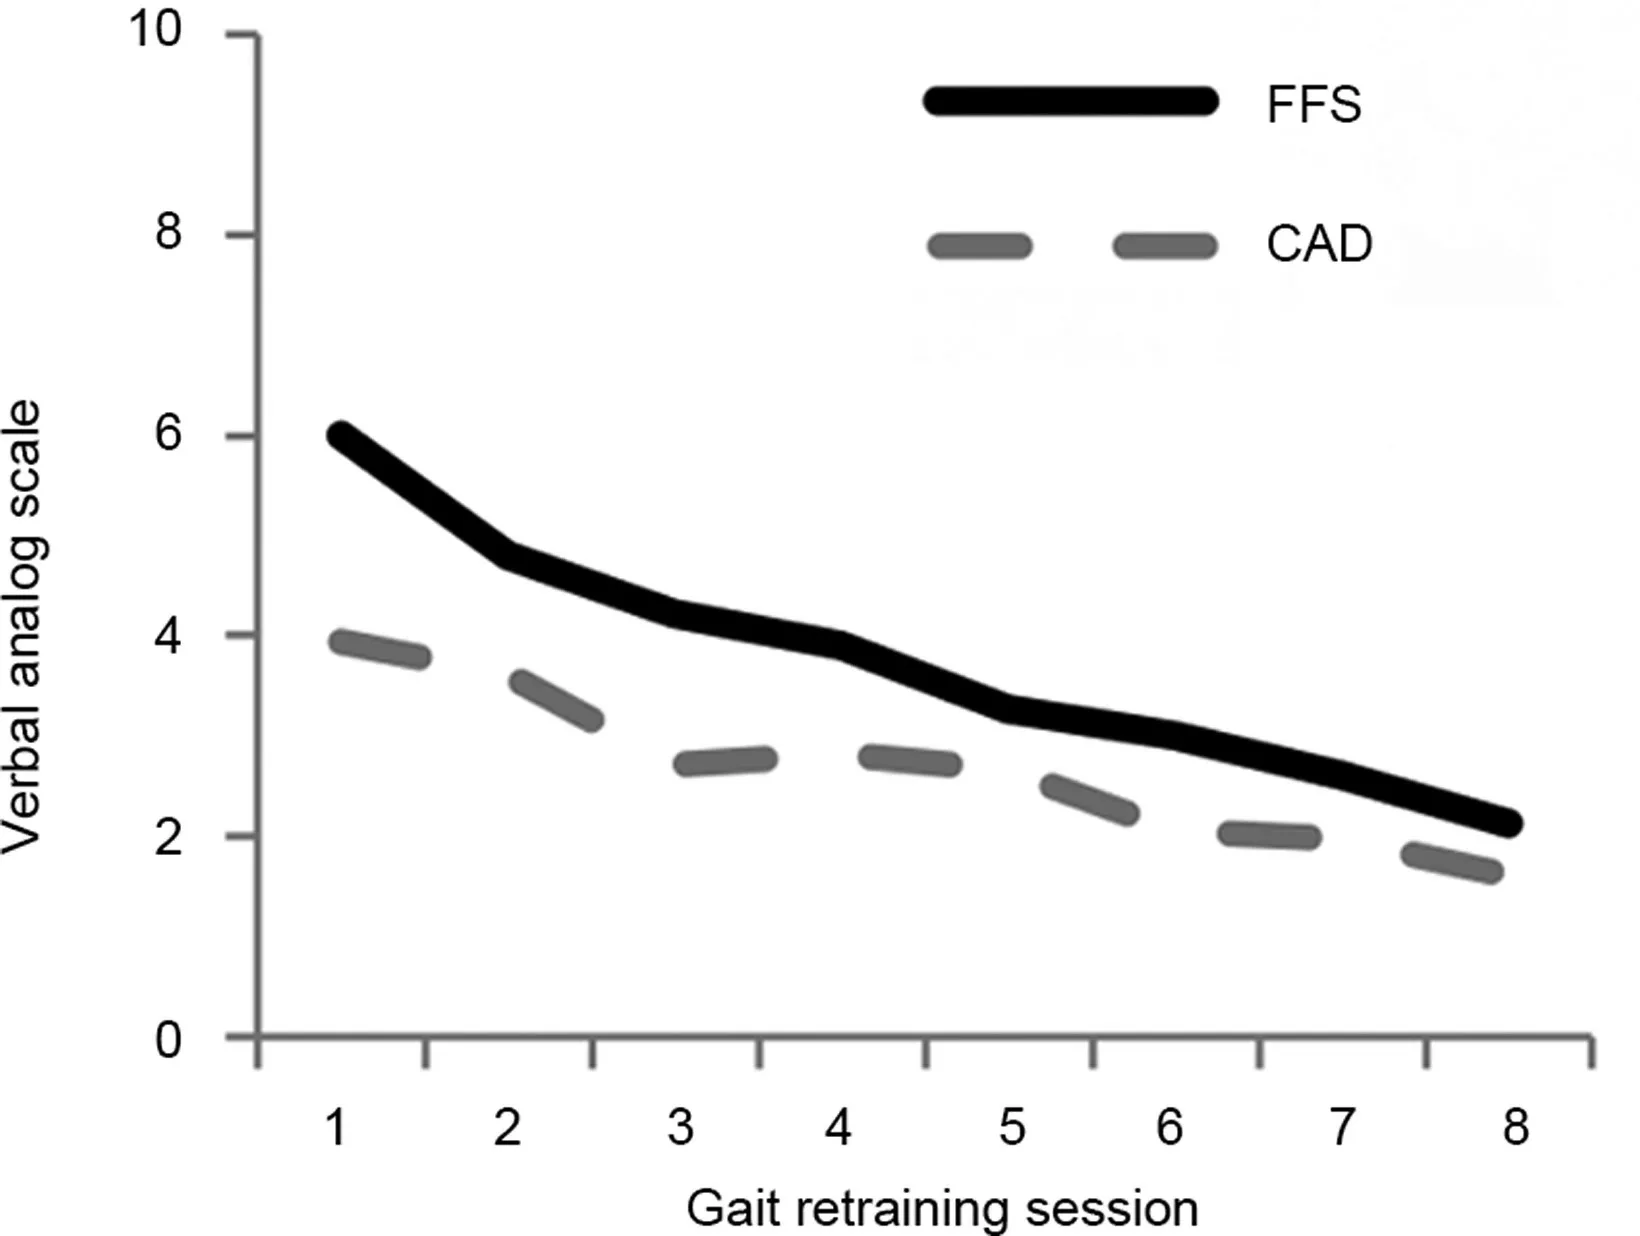
Fig. 6.Naturalness ratings of new gait patterns. Verbal analog scale with 0=totally natural and 10=totally unnatural. CAD=cadence;FFS=forefoot strike.
With the retraining,participants in both groups increased their cadence,but only participants in the FFS group altered their foot strike angle.We expected participants in the FFS group to alter their foot strike angle to be plantarflexed,because this change is necessary to achieve an FFS pattern.In contrast,cadence can be increased without changing the foot strike angle,which is what was observed.In terms of cadence,we expected a greater change in the CAD group because this was the variable that was provided as feedback.We did expect cadence to increase(to a lesser degree)in the FFS group,despite not receiving feedback on step rate.This is because runners typically bring their foot closer to their center of mass in order to make initial contact with the ground with the forefoot.If speed is kept constant,this shorter stride results in greater cadence.The higher cadence associated with an FFS pattern has been reported by other investigators.7,11,37,38Our results suggest that transitioning to an FFS pattern accomplishes the same increase in cadence as cadence gait-retraining.
The FFS group demonstrated the greatest reduction in load rates,with a statistically significant 49.7%and 41.7%reduction in VALR and VILR,respectively,at the 1-month follow-up.The use of an FFS gait has been shown to eliminate the vertical impact transient,which markedly reduces vertical load rates.5,6,11This reduction in the impact force is due to activation of the calf musculature,which increases the time for deceleration of the vertical velocity after ground contact.37This allows for a smooth rise to a single peak vertical ground reaction force.The observed change in VALR was consistent with Samaan et al.,7who found a 50%reduction with barefoot FFS running;and with Yong et al.,11who found a 40%reduction during shod FFS running.However,these studies involved a single 5-to 10-min session of instructed FFS running,with no evidence of learning.Our results suggest that runners who undergo a program that incorporates motor control principles(faded feedback)are able to achieve this same level of reduction.This was achieved even when performing a cognitive distraction task,further indicating that learning had occurred.
The CAD group demonstrated much smaller reductions in load rates(14.1%VALR,9.0%VILR)that did not reach significance in the short term.These results are supported by Yong et al.,11who reported almost no change in load rates in RFS runners who performed an acute retraining session of increased cadence.Hobara et al.39found only an 8%reduction in vertical load rates,with an 18%increase in cadence.However,participants in the Hobara et al.study did not regularly engage in running,which may have influenced the results.Willy et al.8reported greater reductions in load rates in response to increasing cadence.Their subjects underwent one session of treadmill gait-retraining with an audible metronome to increase cadence by 7.5%.8Then the participants performed 8 typical training runs outside and were told to monitor their cadence using a wrist watch that was synchronized to a shoe sensor.Willy et al.reported reductions in VALR and VILR of 19%and 18%,respectively,when running with an 8.6%increase in cadence.This slightly greater reduction found by Willy et al.may be due to their inclusion criteria of runners who had excessive load rates,allowing for a greater potential reduction.Additionally,they did not use a cognitive distraction test during their assessments.Therefore,it is possible that the runners were intentionally running with a higher cadence(resulting in lower load rates)than they naturally did to perform well on the assessment.Despite not reaching statistical significance in the present study,the load rate reductions with cadence retraining had moderate effect sizes(Cohen’s d=0.4-0.6),suggesting that they may have clinical relevance.However,a 14%reduction induced by a cadence change may not be enough to bring the values of someone with a high load rate down to a safe range.
Changes that occurred in each group persisted over the long term.Cadence was the only variable that was significantly altered after retraining in the CAD group,and the change persisted over 6 months.For the FFS group,all variables were changed after retraining and all persisted over 6 months.The long-term persistence in load rates for the FFS group are consistent with a case series by Cheung and Davis,10in which runners were instructed to shorten stride length and avoid a heel strike.These runners maintained reduced load rates and foot strike pattern changes 3 months after gait-retraining.Cheung and Davis did not report if changes in stride length or step rate occurred.There are few studies that have assessed the effect of cadence beyond the postretraining data collection.Willy et al.8and Hafer et al.40found persistence in CAD changes 1 month and 6 weeks,respectively,after implementing self-regulated increased cadence protocols.
The strengthening exercises were designed to fortify foot and ankle structures as participants transitioned to a new gait pattern.Transitioning to an FFS pattern in minimal shoes,with a quick progression of mileage and without strengthening,increases the chance of bone stress injuries in the foot.26A systematic review of transitioning to minimal footwear recommends preparatory strengthening for injury prevention,because this will provide the necessary neuromuscular tissue adaptations.19Even with the exercise program used in our study,one runner in the FFS group experienced foot pain and another experienced a bone stress injury during the follow-up.However,one of these participants increased her running dosage beyond our recommendations for safe adaptation.Participants in both groups reported soreness in the lower extremities as they adopted a new gait pattern.Average soreness for both groups was never greater than 2/10 on a 0-10 verbal analogue scale.For the initial 3 sessions,soreness was slightly higher in the FFS group(2/10 compared with 1/10 for CAD).This level of soreness is an acceptable and a natural response to new exercise.The foot and calf/Achilles tendon accounted for nearly all of the reported areas of soreness in the FFS group.This can be expected with the new foot strike,which requires greater eccentric work in the ankle plantarflexors and initial contact with structures of the forefoot.The pain experienced by members of the CAD group encompassed more areas.This may indicate greater diversity in strategies for impact reduction with this new gait style or could be attributed to other factors,such as alignment issues,not addressed during retraining.
The FFS group reported less naturalness of the gait pattern in the first few retraining sessions.This is likely due to a greater difference in mechanics between RFS and FFS patterns than the difference between one’s habitual cadence and a 7.5%increase in cadence.However,no members of either group reported that their new gait was completely natural by the final retraining session.Furthermore,at the 6-month follow-up this rating of slight unnaturalness(2/10)persisted in both groups,suggesting that a longer time is needed for complete adaptation to any new gait pattern.
The auditory faded feedback program was designed to adhere to motor control principles and optimize learning of the new gait pattern.Auditory feedback has been shown to be more efficacious than visual feedback.33Feedback given continuously leads to dependency on extrinsic cues,causing learners to ignore intrinsic cues such as proprioception, thus impeding motor learning.20Therefore,once a learner is past the first phase of acquiring a movement,faded feedback is recommended and has been found to be effective in a number of gait-retraining studies.9,10,20,22,33We believe the participants’consistent reproduction of an increased cadence in the CAD group and a plantar flexed foot angle in the FFS group is related to the inclusion of these motor control principles.The ability to maintain these changes under a distracted condition(i.e.,the Stroop test)further indicates that learning occurred.20
Every attempt was made to execute the 2 interventions as similarly as possible.Both groups received auditory feedback.The CAD group’s feedback(metronome)was temporal in nature and not related to impact force,while the FFS group received information based on the tibial accelerometer.However,no information regarding the magnitude of the tibial shock was given to participants in the FFS group.They were only provided with a binary signal that indicated whether they were landing with RFS or FFS.
Another difference was the footwear provided to each group.This was done to improve the validity of the interventions.It has been recommended that runners who are expected to retain an RFS pattern have cushioning under their heels.15On the contrary,those transitioning to an FFS pattern need the cushioning removed to discourage heel landings.6Therefore,it was important that the interventions in each group be done in the proper footwear to optimize the retraining.We also recommended that the FFS group remain in their minimal shoes throughout the follow-up period and beyond in order to promote the foot strike pattern.It has been shown that following FFS retraining in minimal shoes,runners who are put back into conventional shoes may regress to an RFS pattern.19,41This indicates that the new motor pattern associated with retraining and minimal footwear is altered when going back to a conventional cushioned shoe.19It was recognized that the difference in cushioning between the footwear in the CAD and FFS groups could have influenced the results.However,a recent study of midsole hardness reported only a 6%reduction in vertical impact force going from a medium to a hard midsole.42This difference is far less than those found between groups in this study.
It should be noted that the participants in this study were healthy recreational runners with low weekly mileage.Therefore,extrapolation of these results to injured,elite,or long-distance runners should be done with caution.In addition,all testing was performed in a laboratory setting.Testing in the field with mobile monitoring devices is needed to validate the results of these gait-retraining interventions.
5.Conclusion
To our knowledge,this is the first report comparing 2 clinically based,gait-retraining interventions aimed at reducing vertical load rates in healthy recreational runners.Furthermore,it is one of the only studies to analyze long-term(6-month)persistence of retraining interventions.Our findings suggest that FFS retraining was equally effective in increasing cadence as cadence retraining.Cadence retraining resulted in small load-rate reductions and may be an option for individuals with mildly increased load rates who are not willing to make foot strike pattern changes.Most notably,we found that FFS retraining was 3 times more effective in the reduction of vertical load rates over both the short and long term.
Acknowledgments
This work was funded by a student scholarship from the Force and Motion Foundation(501(c)(3)).The equipment used for gait-retraining was on loan from Noraxon(Scottsdale,AZ,USA).The authors would like to thank Matt Ruder,Steve Jamison,and Pratham Singh for their assistance with data collection,analysis,and production of this work.The authors would like to thank Alan Fossa with Harvard Catalyst for his consultation.Finally,we are grateful to the participants for their important contribution to this work.
Authors’contributions
EEF assisted in design,performed all data collection,and was primary author of the manuscript;KDG and DR assisted in study design and manuscript review and editing;DRM conceived and carried out statistical analysis; ISD primarily designed the study and assisted in manuscript writing.All authors have read and approved the final version of the manuscript,and agree with the order of presentation of the authors.
Competing interests
The authors declare that they have no competing interests.
Supplementary materials
Supplementary material associated with this article can be found in the online version at doi:10.1016/j.jshs.2019.07.006.
杂志排行

Journal of Sport and Health Science的其它文章
- Impacts of exercise intervention on various diseases in rats
- Reply to“Is physical performance(in mice)increased by Veillonella atypica or decreased by Lactobacillus bulgaricus?”
- Muscle strength cut-offs for the detection of metabolic syndrome in a nonrepresentative sample of collegiate students from Colombia
- Land-walking vs.water-walking interventions in older adults:Effects on aerobic fitness
- Longitudinal associations of physical activity and pubertal development with academic achievement in adolescents
- Increased Q-Factor increases frontal-plane knee joint loading in stationary cycling