Effect of tool rotational speed on the particle distribution in friction stir welding of AA6092/17.5 SiCp-T6 composite plates and its consequences on the mechanical property of the joint
2020-05-23UttamAcharyaBarnikSahaRoySubhashChandraSaha
Uttam Acharya, Barnik Saha Roy, Subhash Chandra Saha
Department of Mechanical Engineering, National Institute of Technology Agartala, Barjala, Jirania, West Tripura, 799046, India
Keywords:Friction stir welding Aluminium matrix composite Tool rotational speed Particle distribution Mechanical property
ABSTRACT This study investigates the effect of tool rotational speed (TRS) on particle distribution in nugget zone(NZ) through quantitative approach and its consequences on the mechanical property of friction stir welded joints of AA6092/17.5 SiCp-T6 composite. 6 mm thick plates are welded at a constant tool tilt angle of 2° and tool traverse speed of 1 mm/s by varying the TRS at 1000 rpm,1500 rpm and 2000 rpm with a taper pin profiled tool.Microstructure analysis shows large quantity of uniformly shaped smaller size SiC particle with lower average particle area which are homogeneously distributed in the NZ. The fragmentation of bigger size particles has been observed because of abrading action of the hard tool and resulting shearing effect and severe stress generation due to the rotation of tool. The particles occupy maximum area in the matrix compared to that of the base material (BM) due to the redistribution of broken particles as an effect of TRS.The migration of particles towards the TMAZ-NZ transition zone has been also encountered at higher TRS(2000 rpm).The microhardness analysis depicts variation in average hardness from top to bottom of the NZ,minimum for 1500 rpm and maximum for 2000 rpm.The impact strength at 1000 rpm and 1500 rpm remains close to that of BM (21.6 J) while 2000 rpm shows the accountable reduction. The maximum joint efficiency has been achieved at 1500 rpm (84%) and minimum at 1000 rpm (68%) under tensile loading. Fractographic analysis shows mixed mode of failure for BM,1000 rpm and 1500 rpm, whereas 2000 rpm shows the brittle mode of failure.
1. Introduction
Aluminium matrix composites(AMC)due to their extraordinary feature and properties like higher strength and stiffness, reduced density and lightweight nature, better thermal and mechanical properties,improved abrasion and wear resistance,better damping capability, etc. [1,2] over conventional materials. AMCs are extensively using in advanced areas like aerospace,military,automobile,marine, transportation, astronautics and electronic instruments in recent days [3,4]. However, the joining of these materials by conventional fusion welding is not an easy task because of the formation of unwanted defects like porosity, solidification cracking,distortion, reinforcement dissolution, reaction between reinforcement and matrix,etc.in the welding zone[5].Friction stir welding(FSW), established in the year 1991 by TWI, UK [6], joins the material in solid state condition and thus eliminates the defects associated with fusion welding and hence acts as a promising route to join this type of material.It is a green manufacturing and energy efficient process to particularly join nonferrous metals and alloys,MMCs,polymer,etc.[7].The formation and quality of weld joint in FSW largely depends on various aspects like machine parameters(traverse speed (TTS), tool rotational speed (TRS), tool tilt angle(TTA), process forces and torque, plunge rate and depth, tool material and design and types of materials (joint configuration, material property and dimensions) to be joint. Out of several parameters, TRS plays a vital role to impart required heat to plasticize the material in the weld zone so that it can be easily deformed by the tool[8]to achieve a sound joint.TRS is primarily responsible for the stirring and mixing of plasticized material. Frictional heat generated by the rubbing action of shoulder and workpiece surface application can find out elsewhere in the studies[15,19-22]carried out earlier by the different researcher on this material.provides smooth material flow in the weld zone and pushes it from leading edge to the trailing edge via retreating side (RS) while traversing [9] and also facilitate the downward and upward movement of the material. As TRS increases, the heat input also increases and the material experiences more intense stirring and mixing in NZ up to a certain limit of TRS and later decreases.So,it becomes very clear from the above discussion that the formation morphology of the NZ largely depends on TRS.

Table 1 Chemical composition of the base material.
On the other hand,Composite materials are composed of matrix and reinforcement phase, where the type, percentage, size and distribution of reinforcement in matrix characterize its property.The AMCs with a discontinuously reinforced particle in the matrix have their own effect in characterization and determining the properties over the other type of AMCs in its domain[10].Haghighi[11] has investigated the effect of equal channel angular pressing(ECAP) and conventional extrusion on particle distribution in Alnano-Al2O3composite. The result shows that four passes of ECAP samples have a better distribution of particles. Boselli et al. [12]have proposed a methodology for quantitatively analyzing the effects of reinforcement spatial distribution and morphology on short crack growth of Al/18.7 vol%SiCp composite.The above-mentioned literature implies the importance of particle distribution in AMCs.When this type of material is being joined by FSW the particles redistribute themselves in the NZ because of TRS. Thus, the distribution of particles in NZ differs from that of the base material(BM),which can largely affect the mechanical property of the joint.Marzoli et al. [13] have found that tool rotation in FSW greatly influence the particle shape and distribution while welding AA6061/Al2O3/20pcomposite plates. Earlier researchers have investigated the particle distribution in terms of particle size to characterize the property of the weld joint.Kim et al.[14]have found that the size of the Si particle reduces as welding speed increases while ADC12 die casting alloy is being FSWed. Acharya et al. [15] have investigated torque and force perspectives on the particle size in the weld zone and its effects of FSW of AMC.The study shows that the mechanical property of the joint increases as the particle size reduces. Few qualitative studies on particle distribution have been also reported.Liu et al.[16]has found improved particle distribution with smooth columnar pin tool than threaded one in FSW of AC4A+30 vol%SiC PRAMCs composites.Rathee et al.[17]suggest that,at an optimum plunge depth, the distribution of SiC particle is good in the Al matrix. In a different work [18], they also found that the groove technique exhibits better homogeneity in the distribution of SiC particle in AA 6063-T6 matrix over several other strategies implemented in that study of FSP.
Despite of a huge impetus that have developed in the recent years regarding study on FSW of AMCs,very limited work has been conducted till date showing the quantitative analysis of the particle distribution in the nugget zone (NZ), the underlying physics involved in particle distribution due to rotation of the tool and its subsequent effect on the microstructure and mechanical property.This acts as motivation for the current work and an attempt has been made to fill the gap in the field of FSW of AMCs. The current investigation has been carried out on 6 mm thick discontinuously reinforced AMC named AA6092/17.5 SiCp-T6 FSWed at different TRS. This material is very effectively used in industrial and advanced aerostructural applications due to its good physical,mechanical and thermal properties. The detail advantage and
2. Experimental procedure
The present investigation is carried out in a dedicated 3T FSW setup on AA6092/17.5 SiCp-T6 composite material plates having a dimension of (150×60×6) mm each. The plates are supplied by DWA ALUMINUM COMPOSITES USA and the chemical composition and mechanical properties of the material are enlisted in Table 1 and Table 2 [15]. The welding is performed at a fixed traverse speed (TS) of 1 mm/s and tool tilt angle (TTA) of 2°with three different tool rotational speeds (TRS) of 1000 rpm, 1500 rpm and 2000 rpm. The parameters are chosen based on the trial run. A plane taper tool pin of 6 mm bottom dia.,3 mm tip dia.and 5.7 mm pin length with 18 mm shoulder dia.made of H13 tool steel having hardness of 56 HRC has been used for welding. This specific configuration is chosen to ensure minimum tool wear and to maintain a homogeneous distribution of reinforcement in the weldment. All the welding is performed at a fixed dwell time of 5 mm/s and with a plunge depth of 0.1 mm. The surface of the plates are carefully cleaned by ethanol prior to a weld run of 100 mm,aimed to eliminate the presence of any foreign material in the plate.
All the required samples (base material as well as welded samples) for the testing are taken from a region of welding where the torque and force are comparatively stable. The metallography samples were carefully polished and etched before macrostructural analysis in macroscope and microstructural analysis in Carl Zeiss EVO 50 (WSEM) machine. Later, the quantified values of particle distribution has been analysed at different spots from the SEM image of NZ and BM. The samples are then subjected to hardness testing at a load of 100 gf for 10 s in Matsuzawa MMT-X Series ASTM E-384 Vickers microhardness tester. Three samples for Charpy impact testing were prepared for each welding and were tested as per ASTM E-23 standard aimed to investigate the average impact energy at the nugget zone. Similarly, three set of ASTM E8 standard tensile samples were prepared along the transverse direction of each welding and were tested in INSTRON-1195 UTM at a strain rate of 0.5 mm/min. The ultimate tensile strength (UTS),percentage elongation and the joint efficiency were calculated.The tensile fractured samples are subjected to fractographic analysis.
3. Results & discussion
The aim of the study is mainly supported by three parts in the current section. In the first part, the formation of particular macrostructures is analysed on different TRS perspectives. Thereafter,the morphology of NZ at different TRS as well as the BM is analysed in terms of particle distribution. In the last part, the effects of change in particle distribution in NZ at different TRS are evaluated in terms of various mechanical property analyses.In this analysis itis assumed that the change in particle distribution in NZ is largely influenced due to TRS involve in the process and not by TS or heat input.
Table 2 Mechanical properties of the base material.
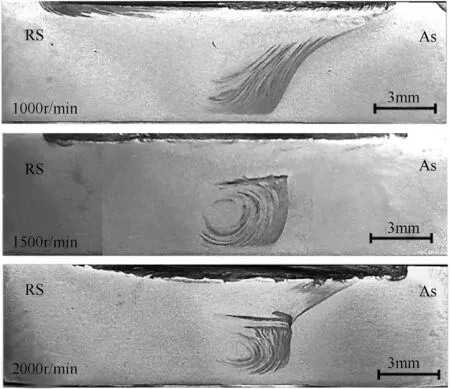
Fig.1. Macrostructure of the samples welded at different TRS.
3.1. Macrostructural observation
Fig. 1 shows the macrostructures of the samples welded at different TRS. The macrostructures at different TRS looks macroscopically sound. A clear distinction of NZ can be observed in AS than RS for all samples.However,morphological differences can be observed in the samples in terms of formation of the onion ring.The sample at TRS 1000 rpm shows a clear band like structure in the advancing side rather than the formation of conventional onion rings in the NZ.On the other hand,as the TRS increases,the onion ring becomes clearer in the samples.The reason may be related to the generation of required heat input responsible for the smooth and easy flow the plasticized material in NZ.At 1000 rpm,the heat input may not have reached to the optimum extent and as a result,the material in the NZ becomes highly viscous. Due to the higher viscosity of the material at NZ,the shear force acting there becomes more prominent and tries to pull the material from outside the pin area.This led to a less conspicuous distinction between TMAZ and NZ and results in larger NZ area with a band like structure.On the other hand,the micrograph at 1500 rpm and 2000 rpm shows more prominent onion rings and shifts to downward with an increase in TRS.As the TRS increases,the heat input also increases and material in NZ become softer.This facilitates easy flow of material in the pin influenced region and results in the formation of an onion ring. It can be also observed that the area of pin influenced region at 2000 rpm reduces.This may be due to the increased fluidity[15]of the material in NZ at higher heat input which reduces the viscosity of the material.As a result,the material adjacent to the tool pin area experiences less shear force and led to the reduction in pin influenced area. A similar type of happening is also observed by Krishnan [23] in their investigation.
3.2. Microstructural evolution
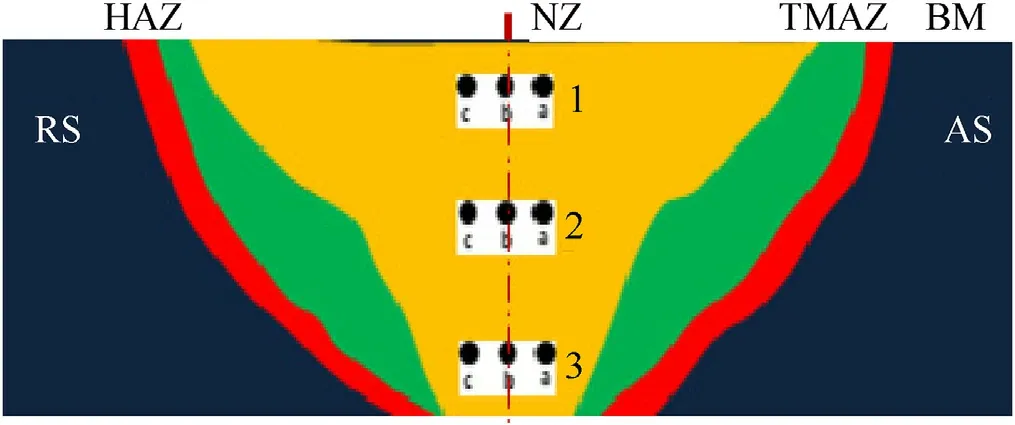
Fig. 2. Schematic representation of macrostructure showing different spots with its respective location where the microstructural and hardness analysis are concentrated.
Fig. 2 shows a schematic representation of macrostructure where the microstructure and hardness analyses are carried out.The analyses are focused in three individual locations(1 mm below from two surfaces (1 & 3) and at the mid-width (2)) at the NZ.Further three different spots(spot a,spot b and spot c)are chosen in each location for a thorough analysis of the microstructure and related hardness. Such analysis has been framed aimed to get a clear picture of NZ in terms of its particle distribution and mechanical property. The spots are chosen exactly at weld centreline(spot b) and 1.5 mm away from the weld centreline in both sides(spot a & spot c). An assumption has been made in the study that the redistribution of particles in the matrix due to TRS is largely limited to NZ and it also influences the characteristics of the joint.
3.2.1. Morphological study
Fig.3 illustrates the microstructure of BM and the selected spot of NZ welded at various TRS. In BM three spots are randomly selected to inspect the consistency of particle distribution in terms of homogeneity, the number of particles distributed, average area of particles and total area occupied by particle over a fixed area in the SEM image with minimum error.All the images are occupied at fixed resolution and area of 9520 μm2for easy comparison of the images and for further analysis. The microstructure of BM shows nearly uniform distribution in the matrix barring agglomeration.However,a higher inter-particle distance can be observed in some region than usual which results in few particle free areas in BM.The bond between the particle and the matrix looks excellent.It can be observed that the maximum number of particle present in the matrix possesses similar size of non-uniform shape with sharp edges. The avg. particle size and area calculated for BM is 7.92 μm and 26.61 μm2. For welded samples, the images are taken at selected spots of different selected locations of NZ to fulfil similar aim at different TRS.As images of the different spot in a particular locations of NZ at varying TRS depicts almost similar morphology characteristics, so only one image (at spot b, excluding spot a and spot c) is considered for the morphology analysis in the current study. The microstructures of different spots of NZ at varying TRS also show homogeneous redistribution of particles in the matrix.The inter-particle distance between particles seems to be more uniform in the microstructures of NZs at 1000 rpm and 1500 rpm compares to that of BM and NZ at 2000 rpm. Compare to BM, a higher amount of smaller size particle can be observed. Additionally, the images of NZ give evidence that the sharp corners of the particles gets blunt and brings more uniformity in shape compared to that of BM.This certain changes in the microstructure of various spots in NZ are exclusively due to the TRS.
TRS plays multiple roles in the formation of sound weld in FSW.Firstly,it produces the required amount of heat for the softening of material to provide an ideal material flow for the formation of sound joints. Secondly, for joining of AMCs, maintaining the first point it breaks the bigger size particle by the abrasive action of the tool while rotating through highly viscous material and redistribute it the matrix phase[24].In addition to this the fragmentation of the particle is also supported by the shear effect and severe stress generated due to the rotation of tool through highly viscous medium [5,25]. This fragmentation results bigger size particle into smaller pieces and might have brought the variation of structure and shape of the particle in the NZ as observe from Fig.3.Also,the Fig. at various spots of NZ looks denser in terms of particle distribution in the matrix compared to BM due to the same reason.The images of three different spots of each particular location show similar observation. The quantitative analysis of particle distribution is explained in the following sub-section.
Fig.4 shows the Energy Dispersive Spectroscopy(EDS)analysis of matrix and reinforcement particle of the BM in the spots indicating in Fig.3.This analysis acts as an evidence for using the said material used in this current investigation. Table 3 shows the elemental composition of constituent of BM in wt.%. Spot EDS analysis has been conducted in BM as shown in spot 1 and 2 of BM in Fig. 2. The analysis confirms the presence of the probable elemental composition of matrix and reinforcement phase.
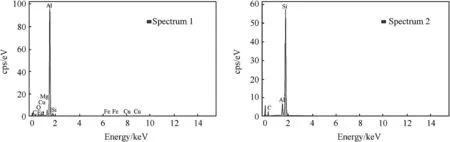
Fig. 4. Energy Dispersive Spectroscopy (EDS) analysis of matrix and reinforcement in BM at spectrum 1 and spectrum 2 in marked in Fig. 3.

Table 3 EDS analysis confirming the composition of matrix and reinforcement in BM in wt.%.
3.2.2. Particle distribution analysis
A quantitative analysis of particle distribution has been carried out in this study to thoroughly investigate the effect of TRS in morphological changes in NZ at different TRS.The investigation has been carried out minutely starting from different spot to its respective location(shown in Fig.2)and ultimately to the whole NZ at particular TRS. In the end, the particle distribution of NZ at different TRS is compared with one another and with that of BM.Quantification has been made stepwise.Firstly,the total number of particle has been manually calculated in a definite area for each spot. In the second step, the average particle area has been calculated by the manual method in Image-J software in each spot.In the third step,the total area occupied by the particle in a definite area of the image has been revealed for each spot by using first and second step. Then the quantified values of different spots later converge to its respective locations (e.g. location 1 = spot a+ spot b + spot c) of the particular NZ. Lastly, the results from different steps of three locations are converged for a particular NZ,aimed to attain a clear picture of particle distribution of NZ at different TRS so that a fruitful comparison can be made between NZ at different TRS with BM.
Table 4 exhaustively represents the data of different step for all the spots in BM and NZ at different TRS.The table indicates that the morphology of BM at different spot possesses a nearly equal quantity of particles,unique average particle area and the particles have occupied an equal amount of area in the matrix phase.These indicate the uniformity in particle distribution and therefore confirming a firm microstructure of BM.The particle distribution in NZ(spots)shows the higher amount of particle compare to BM whichcan act as quantitative evidence for the morphological study. In FSW of AMCs,the particle breaks at the shoulder influenced region due to the abrading action of the hard tool with high frictional force at the interface due to tool rotation.This led to a higher quantity of particle at the spots in NZ than BM within the equal area.Variation can be observed in the quantity of particles present and total area occupied by particles in three different spots of each location,while the average particle area remains the same.However,this variation of number of particle present in between each spot for a particular location is negligible compared to the number of particle present in the spots that lies in a particular vertical line for different locations.In FSW, the flow of material is more prominent in the vertical direction rather in horizontal direction and the migration of the particles also depends on this flow. To justify the study, vertically three different locations(1,2,3)along the NZ have been chosen as shown in Fig. 2 to see the variation of overall particle distribution.Further to make the study more accurate and of minimum error three spots on a particular location have been chosen(a,b,c).From Table 4 it can be clearly seen that considering any rpm(say 1000),the variation of particles at the same axis along vertical direction(say 1b,2b and 3b)is much more(191,162 and 143)in comparison to flow in the horizontal direction(say 2a,2b and 2c).This indicates that material flow is much more prominent along vertical direction rather than horizontal direction. As the migration of particle also depends on this flow, so the variation in particle distribution horizontally in a particular zone is limited thereby showing minimum difference in the particle counts of different spot in a particular location. In addition to this, another interesting phenomenon prevails within the three spots of each location. The spot at the weld centreline(spot b)shows a minimum amount of particle while the spot in AS (spot a) have the maximum amount of particle and the spot at RS(spot c)shows the intermediate values.The reason can be related to the mechanics of the material flow of NZ in FSW. FSW involve a high rate of shear stress for the plastic deformation of the material.As a result,the material from the centre of the weld zone may tend to move towards NZ boundary.Due to this phenomenon,the particle from the weld centreline may have tried to push themselves towards the boundary and stretched along the shear stress direction due to high plastic strain and migrates.This causes a continuous deficiency of particle from boundary to the weld centreline. The similar observation has been investigated by Amirizad et al. [26] in their study. It has been observed from the past literature [27] that the material from leading edge travels towards trailing edge and AS via RS.This may be the particular reason that spot at AS (spot a) shows a higher quantity of particles compared to that of the RS (spot c).

Table 4 Table showing the distribution of the total number of particle, avg. particle area& total particle area in different spots of BM and NZ at different TRS.
Fig.5 show the analysis of particle distribution at three different locations for each NZ. Fig. 5(a) shows the comparison in terms of variation in the quantity of particle distributed in different locations. The Fig. clearly shows variation in particle distributed in different locations in terms of quantity of particle present for each NZ.Reduction in the quantity of particle from top to bottom of the NZ at 1000 rpm can be observed,while NZ at 2000 rpm shows the opposite trend. Previous literature [28] reported that friction between the shoulder and the workpiece is the main reason for the availability of heat in FSW.Thus the material flows from top to the bottom by achieving the ideal heating condition [29]. Further, the deformed material experiences an outward spinning movement from the pin surface and thus the material reach at the top from bottom and the vice-versa happens when the shoulder pushes back the plasticize material at the bottom. Thus ideal material flow is driven at an ideal heating condition which further depends on TRS and provides a critical viscosity to the material and gets fluidized enough to favour such flow.In this condition,the particle in the NZ migrates with the material flow from top to bottom and vice-versa.The NZ At 1500 rpm might have achieved this ideal condition and results in minimum variation of the particle at the various location from top to bottom. Contrariwise, the heat input at 1000 rpm compared to 1500 rpm is low; as a result, the material at NZ possesses higher viscosity and facilitates higher abrading action to the particle at the interface. This restricts the smooth flow of the material from top to bottom and vice-versa and results in a higher amount of particle at the top and decreases toward the bottom.On the other hand, the higher heat input at 2000 rpm results in more fluidized material leading to lower viscosity. At this condition, the abrading action on the particle reduces due to the lower viscosity and results in a lower density of particle at various locations compare to that of at 1000 rpm and 1500 rpm. The increase in particle density from top to bottom at TRS of 2000 rpm may be due to the better downward flow of material. Fig. 5(b) shows the variation of average particle area with standard deviation at three different locations of all the NZ.Here also the minimum variation is observed at 1500 rpm, whereas, at TRS 2000 rpm the average particle area decreases from top to the bottom of the NZ and 1000 rpm shows the opposite trend.This observation may be due to the same reason as explained before.It can be noticed from the analysis that,the average particle area in the NZ is inversely proportional to the amount of particle present in NZ.The observation implies that the average particle area of NZ depends on TRS at ideal FSW condition with an optimum amount of heat at the NZ. Fig. 5(c) shows the comparison of variation in total area occupied by the particles in the matrix phase over a fixed amount of total area (28560 μm2) of the images at three different locations of a particular NZ. It is a mathematical quantification and is a product of the average particle area and the total amount of particle present in the 2D images of a particular location.This analysis may not lead to an accurate result experimentally,as this analysis is shaped from 2D images and also the shape of the particles in the composite is not similar. Yet the analysis is incorporated in the study,as theoretically the trend will remain the same with a change in particle distribution and will act as a platform for predicting the properties in the NZ. The analysis shows a reduction from top to bottom of the NZ with minimum variation for 1000 TRS and 1500 TRS,while 2000 rpm results in the opposite type.
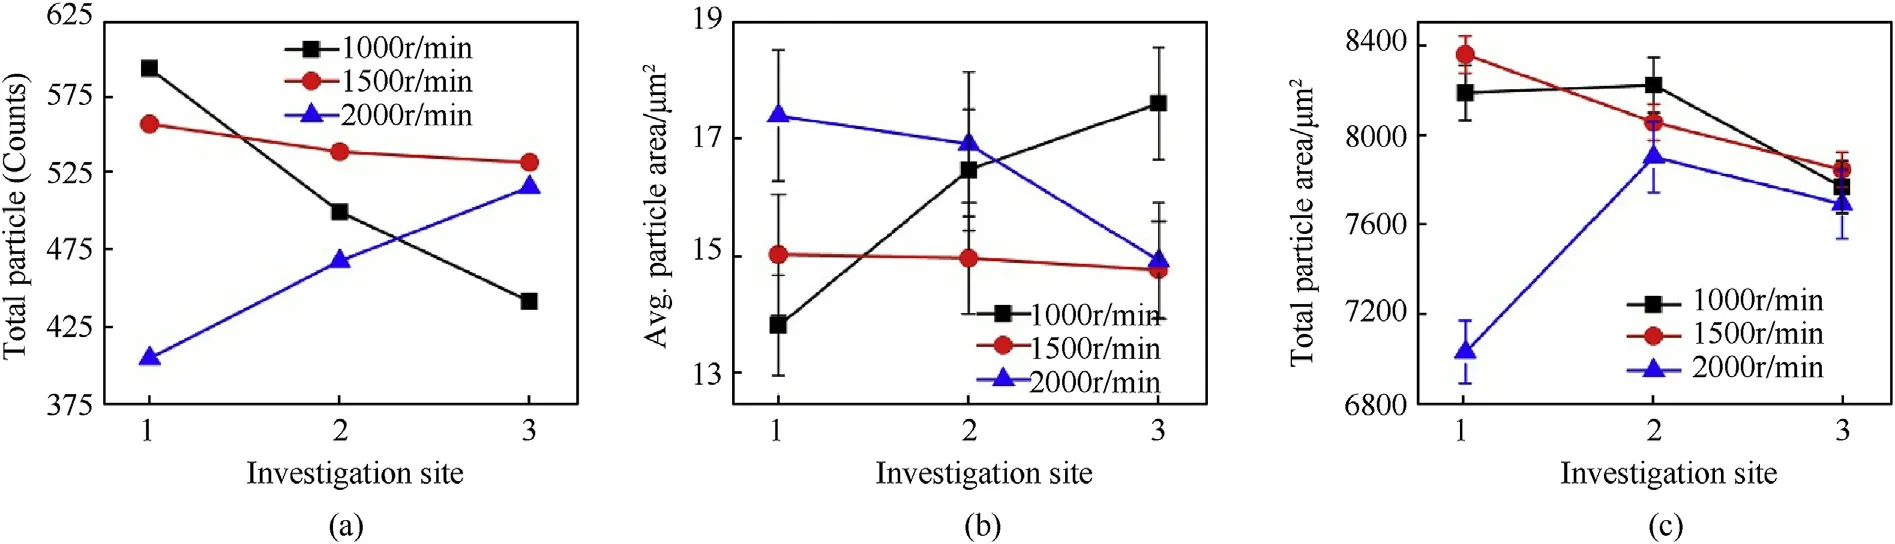
Fig. 5. Analysis of particle distribution at three different locations of each NZ (a) variation in quantity of particle (b) variation in average particle area, (c) variation in total area occupied by particles.
Fig. 6 shows the comparison on different aspects of particle distribution of NZ at different TRS with that of BM. In this part, all the aspects are converged from a different location to the whole NZ at particular TRS aimed to uncover a gross outline for NZ so that a fruitful comparison can be made with BM. Here the observation and findings remains the same due to the similar reason as discussed above.However,it can be observed form the Fig.that,after summing up all the particle areas of each sample,the total particle area of BM,1000 rpm and 1500 rpm samples are quite close. This observation confirms that all the local changes in particle size and quantity happens due to the separation of the particle. However,the Fig. also suggests that the total particle quantity and total particle area in the 2000 rpm sample has decreased noticeably.This may be due to the fact that at higher TRS as the material attains higher plastic state and also becomes less viscous in the NZ, the particle may have moved towards the TMAZ-NZ transition zone.Fig. 7 shows that the TMAZ-NZ transition zone in both the AS and RS for the sample 2000 rpm possesses higher density of bigger size particle which may support the above statement more clearly. A similar type of observation has been also reported by Pol et al.[30]in their study. The effects of TRS on particle distribution are investigated in terms of mechanical property and are explained in the subsequent section.
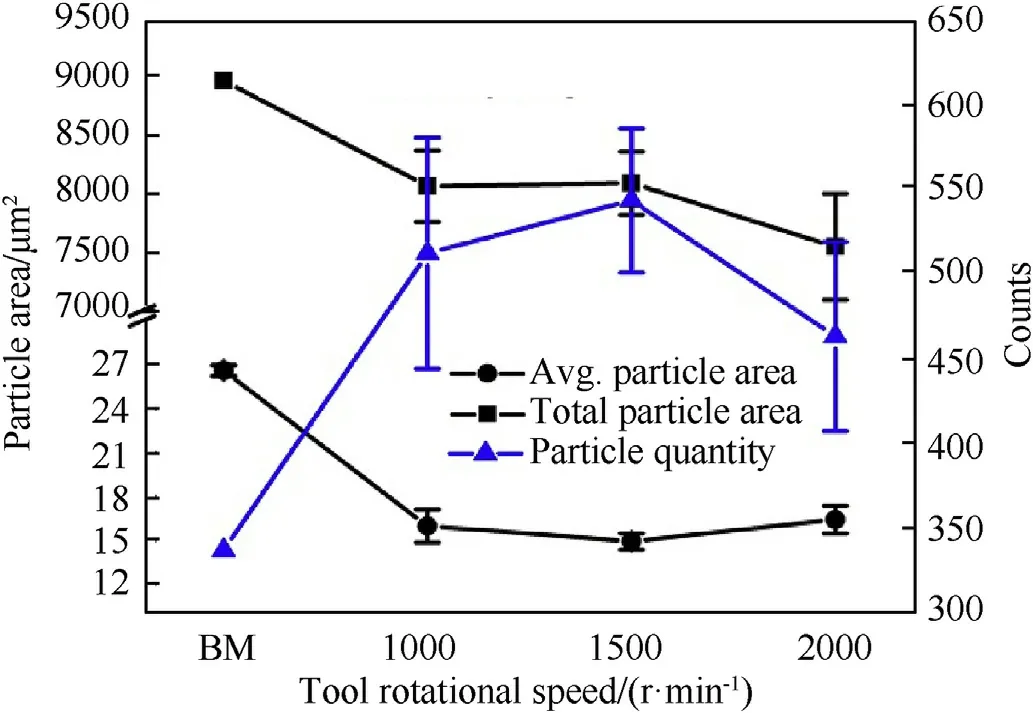
Fig. 6. Comparison of the number of particles, average particle area and total area occupied by particles in NZ at different TRS with BM.
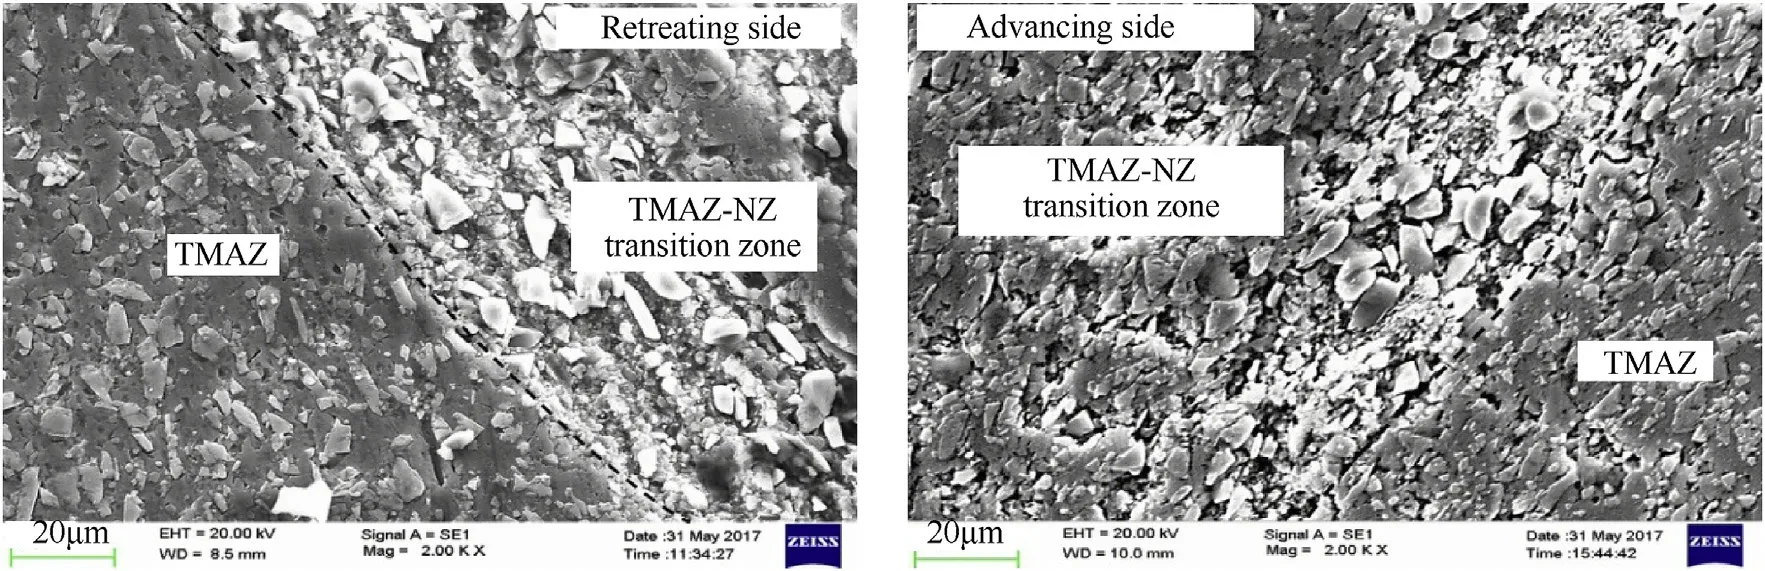
Fig. 7. Accumulation of bigger size particle in the TMAZ-NZ transition zone at higher TRS (2000 rpm).
3.3. Mechanical property analysis
This section supports the effect of different TRS in variation of particle distribution in the NZ in terms of mechanical property of the joint. The hardness analysis will support the variation of particle distribution at different location of each NZ.Impact testing will support the effect of variation in particle distribution at NZ at different TRS in terms of total impact energy absorbed by the nugget.The tensile testing supports the overall effect of TRS in the weld zone in terms of its mechanical strength. The fractographic analysis will reveal the effect of TRS in terms of fracture mode of the sample.
3.3.1. Hardness analysis
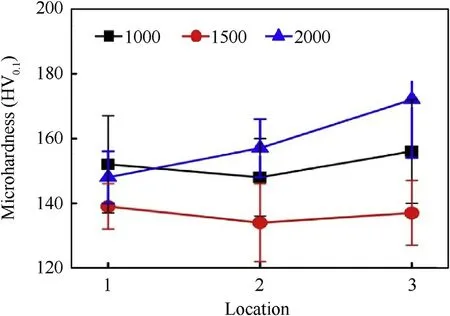
Fig. 8. Comparison of the hardness at different locations of NZ at different TRS.
Fig.8 shows the Vickers microhardness plot at three locations of each NZ.This analysis has been carried out exactly at the locations where the microstructural and particle distribution analysis has been conducted.The analysis aimed to investigate the effect of TRS perspective on particle distribution and its effect on the variation of hardness at different locations of each NZ. Hardness has been checked by considering random multiple indentations at each location. But the results are inconsistent which leads to the evaluation of an average value of the hardness with standard deviation for best reflection of the result.The hardness of the BM is measured and shown a value of 159 Hv.While graph shows a reduction in the hardness of each NZ compare to BM. The reduction in hardness values can be related to the particle distribution in terms of the amount of particle present in the zone, its shape and total area occupied by it in the matrix phase. It has been observed in the particle distribution analysis section that though the amount of particle increases, the total area occupied by the particle in the matrix reduces.This can be the probable reason as this may disturb the inter particular distance and lead to such reduction in hardness at the particular zone. Additionally, it has been observed that the hardness at different locations of 1000 TRS and 1500 TRS shows lower variation compare to that of 2000 rpm. The variation of hardness in NZ at 2000 rpm varies from 148 Hv to 172 Hv. This variation is resembled with variation in particle distribution in the different location of NZ at 2000 rpm as shown in Fig. 5(a) and (c)which is enough to reveal the reason for such variation in hardness.The average hardness of the total NZ area at TRS of 1000 rpm,1500 rpm and 2000 rpm are 152 Hv, 137 Hv and 159 Hv respectively. So, this observation reveals that the hardness in NZ maybe decrease or increase compared to that of BM. The increase or decrease in hardness of NZ completely depends on the particle distribution along with the type of material flow at the particular heat input.
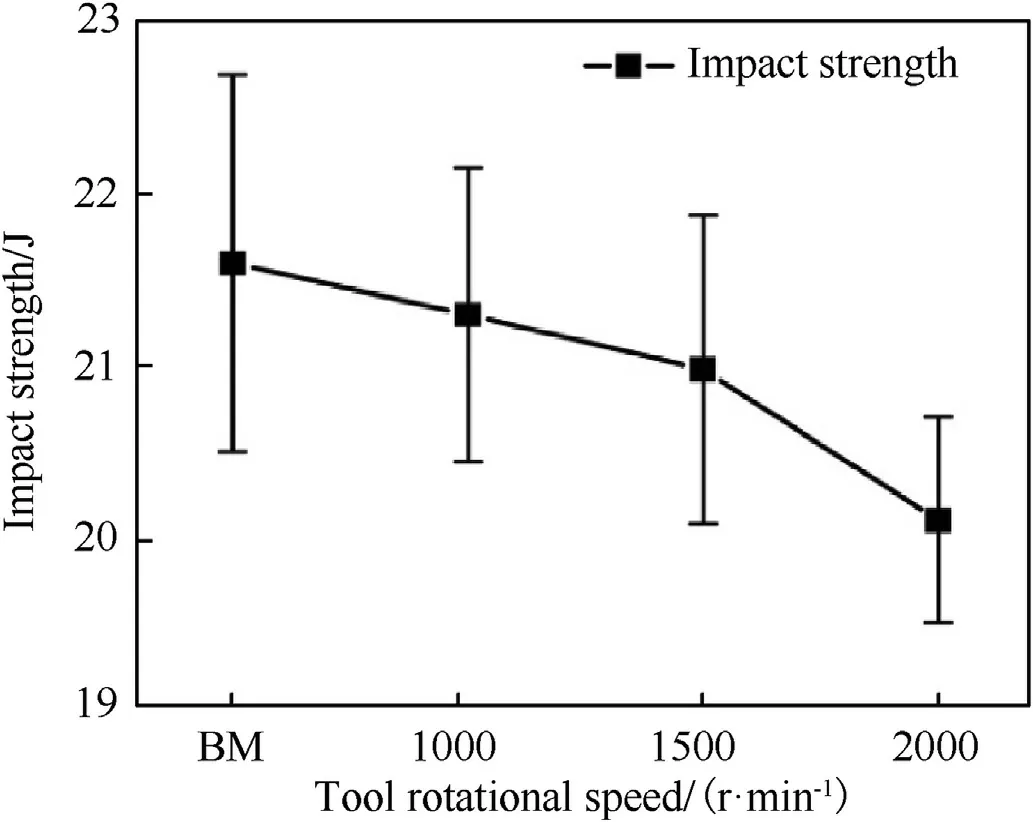
Fig. 9. Comparison of impact strength of the nugget zone at different TRS and base material.
3.3.2. Impact strength analysis
The Charpy impact testing is carried out on three sub-size specimens of each category to trace the average values. It is aimed to evaluate the impact energy of NZ at different TRS and to compare it with BM as shown in Fig. 9. This type of analysis seeks importance to understand the amount energy absorbed by the welded material before failure, though very few work has been reported till date on FSW of this type of material. However the result of the impact strength of the current material on this study is in conformity with the values cited in literature[31]on same type of material for a preliminary understanding. The current material possesses 17.5 vol% of SiCpreinforced particles of average size of 7.92 μm embedded in AA6092 matrix phase. The presence of particles increases the hardness and UTS while compromising the ductility of the composite material compare to its base matrix material. The effect of reinforcement on the reduction in ductility has been clearly reflected during testing when all the samples failed in two separate parts. In this study, the BM shows higher impact energy among all the samples.The lower values in absorbed impact energies for the welded samples may be due to the reduction in effective area at the weld zone which plays a vital role in the calculation. It is due to the fact that the tool shoulder plunges 0.1 mm in the workpiece during welding so that maximum area of tool shoulder can take part in the welding at TTA of 2°.It facilitates maximum heat input at particular TRS for the necessary material flow in the NZ. However, the graph also shows that the absorbed impact energy decreases as the TRS increases from 1000 rpm to 2000 rpm.The continuous decrease in the absorbed impact energy values can be attributed to the microstructural changes in the NZ due to the induced heat and rotational motion of hard tool in terms of roundness, refinement, quantity and type of distribution of reinforcement and the increase or decrease in matrix grain size[32]. The optimum quantity, uniform shape and distribution of particle in matrix with comparatively smaller grain size increase the property of AMCs. The discussions on microstructure and particle analysis part supports that this deal situation is more prominently prevail in 1000 rpm and 1500 rpm sample compare to 2000 rpm sample.This may be reason that the samples of 1000 rpm and 1500 rpm shows more or less similar absorb impact energy values while 2000 rpm shows comparatively lower value.
3.3.3. Tensile strength analysis
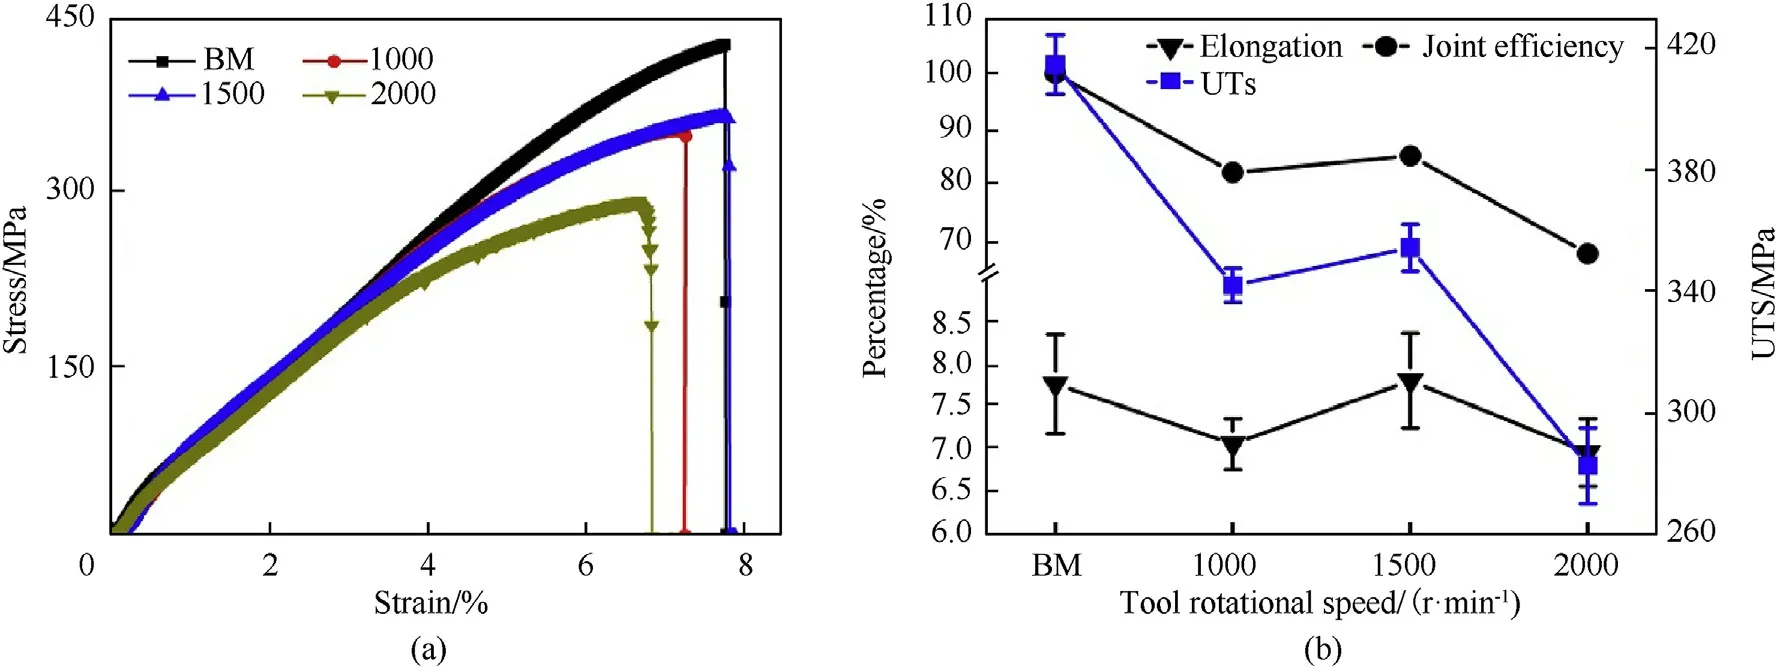
Fig.10. Tensile strength comparison (a) Graph showing the comparison of experimental tensile plots, (b) % elongation, joint efficiency and ultimate tensile strength of joints at different tool rotational speed and base material.
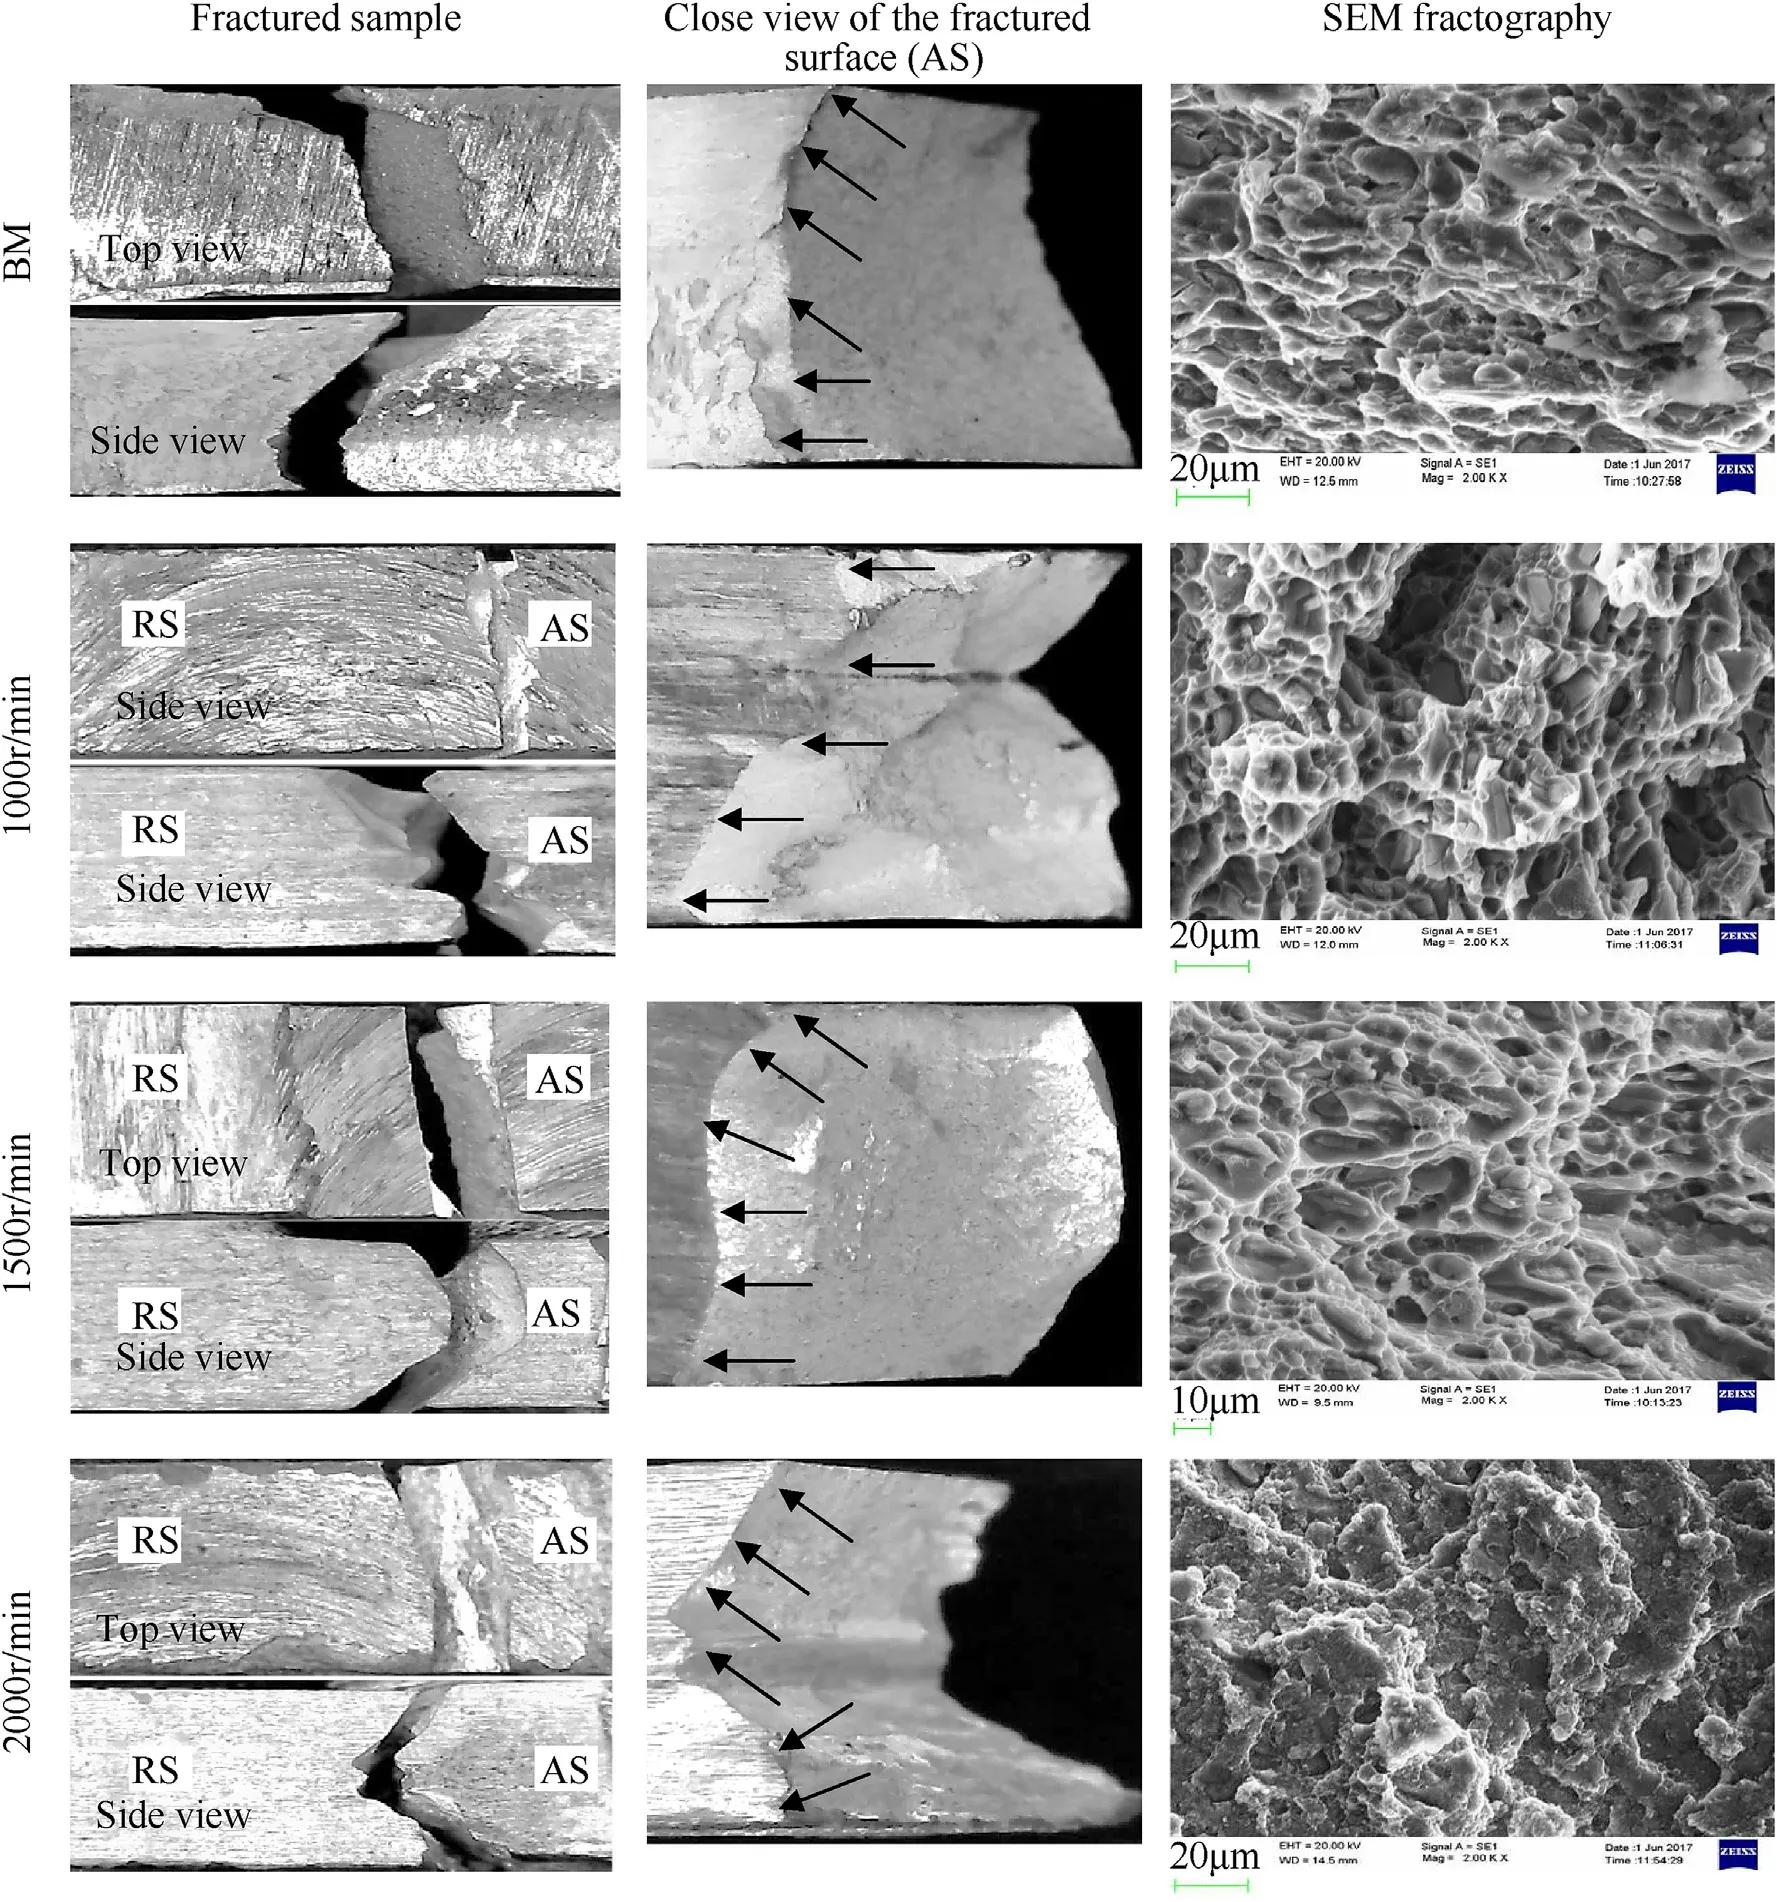
Fig.11. Figure showing different views of tensile fracture samples at different TRS with respective SEM fractography and base material.
Tensile strength analysis is performed aimed to investigate the overall effect of TRS on the weld zone.This testing is very important for the welded structure to evaluate its quality in the practical application in terms of its mechanical strength. Fig.10 showing a comparison of the tensile strength of the samples welded at different TRS with BM. Fig.10(a) shows the comparison of experimental tensile plots whereas Fig. 10(b) shows the comparison of ultimate tensile strength (UTS), elongation (%) and joint efficiency(%) the samples welded at different TRS to that of BM. Three samples from each type of ASTM-E8 standard are tested at a strain rate of 0.5 mm/min and the average value are considered in the study.Both the plot shows a clear reduction of UTS,joint efficiency and%elongation (except 1500 rpm) with compare to that of BM. The reason may be similar as described for impact strength analysis part.The other probable reason may be supported by the study by Moshwan et al. [33] The joint prepared at TRS of 1000 rpm,1500 rpm and 2000 rpm shows a UTS of 341 MPa, 354 MPa and 282 MPa respectively with a joint efficiency of 82%, 84% and 68%having % elongation of 7.05, 7.8 and 6.95. So. This implies that, as the TRS increases from 1000 rpm to 1500 rpm keeping TS and TTA fixed the property increases and reduces thereafter. This may be due to the better homogeneous structure of the weld zone up toTRS of 1500 rpm at the ideal condition.The ideal condition is in terms of smooth material flow which leads to better particle distribution at the weld zone.The combination of fixed TS and TTA with TRS from 1000 rpm to 1500 rpm may have facilitated the optimum heat input in the weld zone to plasticize the material to a certain level for easy and smooth flow of the material. On the other hand, this ideal condition may not be in the picture for higher heat input at TRS of 2000 rpm and results in reduction of the values.Moreover,there is high chances of oxidation in the weld surface at high heat input which can make the surface brittle and crack may initiates easily from the weld surface at the time of testing and the samples break early. The analysis can be more fruitfully supported by previous literature showing the influences of TRS on tensile strength [29].The higher elongation at TRS of 1500 rpm compared to BM may be due to the presence of more abraded particle. This brings more ductility to the weld zone bt reducing the stress intensity in the structure. It is also a well-established fact that the presence of smaller size particle enhances the mechanical property in AMCs[34].
3.3.4. Tensile fracture analysis
The fractographic images of the tensile fracture samples along with their different representative views are shown in Fig.11.Two different views (top & side view) of each fractured samples along with the close view of fracture surface of AS are shown for the better understanding of the fracture mode. All the samples of a particular welding break almost at a similar site in the weld zone.It can be observed from the top and side view of tensile fractured sample that the all the welded sample breaks almost at a fixed distance in the either side of weld centreline and near to the TMAZNZ transition zone.Where,the sample welded at 1000 rpm breaks near the AS and the samples welded at 1500 rpm and 2000 rpm breaks near to the RS.This may be due to the fact that during FSW some amount of bigger size particle shifts towards the TMAZ-NZ transition zone. The accumulation of bigger size particle in this region makes it a weaker site compare to the NZ and the sample breaks in this site under tensile loading.The close view of fracture surface shows that the crack initiates at the weld bead surface and propagate through the NZ-TMAZ interface and ends at the untouched area at the bottom of the plate. The fractograph of BM shows dimple like structure having some particles resides inside the void. This indicates that the BM samples have been failed in mixed mode under tensile loading due to the presence of high amount of particles uniformly distributed in the matrix phase.The fractograph of 1000 rpm and 1500 rpm also shows very similar observation and thereby confirming the more or less similar mode of failure of the samples. This can also be supported by the stressstrain plots shown in Fig.10. On the other hand, the fractographic image of the sample at 2000 rpm shows flat surfaces.This indicates that the sample fractured in a fully brittle manner.This may be due to the improper material flow and variation in particle distribution which led to the disorientation of grains and increases the dislocation density which results in transgranular fracture of the sample under tension.
4. Conclusion
In the current research work, an effort has been made to investigate the role of varying TRS in the characterization of NZ in terms of microstructure and particle distribution and its consequences on the mechanical property evolution. A detailed quantitative analysis of particle distribution in the NZ has been studied in terms of total amount of particle present,average particle area and total area occupied by the particle in the matrix. Thereafter, the effect of variation in particle distribution in terms of mechanical property change at different TRS has been studied extensively.The major findings of the study are concluded below:
a) The macrostructural analysis reveals defect free welding at different TRS. The microstructural analysis shows uniform distribution of particle in BM as well as in different spots on NZ at varying TRS.More uniform shape of the particle can be observed at NZ (1000 rpm and 1500 rpm) compared to BM owing to the breaking of particles.
b) The distribution of particle is more prominent along the vertical direction compared to the horizontal direction of the nugget for all TRS. The migration of particles towards the TMAZ-NZ transition zone has been also encountered at TRS of 2000 rpm.
c) Study shows that the hardness of NZ varies from top to bottom of the NZ for all TRS.The impact strength of 1000 rpm and 1500 rpm remains close to that of BM while at 2000 rpm shows deduction. The samples at 1000 rpm and 1500 rpm shows higher joint efficiency compare to 2000 rpm. While,the elongation at 1500 rpm is higher compare to that of BM.The fractographic analysis evident mixed mode of failure for BM, 1000 rpm and 1500 rpm, where samples of 2000 rpm fails in brittle mode.
d) Overall, the study reveals that the sample welded at TRS of 1500 rpm keeping the TS and TTA fixed at 1 mm/s and 2°shows better result followed by the samples welded at 1000 rpm for all the analysis compare to 2000 rpm.
Acknowledgment
The authors would like to acknowledge Ministry of Human Resource, Government of India for providing necessary funding through scholarship to carry out the research activities.The authors would also like to acknowledge DWA ALUMINUM COMPOSITES USA and MSE and ACMS Department, IIT Kanpur for providing plates for the experiment and necessary facilities to conduct the tests respectively.
杂志排行
Defence Technology的其它文章
- Defence Technology
- An air cavity method for increasing the underwater acoustic targets strength of corner reflector
- Enhancing the explosive characteristics of a Semtex explosive by involving admixtures of BCHMX and HMX
- Modeling and realization of real time electronic countermeasure simulation system based on SystemVue
- Numerical investigation of dynamic interaction with projectile and harmonic behaviour for T-finned machine gun barrels
- Anti-follower jamming wide gap multi-pattern frequency hopping communication method