An investigation of the L-shell x-ray conversion efficiency for laser-irradiated tin foils
2020-05-06DavidBAILIECormacHYLANDRajSINGHStevenWHITEGianlucaSARRIFrancisKEENANDavidRILEYStevenROSEEdwardHILLFeiluWANG王菲鹿DaweiYUAN袁大伟GangZHAO赵刚HuigangWEI魏会冈BoHAN韩波BaoqiangZHU朱宝强JianqiangZHU朱健强andPengqianYANG杨朋千
David BAILIE,Cormac HYLAND,Raj L SINGH,Steven WHITE,Gianluca SARRI,Francis P KEENAN,David RILEY,Steven J ROSE,Edward G HILL,Feilu WANG (王菲鹿),Dawei YUAN (袁大伟),Gang ZHAO (赵刚),Huigang WEI (魏会冈),Bo HAN (韩波),Baoqiang ZHU (朱宝强),Jianqiang ZHU (朱健强) and Pengqian YANG (杨朋千)
1 Centre for Plasma Physics,School of Mathematics and Physics,Queen’s University Belfast,Belfast,BT7 1NN,United Kingdom
2 Astrophysics Research Centre,School of Mathematics and Physics,Queen’s University Belfast,Belfast,BT7 1NN,United Kingdom
3 Plasma Physics Group,Blackett Laboratory,Prince Consort Road,London,SW7 2AZ,United Kingdom
4 Key Laboratory of Optical Astronomy,National Astronomical Observatories,Chinese Academy of Sciences,Beijing 100012,People’s Republic of China
5 Department of Astronomy,Beijing Normal University,Beijing 100875,People’s Republic of China
6 Shanghai Institute of Optics and Fine Mechanics,Chinese Academy of Sciences,Shanghai 201800,People’s Republic of China
Abstract
Keywords: conversion efficiency,laser plasma x-ray sources,laboratory astrophysics
1.Introduction
Laser plasma x-ray sources have found widespread application in areas such as laboratory astrophysics,inertial fusion physics and warm dense matter research.They have been used as probes,as in x-ray Thomson scattering [1,2] and absorption spectroscopy[3]or as heating sources as in inertial confinement fusion capsules [4],shock drive experiments [5] and laboratory astrophysics experiments,including to create a highly photoionised plasma [6].Many experiments have been performed to date with the aim of producing multi-keV x-ray sources.These experiments include work on single line or line group sources such as K-shell emission lines [7–10].They also include work on multiple line group emission from L-shell transitions[11,12]and broad band M-shell emission [13].A wide variety of elements have been investigated,depending on whether an intense narrow-line source or broad band quasi-continuous source is required.The duration of the x-ray emission,the conversion efficiency of laser energy into x-rays,and the dependence of conversion efficiency on foil thickness have all been investigated.The initial conversion efficiency of laser light into primary x-ray emission is very important in the aforementioned applications.In indirect drive ICF,the compression efficiency will depend on high conversion of the lasers to a broad spectrum of sub-keV x-rays within a Hohlraum[14].For x-ray Thomson scattering applications (e.g.García Saiz et al [15]) the cross sections are low(of order 10-25cm2)and so a high efficiency of narrow bandkeV K-shell line radiation is desirable.For some applications we wish to irradiate a sample with keV x-rays to achieve uniform heating at high density(e.g.Glenzer et al[16]).In this case L-shell emission has proved useful.In addition to this laboratory astrophysics experiments where we wish to preferentially photo-ionise inner shell electrons can make good use of L-shell sources,filtered to remove softer x-rays (e.g.White et al[17]).The more intense we can make such sources,the closer we can come to typical astrophysical photo-ionisation parameters.
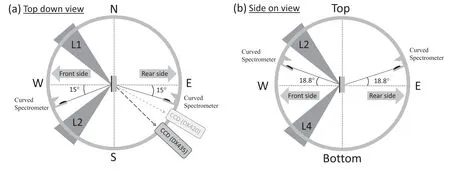
Figure 1.A schematic of the experimental setup,with the Sn foil target placed at the centre of the spherical chamber,(a)looking from the top and(b)from the side.The beam numbers visible from the two directions are marked on the figures.Two curved quartz crystal spectrometers with image plates are on the front and rear sides of the target,at angles of 15°to the horizontal axis of the experiment(indicated by the line WE).Two flat Si crystal spectrometers with CCDs are placed at variable angles in the horizontal plane.
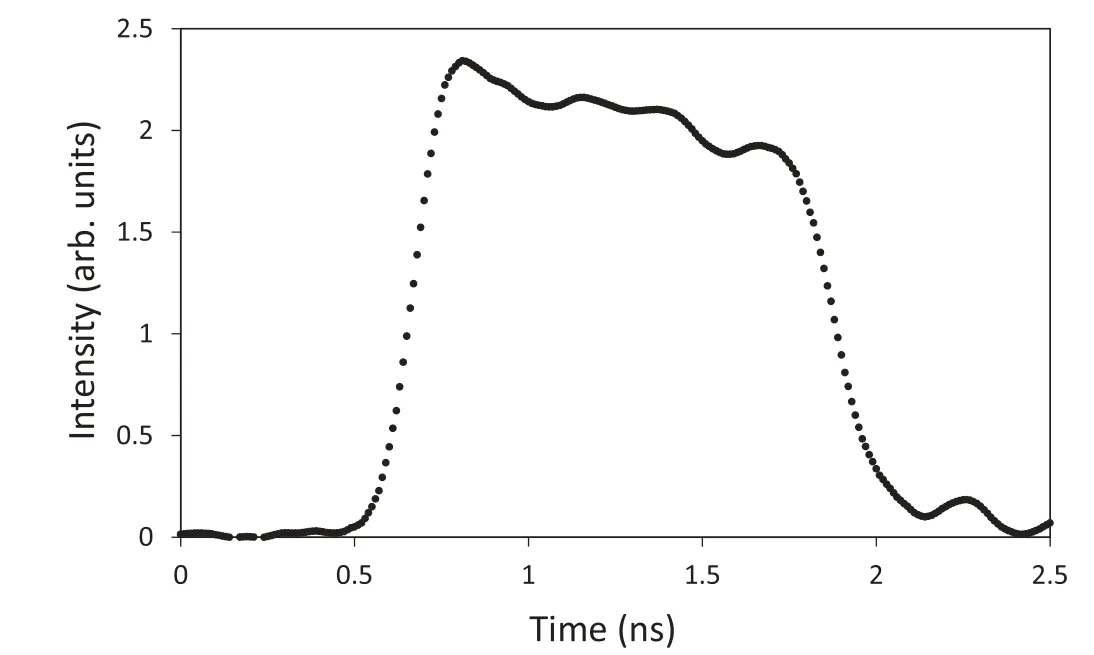
Figure 2.Typical pulse shape for the nominal 1 ns flat topped pulse.
Much of the above research has been focused on studies of bulk targets where the emission is measured from the laser irradiated side of the sample.However,in some applications,the experimental geometry may require the utilisation of the x-ray emission out through the non-irradiated side of a thin foil[12,17].This is particularly the case where we are employing the x-ray flux to heat a sample which must then be placed close to the source.In this paper we discuss an experimental setup where we take measurements on both sides of a thin foil target,but concentrate on the non-laser irradiated side.
Our paper is organised as follows.Details of the experimental setup including diagnostics are provided in section 2,while the data analysis is covered in section 3.Section 4 contains the results and discussion,and finally in section 5 we provide some suggestions for future experimental campaigns,based on our findings.
2.Experimental setup
The experiment was conducted at the Shenguang II laser facility [18,19] in November and December 2017.A schematic of our experimental setup is shown in figure 1.A total of 4 overlapping laser beams was used to deliver up to 1050 J of energy at a wavelength of 351 nm on the target.The foils were Sn of thickness 400–800 nm coated onto CH layers of 2–30 μm for mechanical support.Specifically,in our experiment we have investigated the L-shell emission(~3.3–4.4 keV),for irradiation with 3ω(351 nm)laser pulses with both 1 and 2 ns FHWM duration at intensities of~(0.6–3) × 1015W cm-2.In figure 2 we show a typical pulse shape for the 1 ns pulse.Targets were placed at the centre of the spherical chamber,and the diameter of the focal spot of the laser on the target foil varied between 200 and 500 μm,with a flat-top temporal profile.This was the main mechanism for varying the intensity,although we also varied the incident energy for a fixed focus for some of the data,as discussed below.
L-shell emission spectra between 3.3 and 4.4 keV were recorded using two convex curved quartz (10–10) crystal spectrometers with the signals recorded on image plate.These spectrometers were both placed to view the target from 18.8° above the horizontal.One was set to view the front (laser irradiated) side of the foil at 15° from the horizontal axis of the experiment (indicated by the line WE in
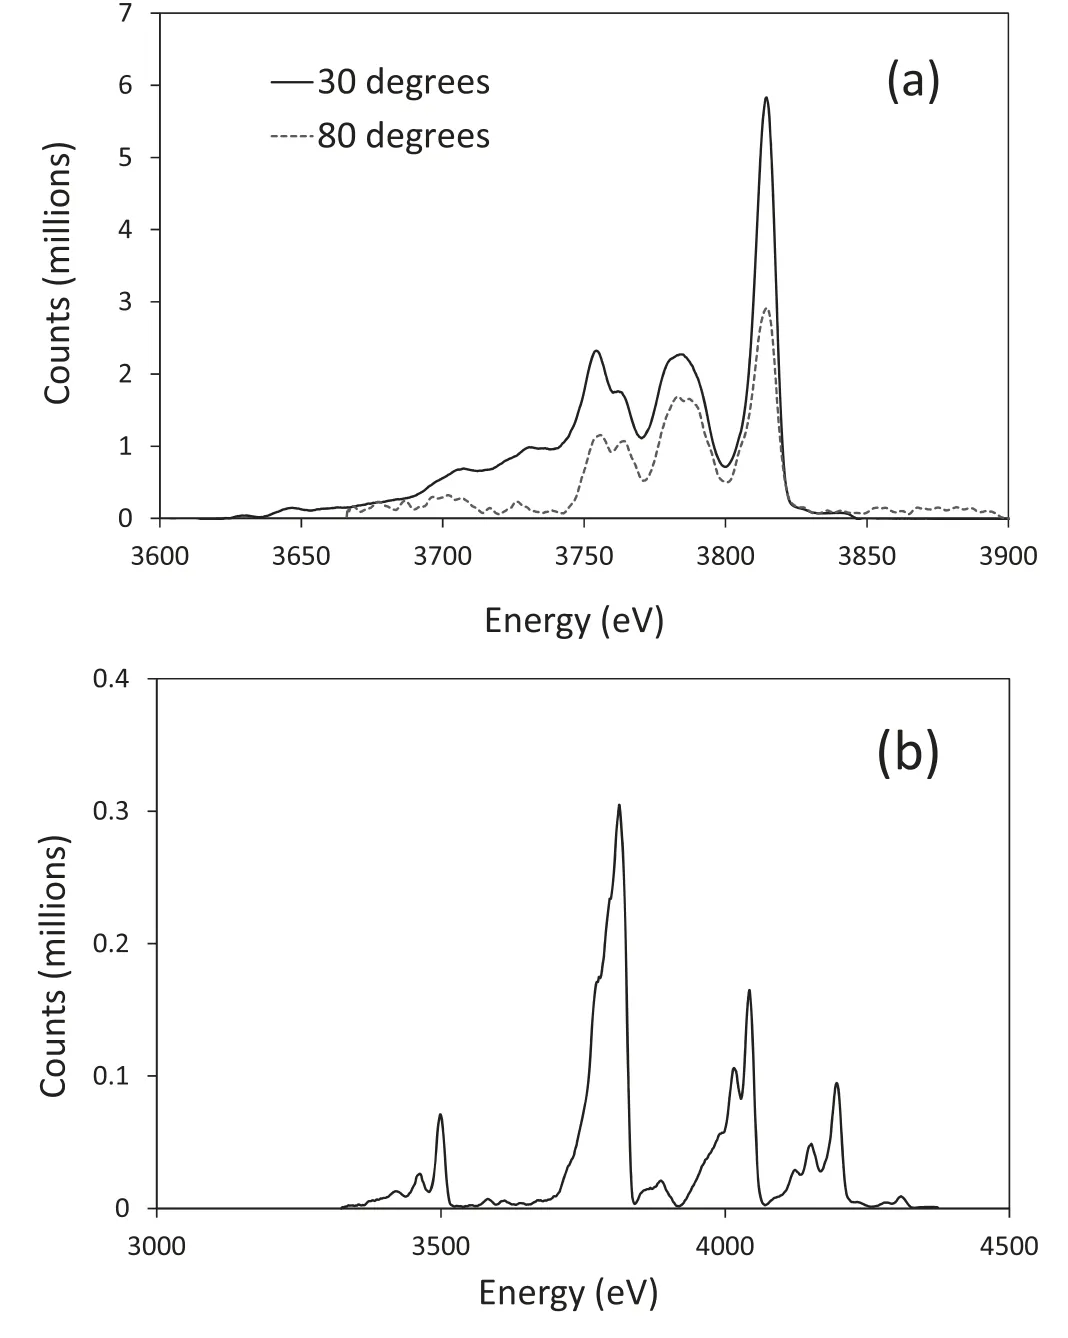
Figure 3.Sample spectra showing the Sn L-shell emission obtained by(a)the flat Si crystal spectrometer coupled to a CCD for both 30°and 80°viewing,(b)the curved quartz crystal spectrometer coupled to image plate for the same shot as shown in(a)for 30°viewing.The spectra are all corrected for filtering which consisted of 40 μm Ti on both curved spectrometers and 51.5 ± 0.5 μm Al,50 μm Kapton,25 μm Be on the flat Si crystal spectrometers.This error in the Al on the flat Si crystal spectrometers provides the key error in the data and is folded into the error bars of the analysis.
In figure 3 we plot typical spectra taken with both the CCD,Si crystal and image plate detector based spectrometers,which clearly show the different spectral regions covered.In previous work by White et al [17] the wavelengths of the Sn L-shell spectral features were calculated by comparison with calibration shots using K-shell emission from Cl and K targets,and we used these for the features detected in the present data.The sensitivity of the CCD based spectrometers is relatively straightforward to calibrate,as the detection efficiency of the CCD is known and can be tested with the use of a calibrated55Fe source.This also gives the A–D conversion,i.e.the number of counts per photon absorbed.The crystal reflectivity can be calibrated by the procedure described in Valle Brozas et al [21],and values similar to the calculated ones for Si are obtained.Cross calibration was then possible by placing the CCD based spectrometers at 30° from the target normal,very similar to the angle of the fixed spectrometers.
Since we know the distances from source to Si crystal and CCD,as well as the calibrations of the CCD and crystal,we can calculate the number of photons emitted per steradian in the spectral range covered by the line group in figure 3(a)(roughly 3.6–3.85 keV).From figure 3(b),we can determine what fraction,F,of the total L-shell emission is represented by this limited spectral range sample and thus estimate the photons per steradian emitted into the whole L-shell spectrum.This fraction was found to be relatively stable from shot-to-shot (0.51 ± 0.03) and not sensitive to the thickness of the Sn layer or intensity.This latter calculation is,however,only strictly valid for data where the CCD spectrometer(set to 30°) is close to the same angle-of-view as the image plate based spectrometers (with an effective angle of 23.9°,implying the cosine differs only by 5.6%).If not the ratio of intensity between the line groups may vary with angle-ofview due to effects of opacity.figure 1),the other to view the rear side of the foil.In each case the combined horizontal and vertical angles meant the spectrometers viewed the foils at an effective angle of 23.9°from the target normal.The resolution of these spectrometers was dominated by the resolution of the image plate detectors,and values of E/ΔE ~250 were achieved.The type of image plate used was 112 μm thick layer of Fuji BAS-SR (density = 3.07 g cm-3),BaF(Br,I):Eu2+,resolution 109 ± 2 μm [20],with the image plate scanner set to 25 μm resolution.In addition to these fixed spectrometers,we employed two spectrometers with flat Si (111) crystals coupled to x-ray CCDs (Andor DX420 and an Andor DX435).These latter two spectrometers recorded a smaller spectral range of L-shell emission but were able to be moved to different viewing angles in the experiment,although they always viewed the targets in the horizontal plane.The Si crystals and CCD detectors have a known efficiency and data from these were used to calibrate the fixed spectrometers as described below.The resolution of the flat crystal spectrometers was dominated by source size and was typically E/ΔE ~ 400–800.
3.Data analysis
For the CCD data our procedure is to correct the measured number of counts (Nccd) to account for the energy dependent transmission of the filters and the quantum efficiency of the CCD,again a function of photon energy.By partially shielding the CCD from direct diffraction,we were able to establish that the background level coming from crystal fluorescence was typically 100 counts per pixel,compared to peaks of over 10 000 counts per pixel for the data.In the x-ray regime we know that 3.65 eV of absorbed energy is needed per electron–hole pair [22],and we have calibrations of the number of counts per photon in the keV photon regime from photon counting measurements with K–α sources.The intensity,I,in photons per steradian is given by:

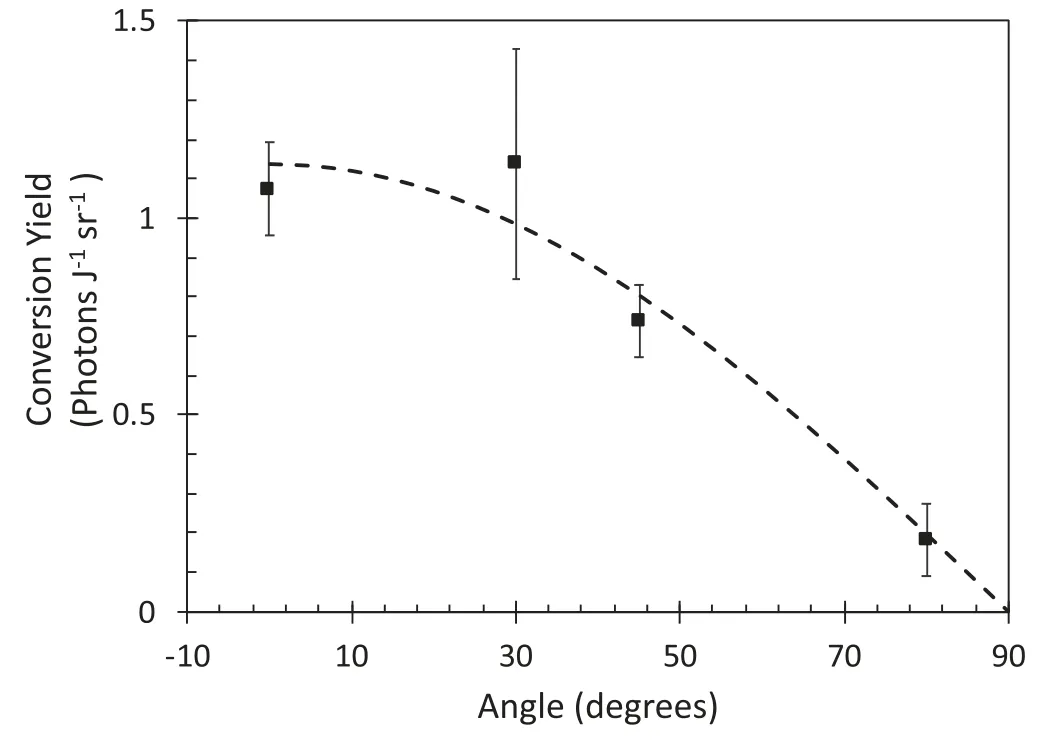
Figure 4.X-ray conversion yield plotted as a function of flat spectrometer position angle for an average of focal spot sizes 300,400 and 500 μm at different target thicknesses.The dependence on Sn thickness and intensity is weak (here we use data with intensity spread between 3×10¹⁴ and 1.3×10¹⁵ W cm-2).See text and further data for details on Sn thickness and intensity.The laser pulse duration was 1 ns.
where Qccdis the quantum efficiency of the CCD (a function of the photon energy,E).T(E)is the filter transmission(again a function of photon energy,E),γ is the number of counts per photon and Ω the effective solid angle of collection of the spectrometer.This is given by Ω =Rcw Dwhere Rcis the integrated reflectivity of the crystal,w the width of the CCD detector and D the distance from source to detector surface.Having determined the photons emitted per steradian we are then in a position to calculate the conversion efficiency to x-rays in the L-shell emission by comparison with the measured laser energy on target.
4.Results and discussion
In figure 4 we plot the x-ray conversion yield,into the line group recorded on the CCD based spectrometer,spanning 3.69–3.85 keV.This is presented as a function of angle,defined as being relative to the normal to the rear side of the foil.As expected,there is fall off in yield with increasing angle.We have fitted the data to a simple cosine dependence that might be expected from a black body emitter.As we can see,the cosine fit is consistent with the average to within the statistical error bars at all measured angles.In calculating the total emission efficiency,for subsequent data,we have used the angular dependence of this latter model as a basis to extrapolate from results measured at a particular angle.
At 30° we have the highest variability with a spread of roughly a factor of two between the highest and lowest conversion yield and an average of 1.11 ± 0.26 × 10¹²photons/sr/J where the error bar is the standard deviation,which is not untypical of laser-plasma experiments.If we take the cosine fit as giving the variation with angle,we can use this to estimate that the efficiency of conversion to the line group from 3.69 to 3.85 keV is approximately 0.46% ± 0.11%.The statistical spread dominates over expected estimates of the individual error bars for data,which are in turn dominated by an estimated±10%systematic error in the crystal calibration.If we make the approximation of taking the ratio of the first line group to the total from the image plate data and apply it to all angles,we would estimate a total conversion efficiency of around 0.9% ± 0.2%.
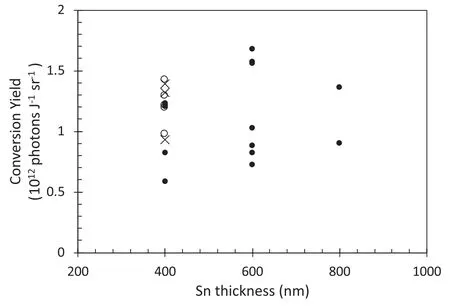
Figure 5.Variation of the x-ray conversion yield with thickness of the Sn foil for pulse duration 1 ns and flat/curved crystal spectrometers at an angle of ≈30°.The crosses are for spot size 300 μm,the solid circles are for spot size 400 μm and the circles for 500 μm focus.Data is for a single line group centred at 3.69–3.85 keV.
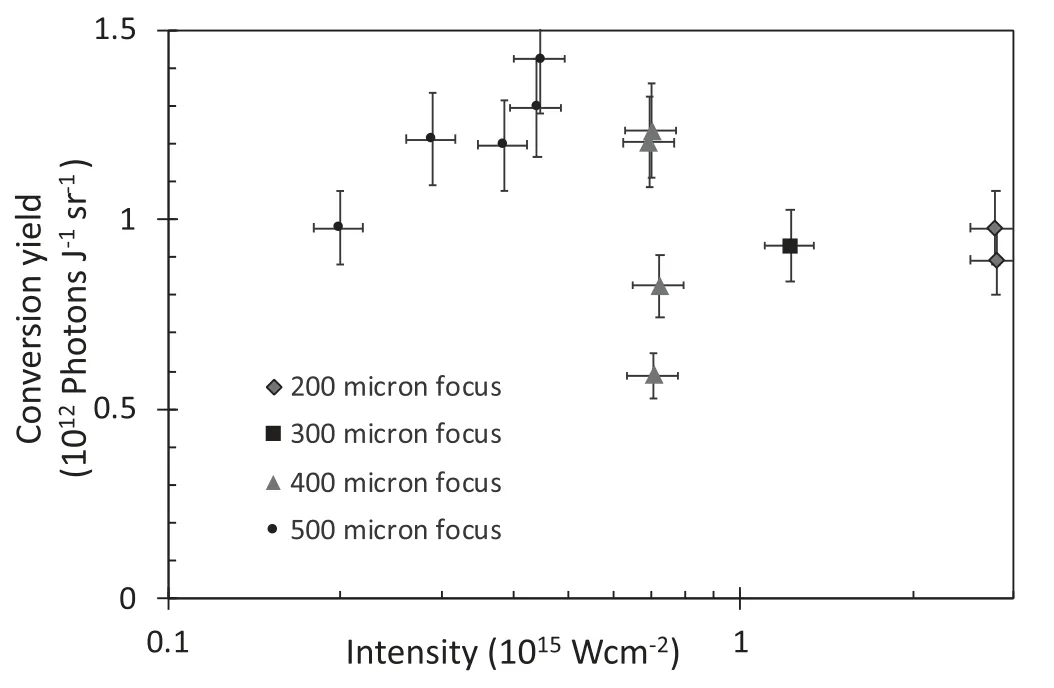
Figure 6.X-ray conversion yield plotted as a function of intensity,with different focal spots(data taken from CCD based spectrometer).The laser pulse duration was 1 ns and the Sn thickness was 400 nm for all shots.Error bars are from estimated uncertainty of ±10% in laser energy and similar error in filter and crystal efficiency.
The measured variation of the total conversion yield,on the thickness of the Sn foil is plotted in figure 5.An inspection of the figure indicates that whilst there is shot-toshot variation,there is no clear dependence on the thickness for values in the range of 400–800 nm.The average conversion yield overall,for the 400 μm focus,is 1.15 × 10¹²photons/sr/J with a standard deviation of about 30%.For the same focus,the individual average conversion efficiencies into the single line group,for the three Sn thicknesses agree to better than 10% with each other.The laser energies for this data set were all within 7% of an average of 907 J.
By utilising focal spot sizes between 200 and 500 μm we can vary the intensity and our results are shown in figure 6.
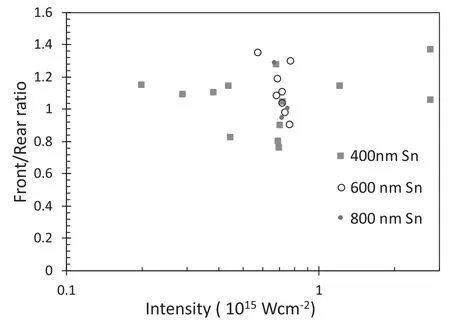
Figure 7.Ratio of L-shell emission for front and rear sides of the foil as a function of irradiance.We see that the ratio is close to unity.
We can see that the yield quickly rises to a peak at approximately 5 × 10¹⁴W cm-2but then falls slowly as the intensity increases.This behaviour is expected for the following reasons.The x-ray emission depends on collisional ionisation and excitation processes that are highly temperature dependent.At low irradiance the plasma has not reached a high enough temperature to efficiently emit in the keV range.At higher intensities,the temperature is high enough but the efficiency of inverse bremsstrahlung absorption drops and this is expected to be the dominant absorption mechanism for our short wavelength,long pulse laser parameters [23].Furthermore,as discussed by Riley et al [9] at higher intensity,a higher fraction of the laser energy absorbed is converted to kinetic rather than thermal energy,leading to a slow decrease in conversion efficiency.
Finally,since we have fixed spectrometers viewing at 23.8° to both the front (i.e.laser irradiated),and rear sides of the foils,we can determine the ratio of emission from either side of the foils and the results are shown in figure 7.We note that although the ratio is close to unity,the rear(non-irradiated)side emission is typically around 10%–15% weaker.This is a plausible result because as the heat front generated by the laser irradiation starts to burn through the Sn layer,the emission generated to the rear side needs to pass through a cooler absorbing plasma.By contrast,on the front side,the emission passes through a hotter,more ionised plasma with a large velocity gradient,reducing opacity to the L-shell emission.
A summary of the experiment is that we have measured a conversion efficiency of approximately 0.46% for the line group centred around 3.8 keV.Full spectra suggest the conversion overall into L-shell is of order 1%if the emission ratio between the single line group (3.69–3.85 keV) and multi line groups (3.3–4.4 keV) is constant at different viewing angles.However,the ratio between groups may vary with angle as a result of the changing effective opacity.The irradiation was with 1 ns laser pulses in the third harmonic (351 nm) and results are broadly in line with data from previous experiments[12,17].The angular variation appears to be approximated reasonably well by a simple cosine fit.There is no clear evidence for an optimal thickness for the Sn layer between 400 and 800 nm.Furthermore,we see only a modest difference in the ratio of emission from the front to the rear of the foil.
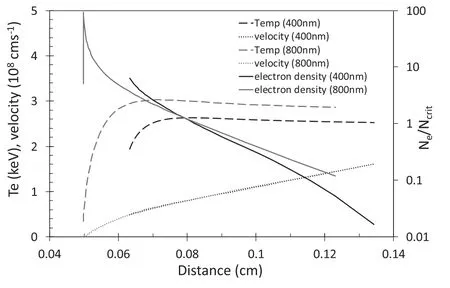
Figure 8.HYADES simulation for two cases,one with a 400 nm Sn layer,the other 800 nm.In both cases we show only the Sn plasma and not the CH onto which it is coated,and used 40 cells for the Sn layer.The laser intensity is 5 × 10¹⁴ W cm-2,the pulse is modelled as a 1 ns full-width-at-half-maximum (FWHM) flat-top pulse,and results are shown at the centre (1.3 ns on figure 2) of the pulse.
The reason for these findings can be considered.One possibility is that the laser only burns though around 400 nm or less of Sn,so that adding extra thickness does not increase the emission and the cold layer of additional Sn is only a few hundred nm thick,and does not significantly attenuate the emission to the rear side of the foil.This would explain why there is little or no dependence on the thickness of the initial layer.We have tested this hypothesis with hydro-dynamic simulation using the HYADES radiation-hydrodynamic code[24].This has multi-group radiation transport,and we have used it with 50 photon energy groups spaced logarithmically between 0.03 and 20 keV.We have assumed a laser intensity of 5 × 10¹⁴W cm-2and a 1 ns flat-top pulse shape.The Sn layer is modelled with 40 cells and the CH layer with 60 cells.As we can see in the figure below,the expansion is expected to exceed the lateral size of the focal spot.For this reason,we have used a 1D spherical geometry with a radius of curvature of 500 μm,which is similar to the focal spot for most data.This means that close to the surface,we have expansion similar to 1D planar but further out,the density is allowed to fall off which is more in keeping with the actual experiment.
In figure 8 we show the HYADES profile of the Sn layer at the peak of the incident 3ω laser for starting Sn layers of 400 nm and 800 nm.Since the profiles are generated at the same time (the peak of the pulse),the fact that a higher density,cooler region still exists for the 800 nm layer profile shows that burn-through of the layer is not as complete as for the thinner layer,as expected.The 800 nm foil does burnthrough later in the pulse,for example,at the end of the flattopped portion of the pulse profile,the 800 nm Sn layer is all at above 2 keV.Consequently,a limited burn-through is unlikely to be more than a partial explanation as the lack of variation with layer thickness.

Figure 9.(a) Simulated spectrum for a 400 nm Sn foil case at the peak of the laser pulse,compared to an experimental spectrum.The FLYCHK simulation is initiated at LTE but allowed to evolve with non-LTE time dependent atomic kinetics.The temperature and density as well as plasma size are taken from the HYADES simulation.(b) Simulated total L-shell emission between 3.3 and 4.4 keV.
In addition to hydrodynamic simulations we have used the FLYCHK code[25]to model the L-shell emission based on the temporal history of the Sn layer.We do this by dividing the plasma into four zones.The reasons for this are,firstly,since there are gradients of density and temperature within the Sn layer,it is not accurate to model the emission simply using the overall averages.On the other hand,modelling 40 separate plasmas,based on the hydro-code cells has the problem that opacity effects would not then be properly accounted for since FLYCHK is a zero-dimensional code.Additionally,the opacity is likely to be strongly affected by Doppler decoupling effects caused by the strong velocity gradient,which we can see from figure 8 is of the order 109s-1.This means that with a single layer,we would overestimate the opacity.Thus division into four zones that are effectively considered as Doppler decoupled is a compromise,based on the estimated line-widths of the strongest lines,and the velocity gradients,that allows us to still account for,in a coarse manner,the gradients in plasma conditions in determining average ionisation and excitation of the L-shell.
In figure 9 we show two FLYCHK outputs,the first is a simulated integrated spectrum sample for a 400 nm Sn layer compared to a sample experimental spectrum.The features broadly match those seen experimentally,but there are some mismatches in line positions.This is perhaps not so surprising as,in order to keep databases manageable,for higher Z materials,FLYCHK uses schematic energy levels,generated from hydrogenic levels with screening constants,rather than detailed results of relativistic atomic physics calculations.In figure 9(b)we have shown the simulated temporal emission of the total L-shell between 3.3 and 4.4 keV.As we can see,we predict a duration of emission of about 0.3 ns FWHM.During the experiment we were unable to obtain streak camera data,but note that this emission period is shorter than the approximately 0.5 ns seen in previous work at laser wavelength 532 nm [17]with thinner(217 nm)layers.The simulations predict an overall conversion efficiency into L-shell emission of approximately 7%,which is somewhat higher than our experimental observation.We should however caution that the simulations make some approximations in both the hydrodynamic and spectral simulations as described above.
As noted above,the reason for the lack of dependence on foil thickness appears to be only partially a result of limited burn-through of the Sn layer.Instead the lack of dependence is perhaps more connected to the fact that,even with Doppler decoupling,there is predicted to be a larger opacity for the Sn L-shell lines,with τ ~ 5-10 for the strongest lines.Thus,we might conclude that,for the range of the layer thickness employed here,we create a plasma slab with broadly similar range of conditions and that the amount of material heated is not a controlling factor since emission from the core of the Sn plasma is suppressed by strong opacity anyway.A cosine dependence,is what we would expect from an optically thick slab close to black body conditions.
In conclusion,we have shown that L-shell Sn can form the basis of an efficient laser-plasma x-ray source in the 3.3–4.4 keV spectral region.As might be expected,the x-ray conversion efficiency of ~1%is higher than generally seen in single K-shell line sources.Modelling of the source for such a high-Z plasma is non-trivial,with radiation transfer likely to play a significant role in the evolution of the plasma density and temperature.The atomic kinetics of the plasma are also strongly dependent on the opacity of the lines,with Doppler decoupling likely to also play a major role.For this reason we use our simulations to confirm the plausibility of the experimental result rather than being definitively predictive.
5.Future experimental campaigns
It is evident that more work could be undertaken to explore a wider range of thicknesses for the Sn foil,in particular,to investigate the total emission as the thickness is decreased.Our previous experiments with thinner foils[17]were carried out at 532 nm and hence are not directly comparable.It would also be advantageous to obtain data on the temporal profile of the emission as a function not only of thickness but also intensity.Since one of our primary purposes is to create a keV x-ray drive for photoionisation experiments,it would be useful to deploy additional diagnostics to measure the softer x-ray component,especially through the rear side of the target when the source x-rays have passed through the thick CH layer.The purpose of this layer is to suppress the softer x-ray component and thus create a source with a higher effective radiation temperature[17,26].By controlling the thickness of CH we can,in principle,control the ratio of outer-shell to inner-shell photoionisation.To do this effectively,an array of calibrated and filtered diodes could be used to measure the emitted spectrum.
Acknowledgments
This work was supported by the UK Science and Technology Facilities Council,National Natural Science Foundation of China(No.11573040)and Science Challenge Project(No.TZ2016005)and The Royal Society International Exchange (No.IE161039).The authors gratefully acknowledge the expert support from the VULCAN laser facility and from the Shanghai Institute of Laser Plasma.We also thank the staff of the SG-II laser facility.
猜你喜欢
杂志排行
Plasma Science and Technology的其它文章
- Preliminary design of high power magnet converter for CRAFT
- Design and control of coaxial switching system for ion cyclotron wave resonance heating system of EAST
- Fast radial scanning probe system on KTX
- Estimation of plasma density perturbation from dusty plasma injection by laser irradiation on tungsten target in DiPS
- Investigation on plasma characteristics in a laser ablation pulsed plasma thruster by optical emission spectroscopy
- A two-dimensional air streamer discharge model based on the improved Helmholtz equation at low temperature and sub-atmospheric pressure
