Volatility Estimation of Multivariate ARMA-GARCH Model
2020-03-16PengfeiXieJiminYeandJunyuanWang
Pengfei Xie, Jimin Ye and Junyuan Wang
(School of Mathematics and Statistics, Xidian University, Xi’an 710071, China)
Abstract: GARCH models play an extremely important role in financial time series. However, the parameter estimation of the multivariate GARCH model is challenging because the parameter number is square of the dimension of the model. In this paper, the model of structural vector autoregressive moving-average (ARMA) with GARCH is discussed and an efficient multivariate impulse response estimation method is proposed. First, the causal structure of the model was identified and the independent component of error term vector was estimated by DirectLiNGAM algorithm. Then, the relationship between conditional heteroscedasticity of the independent component of error term vector and that of residual vector was constructed, and the estimation of the impulse response of conditional volatility of multivariate GARCH models was translated to the estimation of the impulse response of error term vector. The independency among the independent components was translated to the impulse response estimation of the univariate case and the causal structure was maintained. Finally, the proposed estimation method was used to estimate the volatility of stock market, which proved that the method is computational efficient.
Keywords: structural autoregressive moving-average; multivariate GARCH; independent component; causal structure; volatility
1 Introduction
Forecasting volatility of financial assets is a crucial research direction in the field of financial measurement that the accurate measurement of volatility is vital in options pricing and risk management. The autoregressive conditional heteroscedasticity (ARCH) model is one of the most important volatility models for financial time series proposed by Engle[1]and extended by Bollerslev[2]to the generalized ARCH (GARCH) model.
Although the univariate GARCH models can well characterize the volatility of financial time series, it is difficult to study multivariate time series. Bollerslev et al.[3]proposed an extension model of the univariate GARCH, the VEC model, while it is difficult to estimate multiple parameters of high dimensional matrix or guarantee the constraint conditions of positive definite of conditional covariance matrix. Baillie[4]developed conditional correlation coefficient GARCH (CCC-GARCH) models, in which the conditional correlations are constant. This restriction greatly simplifies the estimation but it is not applicable to real financial data. The BEKK model of Caporin and Mcaleer[5]can well describe the volatility of multivariable and guarantee the positive qualitative of covariance matrix, while it has a limitation on model recognition. Considering the interaction between conditional variances, Tsukuda[6]applied the DCC-GARCH model and the dynamic conditional variance decomposition method to analyze the degree of integration of East Asian and global bond markets. Chen[7]proposed the orthogonal GARCH (O-GARCH) models by using principal component analysis (PCA) technology to extract the principal component. Wu and Yu[8]formed the ICA-GARCH models that decompose multivariate time series using independent component analysis (ICA), whose results show that the ICA-GARCH models are more effective to estimate volatilities than the PCA-GARCH methods. Broda[9]used the ICA method to extract the independent components from the multidimensional financial asset returns. García-Ferrer et al.[10]proposed the GICA-GARCH model which combines the ICA and multivariate GARCH (MGARCH) models. Jin[11]imulated the dynamic heterogeneity covariance breakdown in the MGARCH model by a random component. Francq[12]proposed the multivariate log-GARCH-X model. Karanasos[13]applied the vector AR-DCC-FIAPAPARCH model to estimate the long-term volatility correlation and asymmetric volatility response of stock market daily returns. Almeida[14]analyzed the trade-off between the feasibility and flexibility of the MGARCH model. Dua[15]used the vector autoregressive-multivariate GARCH-BEKK model to study the correlation between Indian and American stock markets. Hyvarinen et al.[16]proposed a linear non-Gaussian acyclic model (LiNGAM) based on the structural equation model, which used the ICA method to obtain the cause effects and applied the ICA-LiNGAM algorithm as the estimation method. Tashiro et al.[17]utilized a direct method to estimate the cause effects based on the non-Gaussianity and proposed a new direct estimation algorithm named DirectLiNGAM.
Based on the combination of structural autoregressive moving-average (ARMA) model and the GARCH model, we present the ARMA-GARCH model in this paper. The relationship between conditional heteroscedasticity of the independent component of error term vector and that of residual vector was constructed. The estimation of the impulse response of conditional volatility of MGARCH models was translated to the estimation of the impulse response of the independent component of error term vector, and the causal structure was maintained.
The rest of this paper is organized as follows. In Section 2, we present the ARMA-GARCH model and demonstrate the procedure of applying impulse response of conditional volatility in multivariate volatilities modeling. In Section 3, we introduce the ICA-LiNGAM and the Direct-LiNGAM algorithms with the mean squared error (MSE) as the evaluation method of the algorithm performance. In Section 4, the specific steps of the ARMA-GARCH model parameter estimation are described. An empirical application of the model in finance is given in Section 5 and the conclusions are drawn in Section 6.
2 The ARMA-GARCH Model
2.1 Model Definition
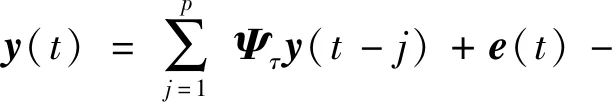
Based on the combination of instantaneous model and the ARMA model with the external influence of non-Gaussian, Kawahara[18]proposed an ARMA-LiNGAM model and presented an estimation method. The error term vectore(t) of ARMA-LiNGAM can describe the volatility of financial data well, so taking thee(t) as GARCH process, the ARMA-GARCH model is proposed in this paper. Lety(t)=[y1(t),y2(t),.…,yn(t)]T,(t=1,2,…,T) represents the observed variable over a period of time. Without loss of generality, assuming that eachy(t) has zero mean vectors, the ARMA-GARCH model is defined as
(1)
whereΨj(j=0,1,…,p) aren×nmatrices, which represent the causal effects between the variablesy(t) andy(t-j)(j=0,1,…,p). Forτ>0, the effects are general autoregressive effects from the past to the present, while forτ=0, the effects are contemporaneous. In addition,Ωj(j=1,2,…,q) are then×nmoving average coefficient matrices and the error term vectore(t) is the vector of external influencesei(t)(i=1,2,…,n). Hence, the following assumptions on theei(t) are made.
1) Theei(t) are GARCH process, i.e., eachei(t) is treated as a univariate GARCH (k,l) model
(2)

2) The instantaneous effects matrixΨ0in the model corresponds to a directed acyclic graph. The acyclicity is equivalent to the existence of a permutation matrixPwhich makesPΨ0PTa lower triangular. The acyclicity also ensures thatI-Ψ0is invertible.
From Eq. (1), we have
(3)
By multiplyingA=(I-Ψ0)-1from the left on the both sides, we can obtain
(4)
whereΦτ=AΨτ,n(t)=Ae(t), andΘj=AΩjA-1. Eq. (4) is a standard ARMA model, which can be estimated by conditional maximum likelihood[19]ofΦj(j=1,2,…,p) andΘj(j=1,2,…,q).
We calculate the residual vectorn(t) in Eq. (4) and separate the instantaneous effects matrixΨ0and the error term vectore(t) from then(t). According to the conclusion of Hyvarinen et al.[16], the non-Gaussian ofe(t) in the GARCH model and the acyclic of instantaneous effects matrixΨ0ensure thate(t) andΨ0can be uniquely identified. Therefore, the volatility structure ofn(t) can be estimated byΨ0and the volatility structure ofe(t).
Eq. (4) shows that the conditional covariance matrix ofn(t) is
(5)
whereHt=diag(h1t,h2t,…,hnt),hitis the conditional variance of theith component ofe(t) given by Eq. (2),A=(a1,a2,…,an), andaiis theith column vector ofA.
2.2 Impulse Response of Conditional Volatility
Eq. (5) indicates the relationship between conditional heteroscedasticity of the independent component of error term vectore(t) and that of residual vectorn(t). The estimation of the impulse response of conditional volatility of MGARCH models is translated to the estimation of the impulse response of the independent component of error term vector. The volatility ofΓtcan be inferred by analyzing the response of one unit shock to the system ine(t). The impulse response of conditional volatility can well describe the volatile effects of one unit shock on the system.According to Eq. (5), the impulse response of the conditional volatility of the residual vectorn(t) can be expressed as
(6)
whereRs,iis thesorder lag impulse response of theith element ine(t) after one unit shock, andΓt+s/tis the conditional covariance information set ofΓt+sat timet. According to Hafner[20], the impulse response function of the univariate GARCH (k,l) model can be obtained as follows:
(7.1)
(7.2)
(7.3)
3 Algorithms and Performance Analysis
In this section, we briefly introduce the ICA-LiNGAM and Direct-LiNGAM algorithms. Then we use MSE as the evaluation method of algorithm performance.
LiNGAM, the linear non-Gaussian acyclic model proposed by Hyvarinen et al.[16], is a variant of structural equation model and Bayesian network, which satisfies the following two conditions: 1) the adjacency matrixBcorresponds to a directed acyclic graph; 2) the components ofeare independent and non-Gaussian. Under the above non-Gaussian acyclic conditions, LiNGAM can be formally expressed as
x=Bx+e
(8)
wherexis apdimensional random vector,Bis an adjacency matrix ofp×p, andeis apdimensional non-Gaussian random noise vector.
The original solution to the LiNGAM model was proposed by Hyvarinen et al.[16]based on the ICA method, i.e., the ICA-LiNGAM algorithm, which separates the adjacency matrixBand the non-Gaussianevector from the observed datax[21]. Because of the directed acyclic graph hypothesis, the existence of a permutation matrixP∈Rp×pmakesB′=PBPTas close as possible to strictly lower triangular. Then, the causal order is obtained by combiningB′with strictly triangular characteristics. Finally, a certain pruning algorithm is used to get the final causal network. The ICA-LiNGAM algorithm relies on the selection of initial values, which may not converge to a correct solution. Shimizu et al.[22]proposed the DirectLiNGAM algorithm using the principle of residual independence, in which exogenous variables were selected on the basis of the Darmois-Skitovitch theorem[23], i.e., the judgment variable is a regression residual independent of all other variables.
Assumingxis a set of variables, the exogenous variablexecan be calculated from Eqs. (9)-(11)
(9)
(10)
(11)

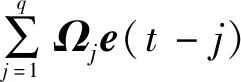
In this paper, the performance of the above algorithm is tested by simulation data and we use MSE as the evaluation indicator of causal structure model algorithm. The MSE ofBis defined as follows:
(12)

We randomly generated artificial data sets with each combination of number of variablespand sample sizeN(p=15,30,60;N=500,1000,2000,3000) by following steps.
1) We constructed an adjacency matrix with all elements equal to zero and used the Bernoulli random variable to replace each element of the lower triangle.
2) We replaced the non-zero elements in adjacency matrix by the randomly generated numbers from the interval [-1.5, -0.5]∪[0.5, 1.5] and used the generated matrix as the adjacency matrixB. We also randomly selected the noiseeifrom the interval [1, 3].
3) The values of the observed variablesxiwere generated according to Eq. (8). Finally, we randomly permuted the order ofxito make the order of observation inconsistent with the causal order. Then the DirectLiNGAM algorithm and ICA-LiNGAM algorithm were tested on the generated data sets.


dim.500100020003000150.0137050.0080450.0056250.004174300.0175150.0065820.0038970.002965600.0129570.0096420.0047860.003514
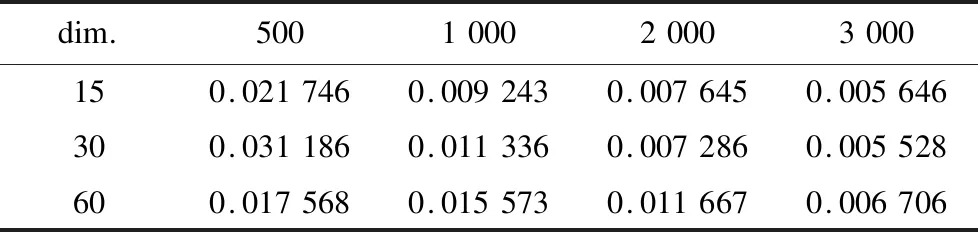
dim.500100020003000150.0217460.0092430.0076450.005646300.0311860.0113360.0072860.005528600.0175680.0155730.0116670.006706
4 Estimation of the ARMA-GARCH Model
The estimation procedure and the specific steps of the ARMA-GARCH model parameter estimation are described as follows:
1) Use the conditional maximum likelihood to estimate the autoregressive matrixΦjand the moving average matrixΘjof Eq. (4), and calculate the residual vectorn(t).
2) Use the DirectLiNGAM algorithm to estimate the causal order and calculate the instantaneous effects matrixΨ0and the error term vectore(t) :
n(t)=Ψ0n(t)+e(t)
3) Use the estimation matrixΨ0to calculate the parameters in Eq. (1) as in
Ψj=(I-Ψ0)Φj,Ωj=(I-Ψ0)Θj(I-Ψ0)-14) Use the maximum likelihood function to estimate the univariate GARCH parameters from the error term vectore(t).
5) Use Eq. (7) to estimate the univariate impulse response function for each element ine(t).
6) Use the univariate impulse response function, the matrixΨ0, and Eq. (6) to estimate the impulse response of the conditional volatility.
5 Applications in Finance
We applied the ARMA-GARCH model to estimate the volatility of stock market. The chosen indices are A share index of Shanghai stock Exchange (000002.ss), B share index of Shanghai stock Exchange (000003.ss), A share index of Shenzhen stock Exchange (399107.sz), and B share index of Shenzhen stock Exchange (399108.sz). The dataset was from September 2, 2014 to December 30, 2017, representing 1150 daily observations. The daily returnri(t) were calculated byri(t)=log(pi(t))-log(pi(t-1)), where the closing price of indexion the trading day istbypi(t). We fitted the ARMA-GARCH to the dataset, where the order (p,q) = (1, 2) was selected based on Bayesian information criteria (BIC). The ARMA (1, 2)-GARCH (1, 1) model is
y(t)=Ψ0y(t)+Ψ1y(t-1)+e(t)-
Ω1e(t-1)-Ω2e(t-2)=
Φ1y(t-1)+n(t)-Θ1n(t)-Θ2n(t)
(13)
Φ1=(I-Ψ0)-1Ψ1,n(t)=(I-Ψ0)-1e(t)
(14.1)
Θ1=(I-Ψ0)-1Ω1(I-Ψ0),ei(t)=
(14.2)
hi(t)=ωi+αi1ei(t-1)2+βi1hi(t-1)
(14.3)
The estimated parameters in ARMA (1, 2) are as follows:
Fig.1 shows the direction of the estimated instantaneous causal structure obtained by the DirectLiNGAM algorithm. 000002.ss had strong negative impacts on 000003.ss and 399108.sz, while it had a weaker positive impact on 399107.sz. 399108.sz had a strong positive impact on 399107.sz and a strong negative impact on 000003.ss, whereas 000003.ss only had a strong positive impact on 399107.sz and 399107.sz did not affect other variables.These results were justified in the Chinese stock market.
The DirectLiNGAM algorithm was used to separaten(t), obtain the estimation matrixA, and extracte(t), as shown in Fig.2. The estimated parameters in univariate GARCH (1, 1) model to eachei(t) are shown in Table 3. It can be seen from the estimated GARCH that 000002.ss, 000003.ss, 399107.sz, and 399108.sz had a characteristic of volatility clustering.
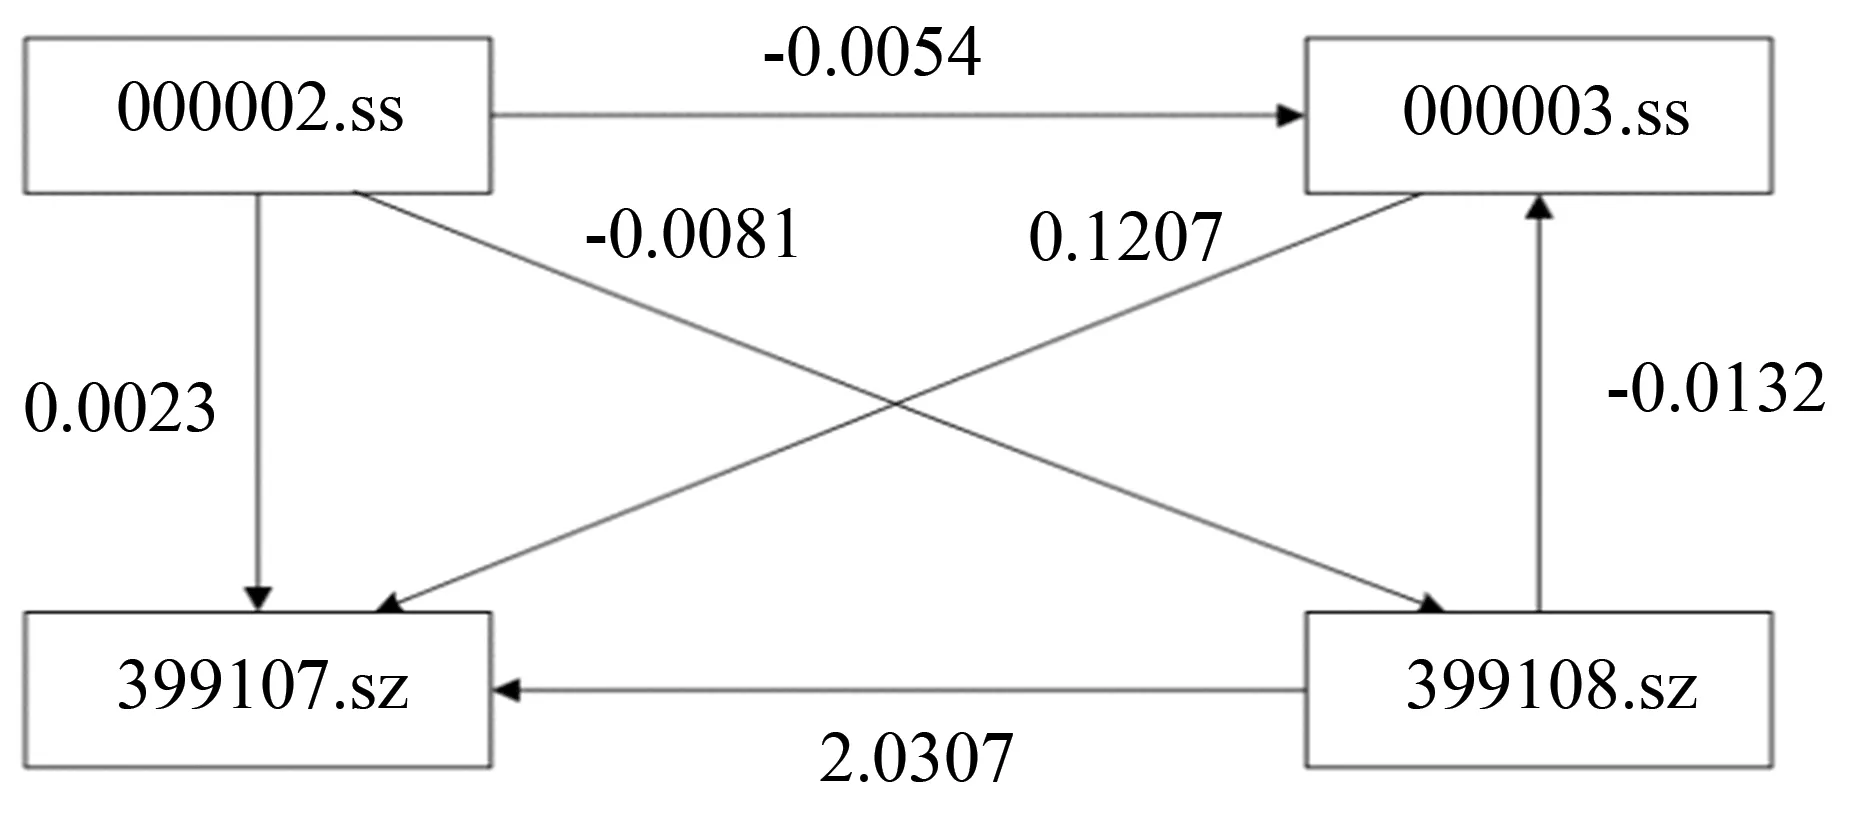
Fig.1 Direction of the estimated instantaneous causal structure direction by DirectLiNGAM
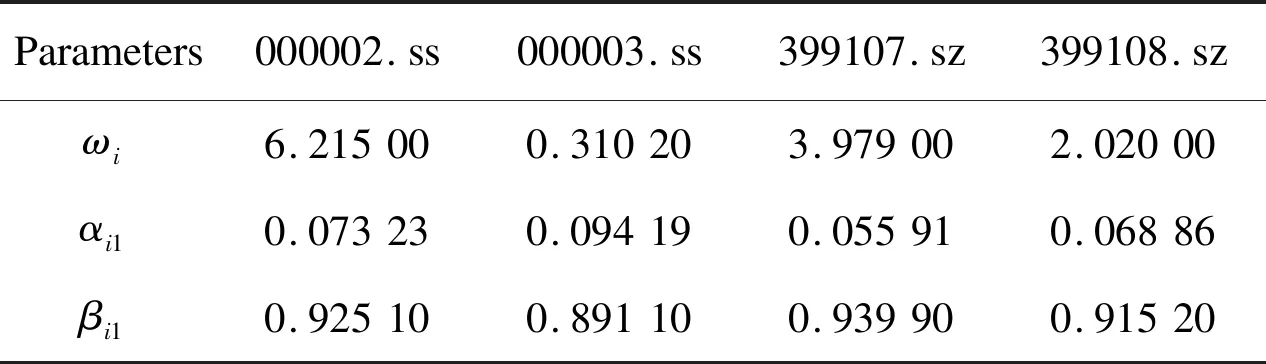
Parameters000002.ss000003.ss399107.sz399108.szωi6.215000.310203.979002.02000αi10.073230.094190.055910.06886βi10.925100.891100.939900.91520
Fig.3 shows the impulse response functions of 000002.ss, 000003.ss, 399107.sz, and 399108.sz to one unit shock, where the dashed lines are 95% confidence interval and the solid line indicates the impulse response. The volatility of 000002.ss had the greatest impact on other variables, and the unit shock of 000002.ss had a longer lasting effect on other variables. The unit shock of 000003.ss had little effect on other variables. The unit shock of 399107.sz only had a positive influence on 399108.sz and the duration was relatively short. The impact amplitude of unit shock on 399107.sz was not very large, but it had a positive impact on 000003.ss with a short duration, which had a negative impact on 399107.sz with a longer duration. As discussed, these results proved that volatility does shift in the impulse response of conditional volatility. The unit shock of 000002.ss had the greatest impact on other variables, and the unit shock of 000003.ss had little effect on other variables, which is consistent with the stock market in China.

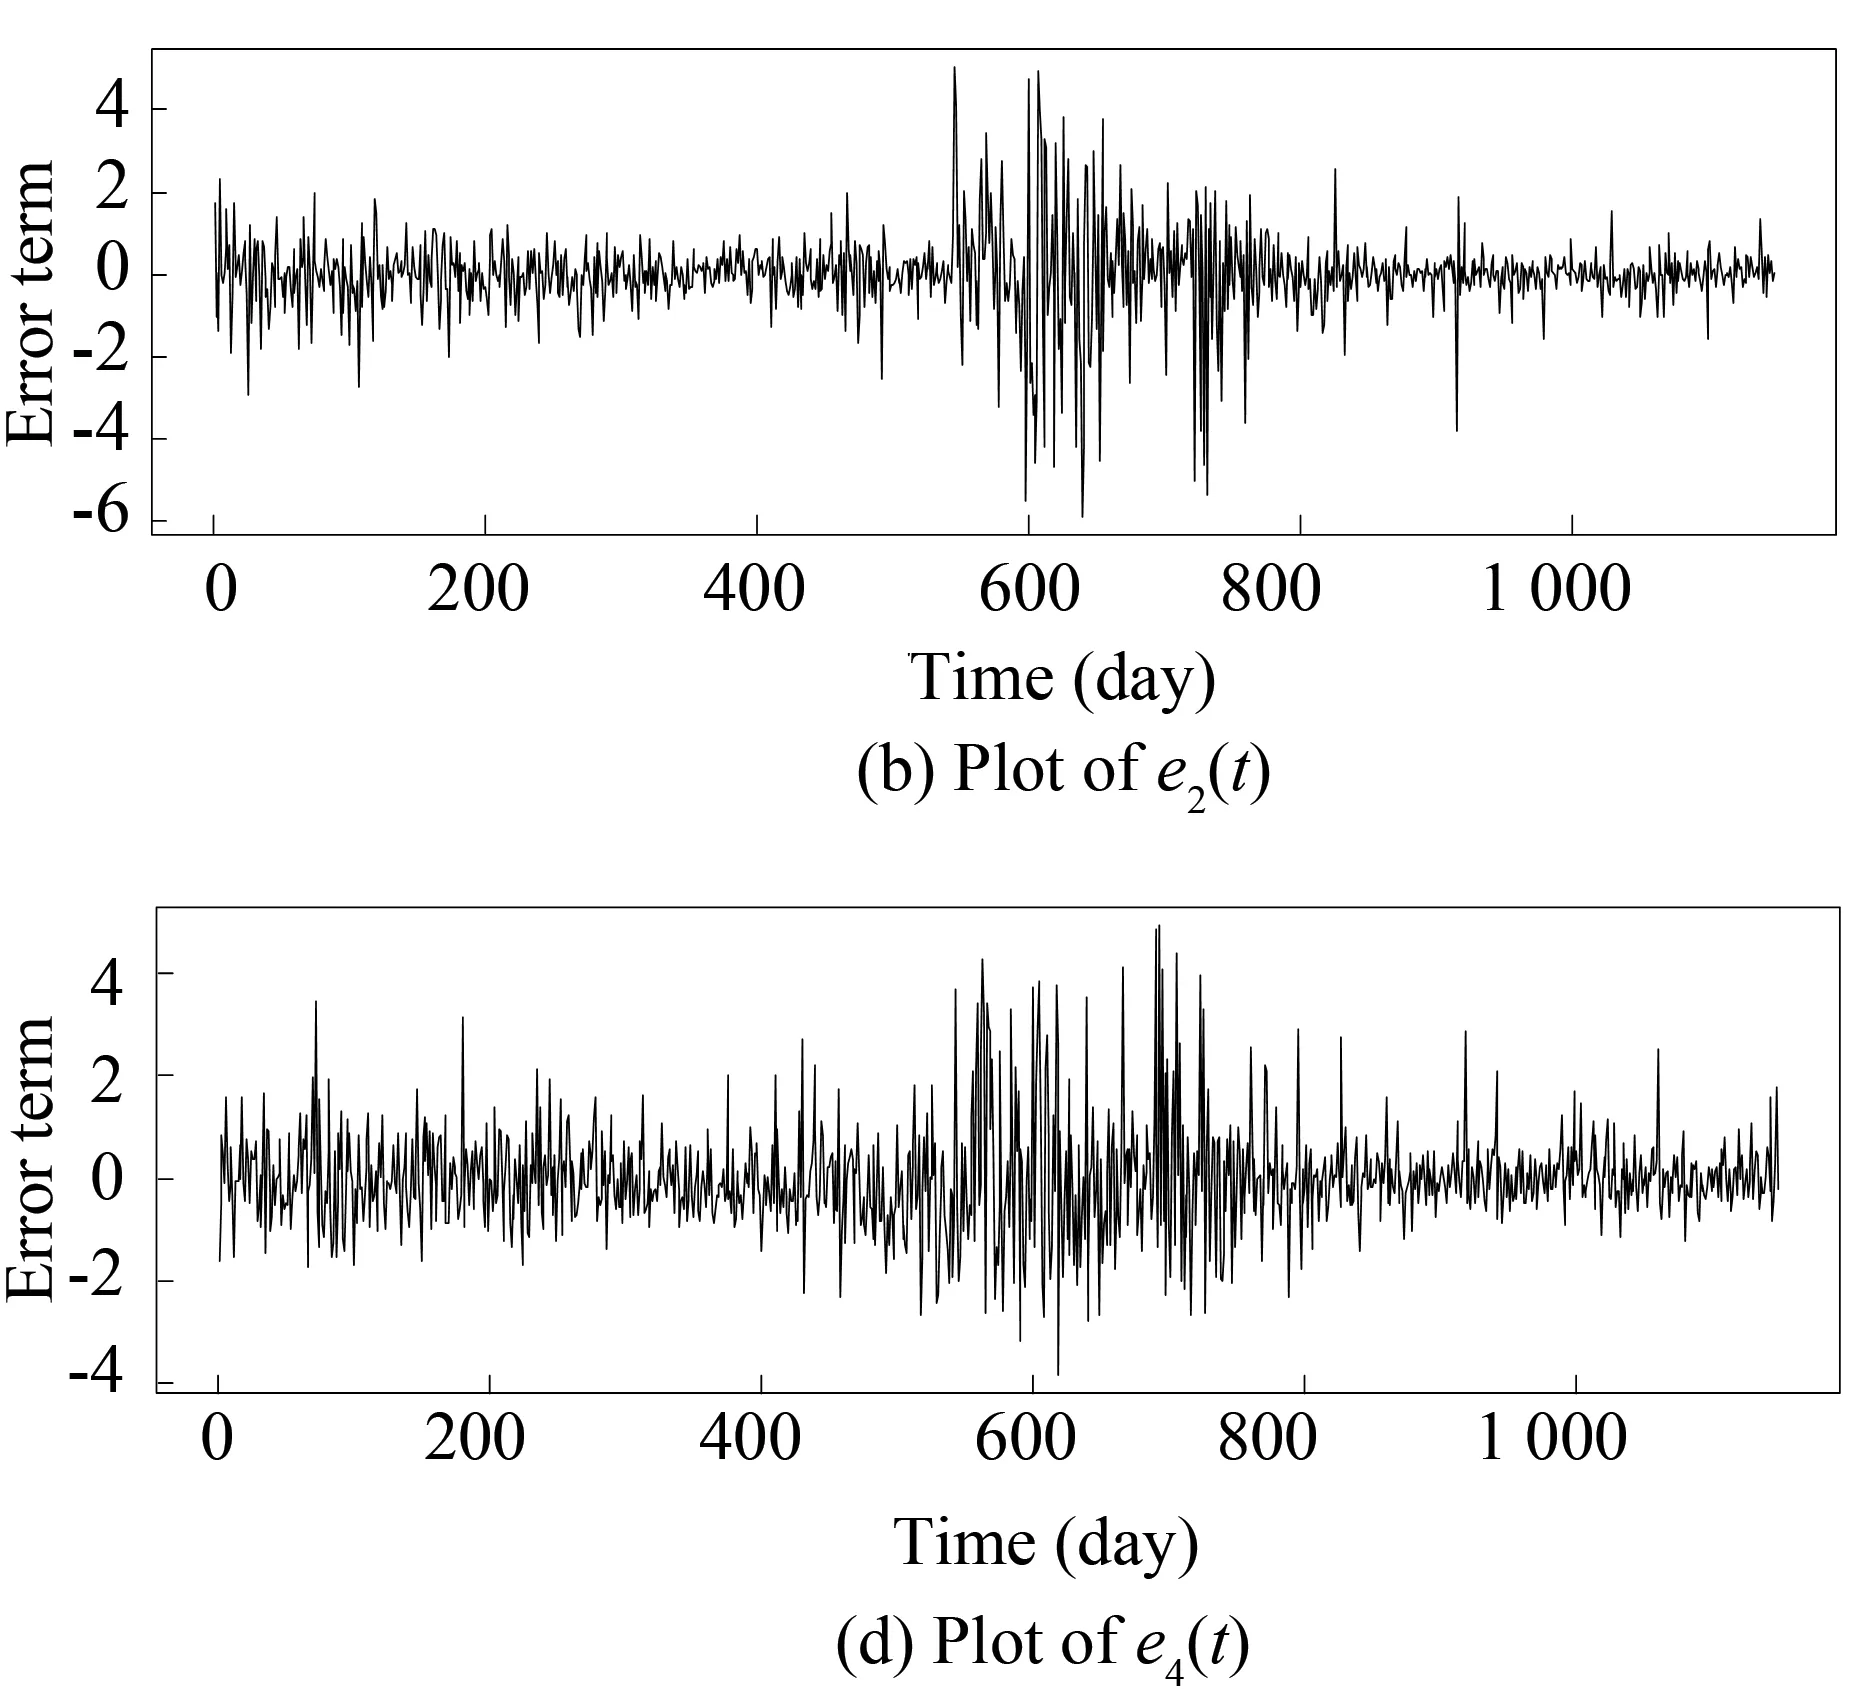
Fig.2Residualseries
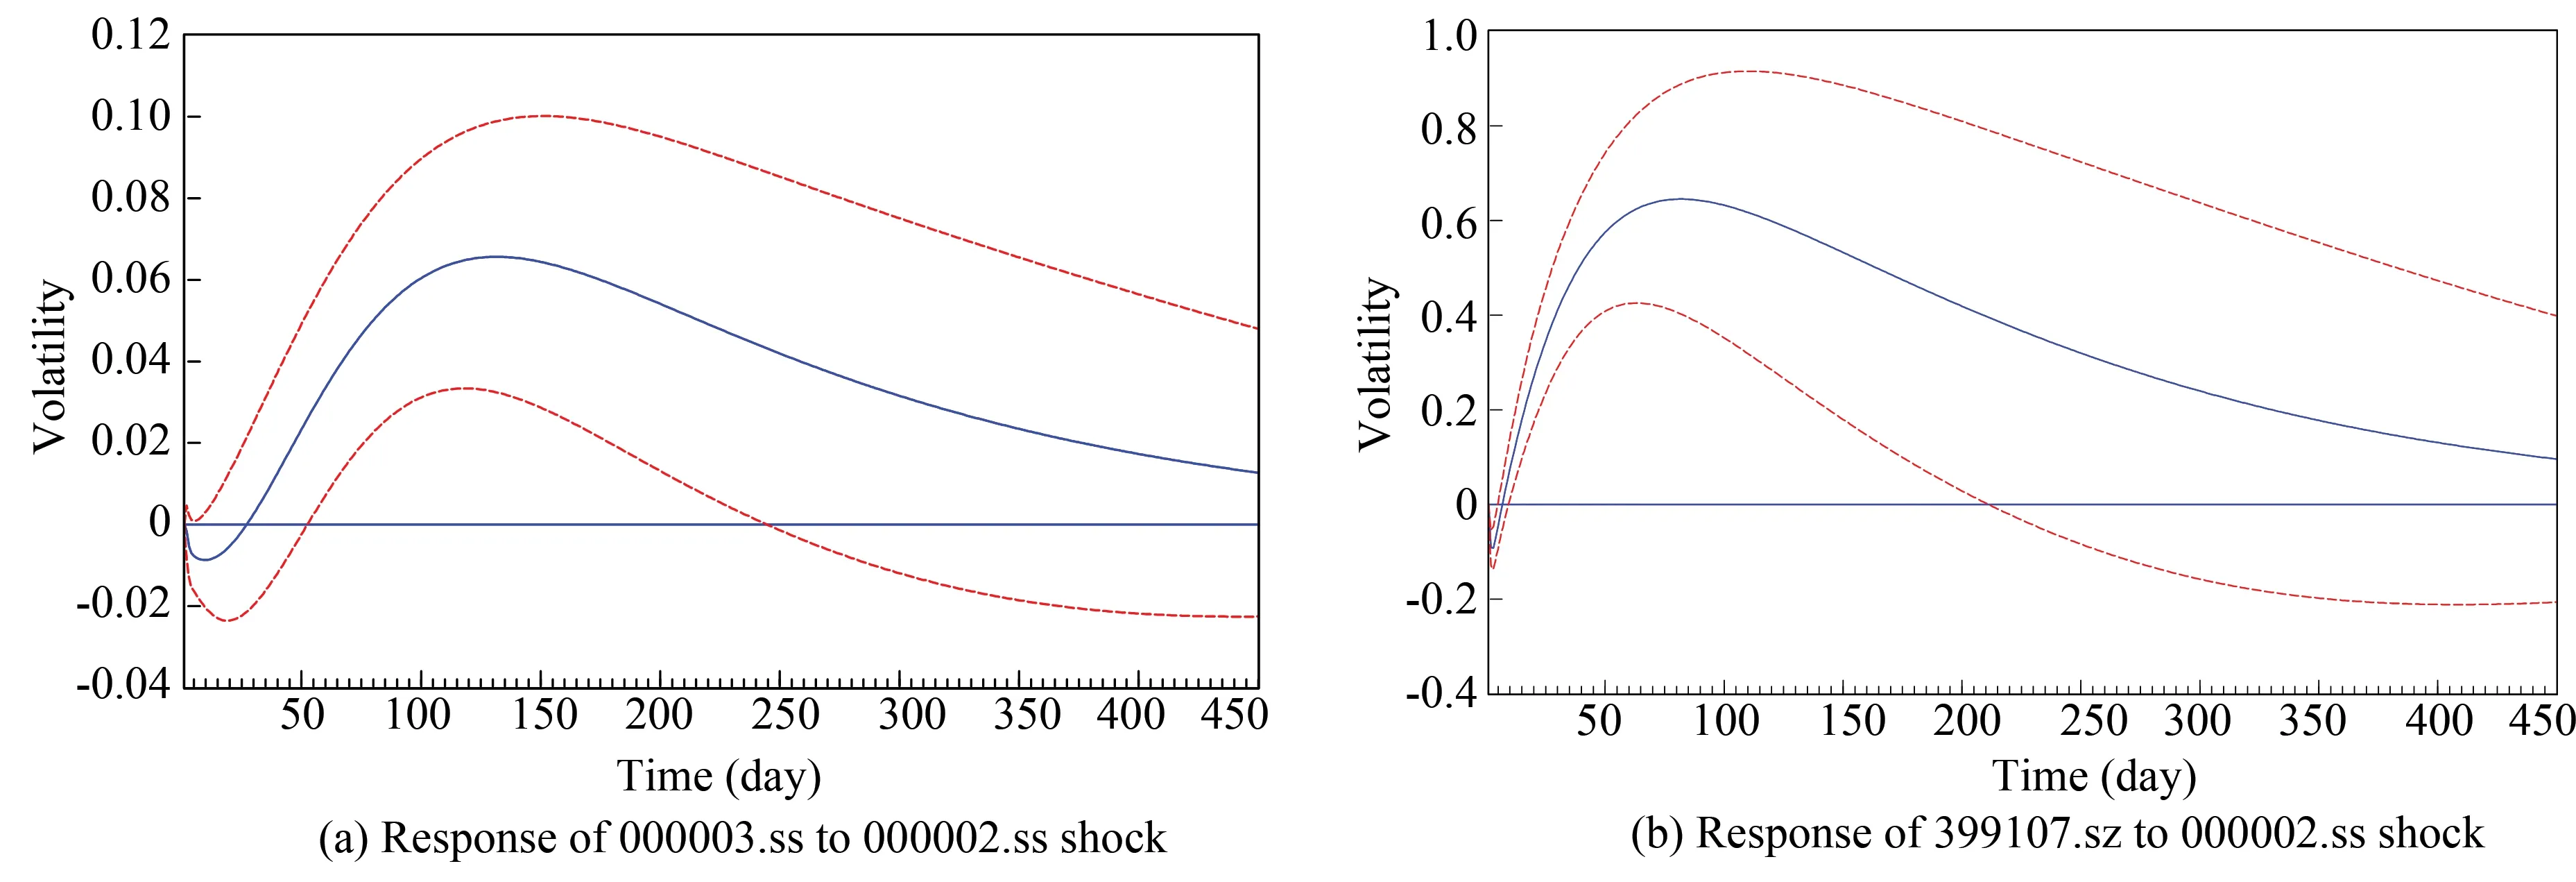
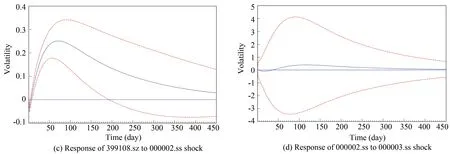
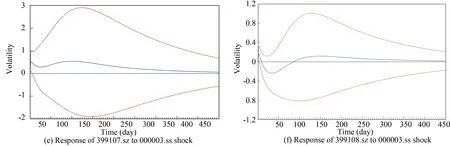

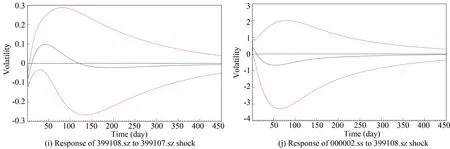

Fig.3 Impulse response of conditional volatility
6 Conclusions
In this paper, we propose an ARMA-GARCH model to estimate the multivariate volatility. The model provides an effective estimation method for the traceability of the dynamic volatility. We can identify the causal structure of the ARMA-GARCH model under data driven. The univariate GARCH model was used to estimate the impulse response of conditional volatility of the MGARCH models with the causal structure maintained at the same time. In practical application, we analyzed the causal structure and volatility structure of 000002.ss, 000003.ss, 399107.sz, and 399108.sz. The results show that 000002.ss had a significant impact on other variables. The volatility shifted in the impulse response of conditional volatility. The impact of 000002.ss largely affected other variables, whereas that of 000003.ss had little effect. The result is in accordance with the stock market in China. The experimental results also show that the ARMA-GARCH model is effective for estimating multivariate volatility.
杂志排行

Journal of Harbin Institute of Technology(New Series)的其它文章
- Role of Composite Phase Change Material on the Thermal Performance of a Latent Heat Storage System: Experimental Investigation
- GEO Satellite Thruster Configuration and Optimization
- Disturbance Observer Design with a Bode’s Ideal Filter for Sigma-Delta Modulators
- Vibration Absorption Efficiency and Higher Branches Elimination of Variable-Stiffness Nonlinear Energy Sink
- Probability Response of Shape Memory Alloy Beam Subjected to Noise Excitation
- Heat Dissipation Performance of Metal Core Printed Circuit Board with Micro Heat Exchanger