Dynamical Control of Asymmetrically Oblique Tidal Currents to the Sedimentary Characteristics and Development of Linear Sand Ridges in the Liaodong Shoal, East Bohai Sea
2020-03-09ZHANGLianjieZHULonghaiWUJianzhengHURijunWANGPengandZHANGPan
ZHANG Lianjie, ZHU Longhai, 2), *, WU Jianzheng, 2), HU Rijun, 2), WANG Peng, and ZHANG Pan
Dynamical Control of Asymmetrically Oblique Tidal Currents to the Sedimentary Characteristics and Development of Linear Sand Ridges in the Liaodong Shoal, East Bohai Sea
ZHANG Lianjie1), 3), ZHU Longhai1), 2), *, WU Jianzheng1), 2), HU Rijun1), 2), WANG Peng3), and ZHANG Pan3)
1),,266100,2),,,266100,3),116000,
The Liaodong Shoal is a group of linear sand ridges located in the east Bohai Sea of China. In this study, 54 surface sediment samples have been collected, current measurements at 4 stations have been carried out and bathymetric data were obtained. The current directions are rightward deflected relative to the strikes of the sand ridges. Affected by the narrowing effect of the ridge, the current velocities exhibited an anti-‘C’ type vertical profile. The velocities of the lower currents linearly correlate with the water depths. The near-bed current velocities over the troughs are estimated to be higher than those over the ridges, and this feature could be explained by the loss of kinetic energy together with the conversion between kinetic energy and gravitational potential energy. The sedimentary characteristics that are compatible with the tidal dynamics are developed across the ridges and troughs, including grain size compositions, grain size parameters, mineral compositions andDindexes. The existence of the angles between the current directions and the strikes of the sand ridges is the key factor for the growth of the sand ridges. The asymmetric hydrodynamic features between the flood and ebb currents lead to the differences in the topographical and sedimentary characteristics on both sides of a sand ridge. Insufficient material supply led to the degradation of the sand ridges, and the reduction of the tidal current intensity has led to the development of the subordinate sand ridges in the troughs. Sand ridges are migrating.
Liaodong Shoal; tidal current ridge; heavy minerals; sedimentary characteristic; development and evolution
1 Introduction
Tidal current ridges are linear sand bodies formed on the continental shelf at shallow water depths. The earliest study on tidal current ridges was carried out by Off (1963) and he noted that the formation of tidal current ridges re- quired a strong and directional tidal current in addition to abundant material supply. Furthermore, he suggested that the current velocity of 1 to 5knot is most conducive to the development of ridges. Since then, tidal current ridges around the world have been widely studied by scholars. These tidal current ridges are all located on continental shelves of several main continents, such as Europe (Mc- Cave, 1979; Howarth and Huthnance, 1984), North America (Swift, 1975; Amos and King, 1984; Swift and Field, 2010), South America (Parker., 1982), Australia (Har-ris., 1992) and China (Xia and Liu, 1983; Liu and Xia, 1983, 1995, 2004; Tang., 1993, 1994; Xia., 1995; Huang and Li, 1998; Yin, 2003; Huang., 2009). The formation and development mechanism of tidal current ridges is the focus of previous studies. Off (1963) proposed a spiral flow model and argued that the near-bed current diverges at the bottom of a trough and converges at the top of a ridge. Although evidences based on sand waves (Houbolt, 1968) and particle size distribution (Caston and Stride, 1970) were discovered, results of current measurements from the North Hind sand ridges in the North Sea (McCave, 1979), Skerries sand ridges in the English Channel (Soulsby, 1981), and Well sand ridges in the North Sea (Howarth and Huthnance, 1984) did not show the occurrence of a spiral flow. Several scholars proposed sedimentary models for the development of tidal current ridges based on their respective studies, such as the stability model referred to as the sand wave model (Smith, 1969), lateral migration model (Caston and Stride, 1970) and the stability model based on the equilibriumprofile (Huthnance, 1982). Among them, the model proposed by Huthnance (1982) precisely simulated the wave- length and angle that were most suitable for the growth of ridges, and the results were verified by Parker. (1982). However, as there are several types of sand ridges, their formation mechanisms are also different in specific regions. Recently, numerical models were widely used in dynamic study of tidal sand ridges, for example, to explain the tidal rectification over the ridges and how the ridges were formed and changed (Sanay., 2007), to simulate initial formation of tidal sand ridges and long bed waves (Yuan., 2016) and to simulate the finite- height behavior of offshore tidal sand ridges (Yuan., 2017).
The Liaodong Shoal is located in the East Bohai Sea of China (Fig.1) and consists of six sand ridges that generally extend from north to south. The shoal is generally deep in the south and shallow in the north. Wide troughs alternate with narrow ridges, featuring a relative elevation of 20m or so (Geng., 1983). The tide type in the study area is an irregular semi-diurnal tide. The M2tide holds the dominant position and rotates anticlockwise (Zhu, 2010). Its tidal wave is similar to a progressive wave, and the velocities of the flood currents reach a maximum with a high tide level, while those of the ebb currents occur with a low tide level. Liu and Xia (1983) were the first to study the Liaodong Shoal and argued that the materials that formed these features originated from the ancient Liao River and Daling River. They considered the Liao- dong Shoal to be a relict sediment region. Liu and Xia (1983) found that the bidirectional flow of tidal currents leads to two transitional components in the sediment and suggested that the material eroding from the Bohai Strait is also an important source. The earliest and most comprehensive marine survey on the Liaodong Shoal was carried out by scientists from China and France in 1991. Based on data obtained from some surveys such as shallow seismic profiles, bathymetry, current measurements and surface sediment sampling, the relationship between the development of sand ridges and the tidal currents (Tang., 1993, 1994), the dynamic formation mechanism of the Liaodong Shoal (Liu and Xia, 1995) and its submarine topography (Liu., 1996) were studied. According to the thicknesses of the marine sediment layers and the vertical reversed ages of the sediments, Liu. (1994) suggested that the Liaodong Shoal is the evolutionary product of the flood current delta during the Holo- cene. They considered it as an accumulation zone of tidal eroding materials from the Laotieshan Waterway instead of as a relict sediment region. The series of studies based on the marine survey in 1991 provided the more comprehensive understanding of the Liaodong Shoal. The loss of the sediment layers in the Laotieshan waterway since the Wurm Interglacial Stage also provides new evidence for the material source of the Liaodong Shoal (Li, 2012).
The transport direction of the materials is widely agreed to be from the south to the north due to strong flood currents (Liu and Xia, 2004; Zhu, 2010; Jin., 2014, 2015). The earliest formation age of the Liaodong Shoal was proposed to be later than the age of greatest transgression in the Holocene (approximately 6kyrB.P.) accor- ding to Liu. (1994). Liu. (2008) then gave a moreaccurate age range of 3.6–2.4kyrB.P. At present, the Liao- dong Shoal has been eroded. Liu. (1996) found the evidences based on the water depth comparison between the years of 1959 and 1972. The result of numerical simu- lation (Zhu, 2010) also showed the scouring state of the ridges and the silting state of the troughs. Liu and Xia (1995) applied a river dynamic model ‘longitudinal trans- verse circulation’ to explain the formation of the sand ridges in the Liaodong Shoal and argued that the circulation currents excavated the sediments from the troughs and transported them to the ridges. Zhu (1998) proposed that the formation of the ridges has nothing to do with the circulation, since longitudinal transverse circulation could not exist on a flat seabed.
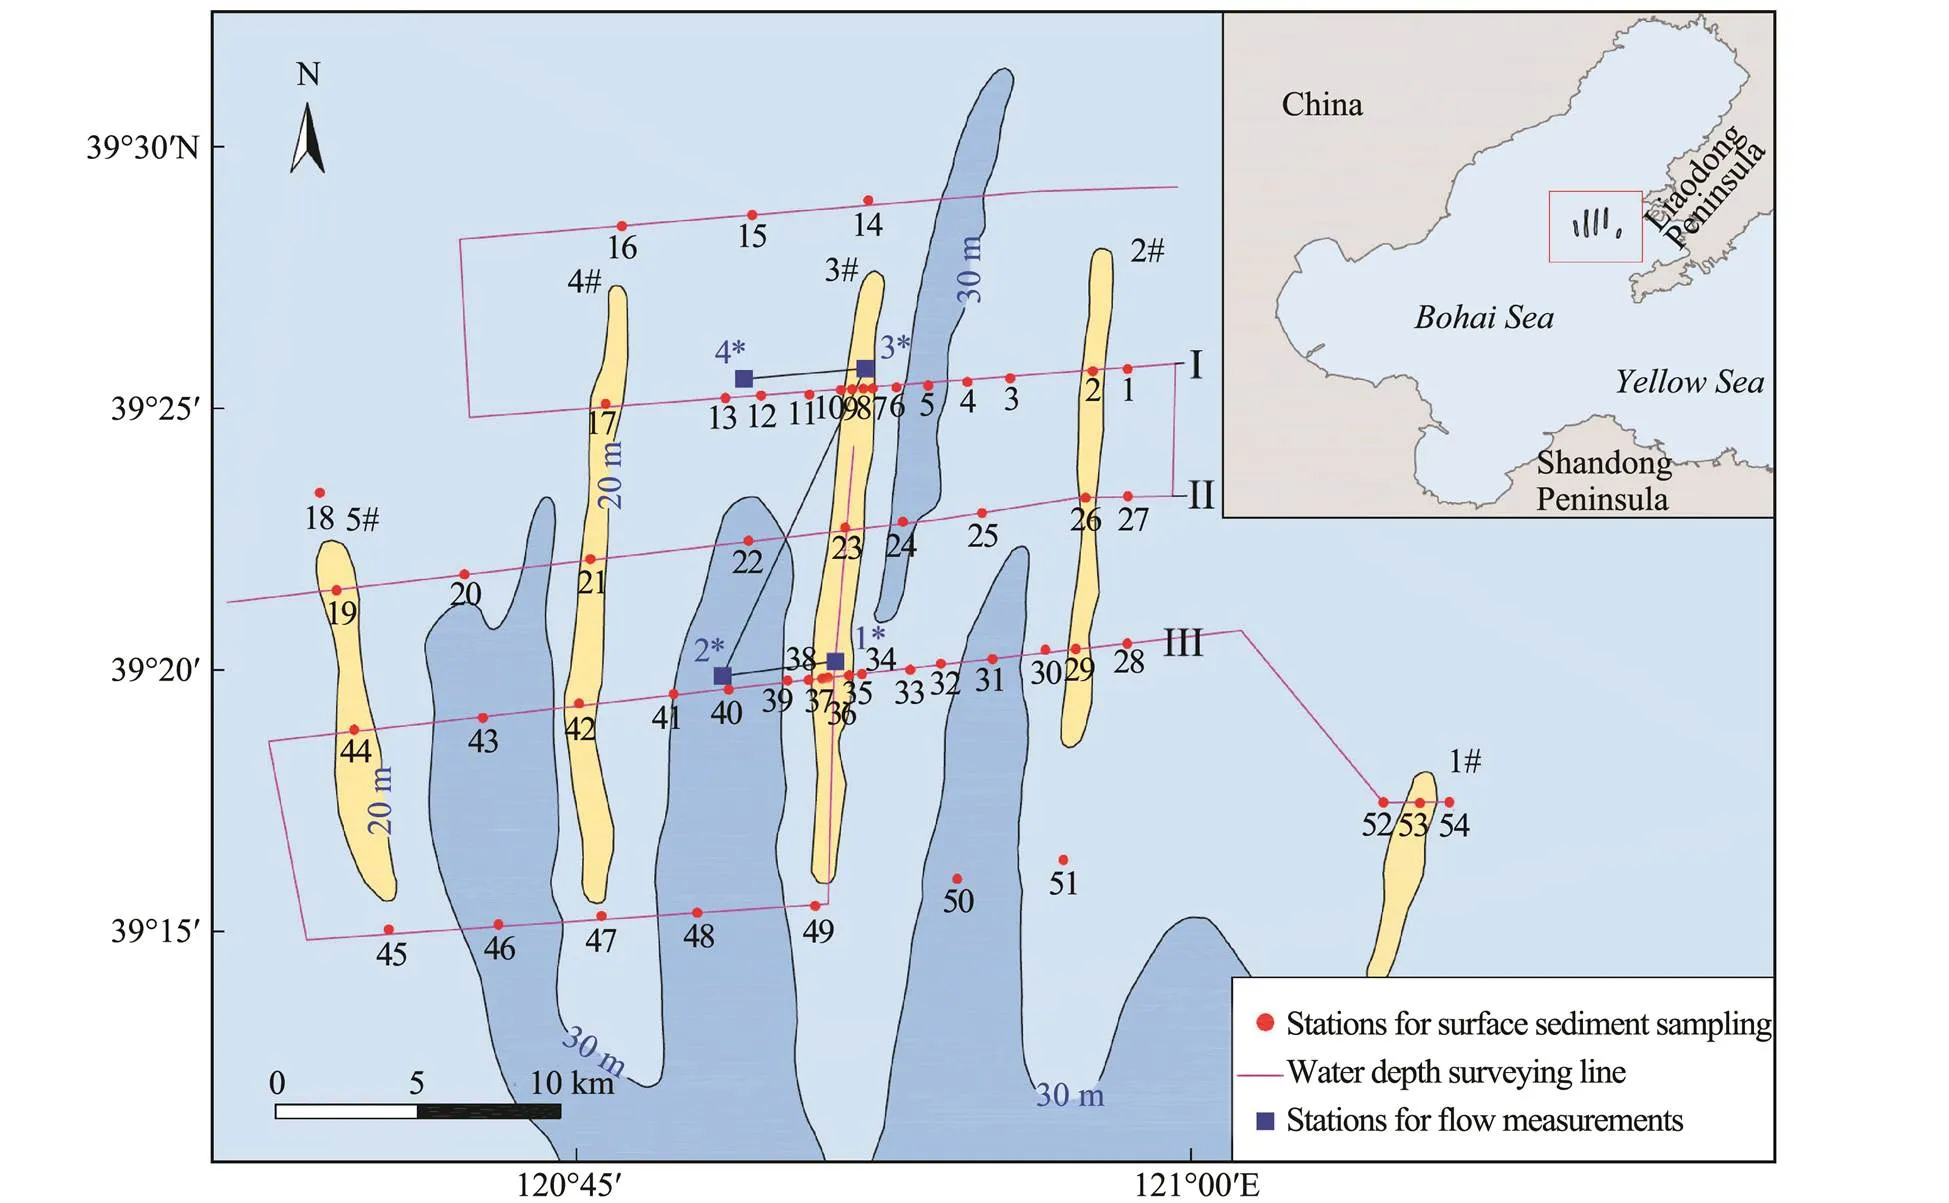
Fig.1 Location and marine sur vey arrangement within the Liaodong Shoal (modified from Jin et al., 2014). 1#–5# represent the serial numbers of each sand ridge.
Although these studies have been done in the Liaodong Shoal, the marine surveys were not detailed enough. The stations arranged for current measurements and surface se- diments sampling were few and far between. Consequently, the data were not representative or targeted enough for an accurate understanding of tidal current dynamics and sedi- mentary conditions. Based on an elaborate and targeted marine survey, in this paper we carried out a comprehensive analysis of the submarine topography, tidal current dynamics, grain size characteristics and mineral characteristics in the Liaodong Shoal to answer the following questions:
1) What are the differences between the ridges and the troughs in the tidal current dynamics, especially in the near-bed velocity, and what leads to these differences?
2) What are the differences between the ridges and the troughs in their grain size and mineral characteristics, and how do the differences respond to tidal current dynamics, especially those in the near-bed velocity?
3) What is the sedimentary dynamical process of the Liaodong Shoal?
4) How did the sand ridges change and migrate in the last several decades?
2 Materials and Methods
A comprehensive marine survey in the Liaodong Shoal was carried out in 2012. The materials include synchronous current data at 4 stations during the spring tides, 54 surface sediment samples and bathymetry data (Fig.1). Differential GPS was used for navigation and positioning. The ‘Hydrotrac II’ single-beam bathymetry system produced by Odom was used for bathymetry, and a synchronous tide gauge was deployed at Changxing Island for depth corrections. The ‘FlowQuest600’ ADCP produced by LinkQuest was used for the current measurements with an accuracy level of 0.5–1m.
The surface sediments were collected with a clam sampler. For the grain size analysis of the samples, a sieving analysis (interval 0.5Φ) was used for grains larger than 63μm, and Mastersizer2000 was used for the remainder. The calculation method of the grain size parameters was taken from McManus (1988). Very fine sand (grain size 63–125μm) was chosen for the detrital mineral analysis. The heavy minerals and light minerals were separated using the heavy liquid (CHBr3, specific gravity 2.89). A binocular stereoscope and a polarizing microscope were used for mineral identificationan immersion method. 300–500 particles for each sample were identified. After that, the percentage of each mineral species is calculated.
3 Results
3.1 Submarine Topography
According to the bathymetric results, the strike of each sand ridge is: 13˚–193˚ for the ridge 1#, 4˚–184˚ for the ridge 2#, 6˚–186˚ for the ridge 3#, 5˚–185˚ for the ridge 4# and 173˚–353˚ for the ridge 5#. The ridges 2#, 3# and 4# are approximately parallel. The water depths in the north of the shoal are shallower than those in the south. The water depths of the troughs are 35 to 40m in the south, and about 30m in the north. The water depths of the ridges are shallow, with a minimum of 12m. The slopes on each side of a ridge are different, being steep on the western slope and gentle on eastern slope. The bathymetry shows that there are linear bulges on the bottoms of the troughs with heights of 3–7m, which we call ‘subordinate sand ridges’ (Fig.4). On both sides of the subordinate sand ri- dges are deep troughs, which are deeper and steeper on the western side than the eastern side.
3.2 Tidal Current Hydrodynamics
The tidal currents at 4 stations were synchronously mea- sured during spring tides. The locations of the stations are shown in Fig.1. The depth of each station is 14m for station 1*, 33m for station 2*, 20m for station 3*, and 28m for station 4*. Due to the blind zone of the ADCP, the current data above the depth of 4m were not recorded. Due to the disorder effect, the current data in the water layer of the bottommost 3m were removed.
3.2.1 Vertical changes of tidal current velocities
For a given depth, the current velocities over the ridges (stations 1*, 3*) were generally smaller than those over the troughs (stations 2*, 4*) (Figs.2A, B). For a given station, the velocities of the subsurface currents were larger during the ebb tides than those during flood tides, while the velocities of the middle and near-bottom currents were smaller during ebb tides than those during flood tides (Figs.2A, B), showing a diametrically opposed feature.
The current velocities do not decrease from the surface to the bottom, but increase first and then decrease (Figs.2A, B). In other words, there is a strong flow in the vertical water column. It is similar to the situation found in the previous survey (Tang., 1993). As shown in Figs.2A and B, the elevations of the fastest flood current at the stations 2* and 3* (−9m for the station 2*, −7.5m for the station 3*) are 2m deeper than those of the fastest ebb current (−7m for the station 2*, −5.5m for the station 3*). However, the elevation of the fastest flood current of the station 4* (−9m) is 1.5m shallower than that of the fastest ebb current (−10.5m).
Ni. (2012) studied the vertical profiles of current velocity and divided these profiles into two types. The profile presented as ‘large-small’ from the sea surface to bottom is called type I (also called type ‘J’) velocity profile and that presented as ‘small-large-small’ is called type II (also called type anti-‘C’) velocity profile. Type I velocity profiles are common and generally appear in the waters with flat submarine topographies. Type II velocity profiles are relatively rare, but scholars have observed this anomalous vertical velocity profile in the estuary of Yangtze River (Wang., 2004), the Dongdagang Waterway of the North Jiangsu Shoal (Wu., 2008), the tidal troughs of Hangzhou Bay (Yang., 2008) and the Xiyang Waterway of the North Jiangsu Shoal (Ni., 2012). The vertical velocity profile in the Liaodong Shoal generally belongs to the type II. In addition, at the station 2* where the water is deep, the fastest flow layer appeared at an elevation of −6m; while at the station 4* with slightly shallow water depth, the fastest flow layer appeared at an elevation of −12m (Fig.2B). It seems that the depth of the fastest flow layer is affected by the elevations of the neighboring sand ridges. However, in flood current, the depth where the current velocity reach a peak at stations 2* and 4* were almost the same. The concave- convex seafloor of the Liaodong Shoal blocks the flow of tidal currents to some extent. The narrowing effect leads to a decrease of the cross section, and an increase of the current velocity of the water layer above the shoal.
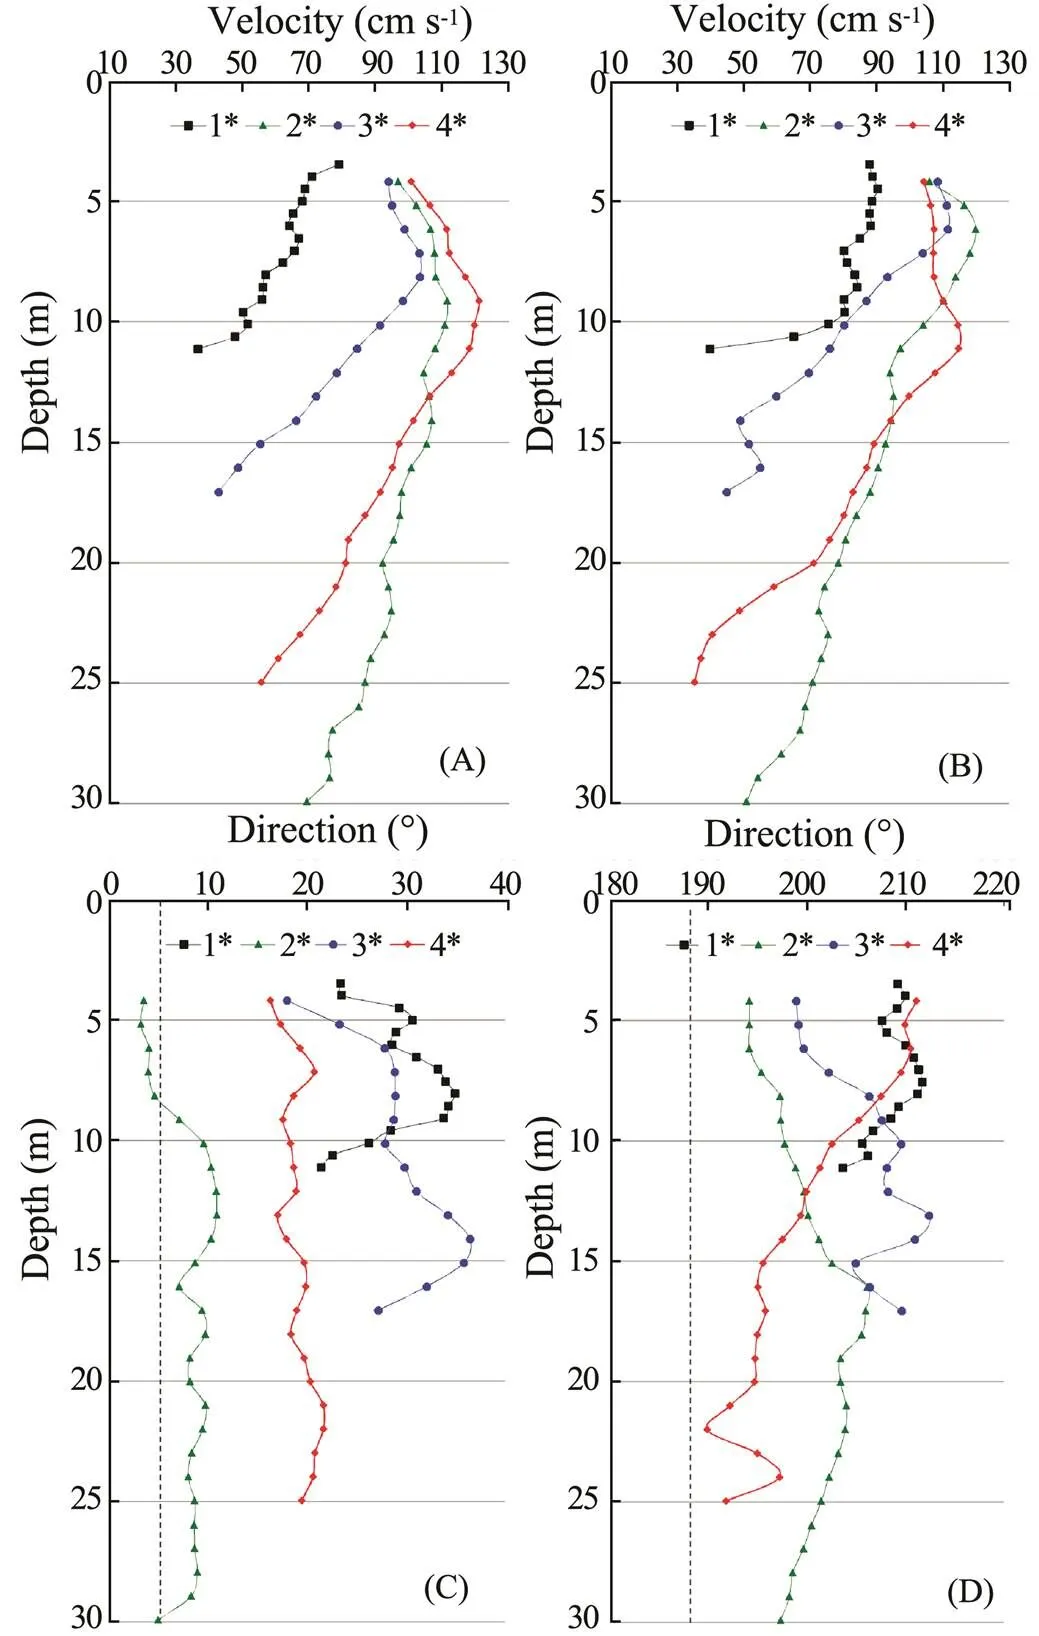
Fig.2 Vertical changes of the fastest flowing current velo- cities and directions: (A) flood current velocity; (B) ebb current velocity; (C) flood current direction; (D) ebb cur- rent direction. The dotted lines in (C) and (D) indicate the average strike of the sand ridges.
3.2.2 Vertical changes of the tidal current directions
Comparisons show that there are angles between currentdirections and the strikes of sand ridges, during either flood tides or ebb tides (Figs.2C, D). Take the strike of a sand ridge as reference, the current directions were deflected eastward during flood tides and were deflected westward during ebb tides. In fact, these deflections were essentially same, in that they were all deflected to the right. The existence of the angles would inevitably lead to current components that were vertical to the strikes of sand ridges. The western slopes of the ridges face the flood currents and the eastern slopes of the ridges face the ebb currents.
The angles between the current directions and the strikes of the ridges varied vertically, showing a surface-bottom change of initial increase and then decrease (Figs.2C, D). For the near-bottom currents, the greater the water depth is, the smaller the current velocity was, the smaller the angle was, and the more obvious the currents constrained the ridge-trough topography. The velocity of the mid-depth current was the largest, and the angle at this depth was also the largest. For the subsurface currents, the shallower the water depth was, the smaller the current velocity and the angle of deflection were.
It has been proved that the formation of the tidal current ridges in Liaodong Shoal is closely related to the M2tide (Tang., 1993, 1994). We plotted the tidal current ellipses of the M2constituent at several special depths (Fig.3).
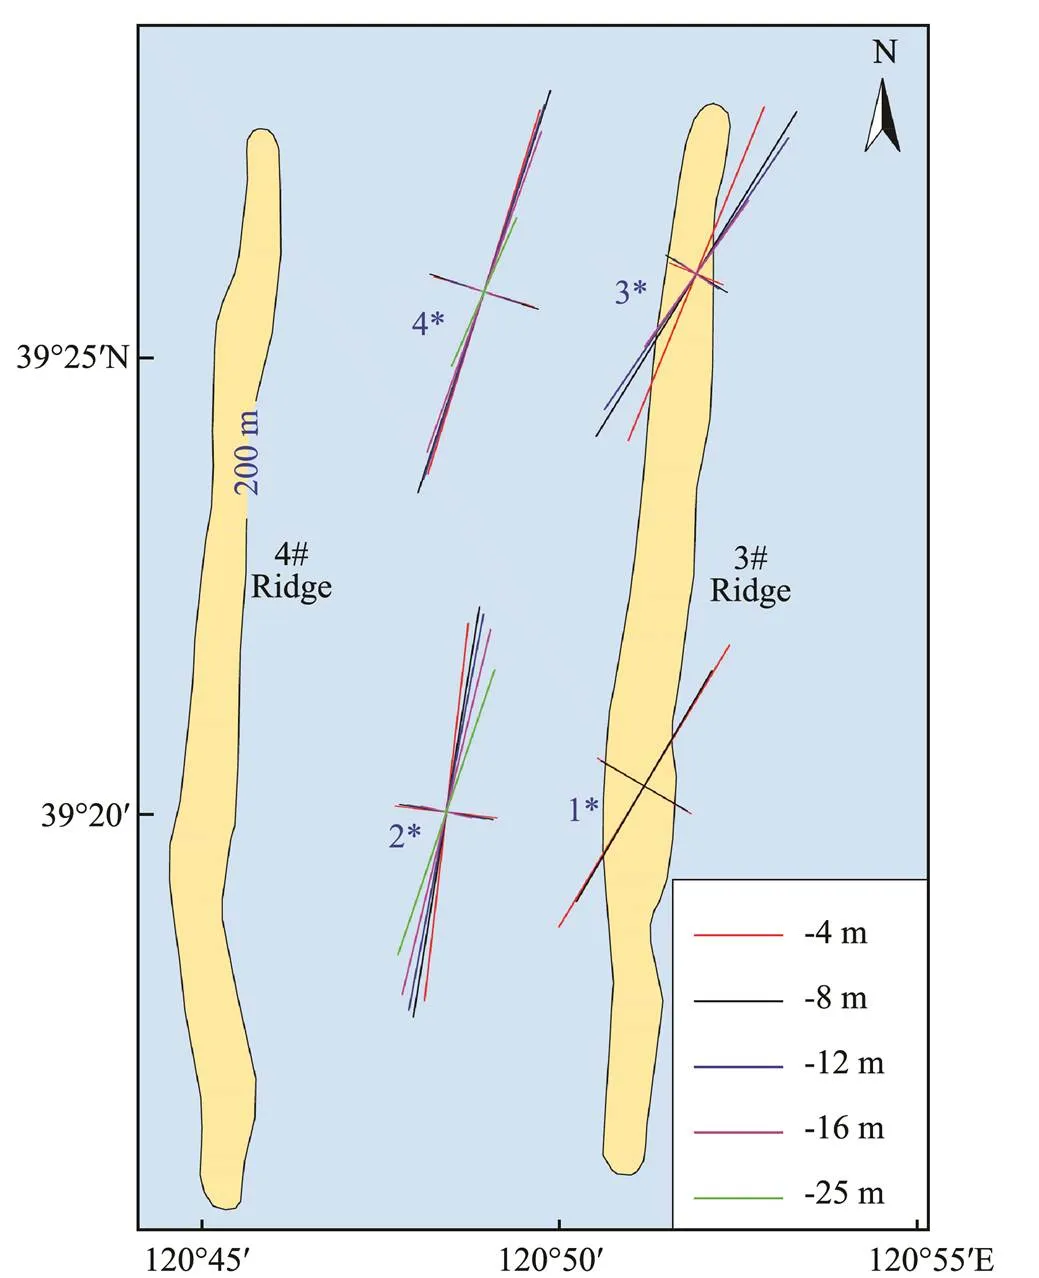
Fig.3 Tidal current ellipses of M2 constituent in Liaodong Shoal.
In general, the major axes tend to turn eastward with the increase of water depth. The directions of major axes are NNE-SSW in the trough (2* and 4*) while they are NE-SW over the ridge (1* and 3*). The direction of a major axis presents an angle with a ridge, which is about 40˚ over the ridge and about 15˚–20˚ in the groove. The distribution of the major axis length showed that the current velocities of the M2constituents in the troughs are larger than those over the ridges, among which the largest velocity appears at station 4* and the smallest one at station 1*.
3.3 Grain Size Characteristics of the Surface Sediments
As the ridges alternates with troughs, the grain size characteristics of the surface sediments are shown in the profiles across these features. Three profiles are selected across the shoal, and they passed through the sediment sampling stations (Fig.1). The contents of each sediment grain grade are correlated significantly with the submarine topography in profile (Fig.4). Sand gathers at the tops of the sand ridges and subordinate sand ridges (98% maxi- mum) and silt and clay gather at the bottoms of deep troughs beside subordinate sand ridges (42% maximum for silt, 21% maximum for clay). It should be noted that gravel is found in the surface sediment samples from the troughs, while previous studies (Liu., 1996) suggested that the sediments in the troughs were mainly clayey sand or sand-silt-clay. The mean grain size is coarsest at the tops of the sand ridges (1.8Φ minimum), moderate at the tops of the subordinate sand ridges (3.8Φ minimum) and finest at the bottoms of the troughs (5.7Φ maximum). The grain size parameters are obviously different for the sedimentson the ridges from those in the trough. Taking profile II as an example (Fig.4), the sediments from the ridges have larger mean grain sizes and standard deviations than those from the troughs. In other words, the ridges are covered with coarse sediments with good sorting, which is opposite to the troughs. The grain size characteristics in profile III are similar to profile I. The sediments from the subordnate sand ridges also have larger mean grain sizes and standard deviations compared with those from the deep troughs, which is similar to the sand ridges (Fig.4).
Fig.4 Profiles of the grain grade contents and grain size parameters in the Liaodong Shoal. The locations of profiles (I, II, III) are shown in Fig.1. μ, mean grain size (Φ); σ, standard deviation; Sk, skewness; Ku, kurtosis. The calculation method was taken from McManus (1988).
A strange change of skewness is shown in Fig.4. Thanks to seven samples collected on the 3# sand ridge, we found that the skewness reaches a maximum at the middle of the slope (with a depth of 24m) and reduces toward the neigh- boring trough or ridge (Fig.4). It is not clear whether similar situations also exist within the other ridges, as the other stations are not dense enough to tell. However, it is supposed that the situation should be ubiquitous. Skew- ness is more sensitive to the tail of the grain size distribution curve. The absence of coarse-grained portions leads to a positive skewness, which generally happens to river sediments (Jin, 2012). The small skewness at the top of the ridges could be caused by the enrichment of coarse grains and the deficit of fine grains.
3.4 Mineral Characteristics of the Surface Sediments
The identification and analysis of detrital heavy mineralsshowed that the major heavy mineral species and their average contents were listed as follows: hornblende (35.8%), ilmenite (14.8%), magnetite (9.0%), epidote (8.4%), garnet (6.5%), chlorite (5.8%), augite (4.4%), and biotite (3.3%). Chen. (1982) found that the Liaodong Shoal possesses the highest average content of ilmenite, garnet or zircon in the Bohai Sea and the low average content of hornblende or epidote.
The profiles of detrital heavy mineral contents are shown in Fig.5. Garnet corresponds best to the submarine topo- graphy, gathering in areas with shallow water depths, such as the sand ridges and the subordinate sand ridges. The high-density minerals (., ilmenite and magnetite) are distributed similarly to garnet, but tend to be slightly concentrated on the western slopes of a ridge. Flaky minerals with small densities (., biotite, muscovite, weathered mica and chlorite) are distributed completely opposite to the high-density minerals. The flaky minerals are enriched in deep troughs, and the deeper the water depth is, the higher their contents are. Due to their flaky structures flake minerals are difficult to resuspend once deposited. The subordinate sand ridges exhibit similar mineral characteristics to the sand ridges and contain a large amount of minerals with high densities, even more so than the sand ridges.
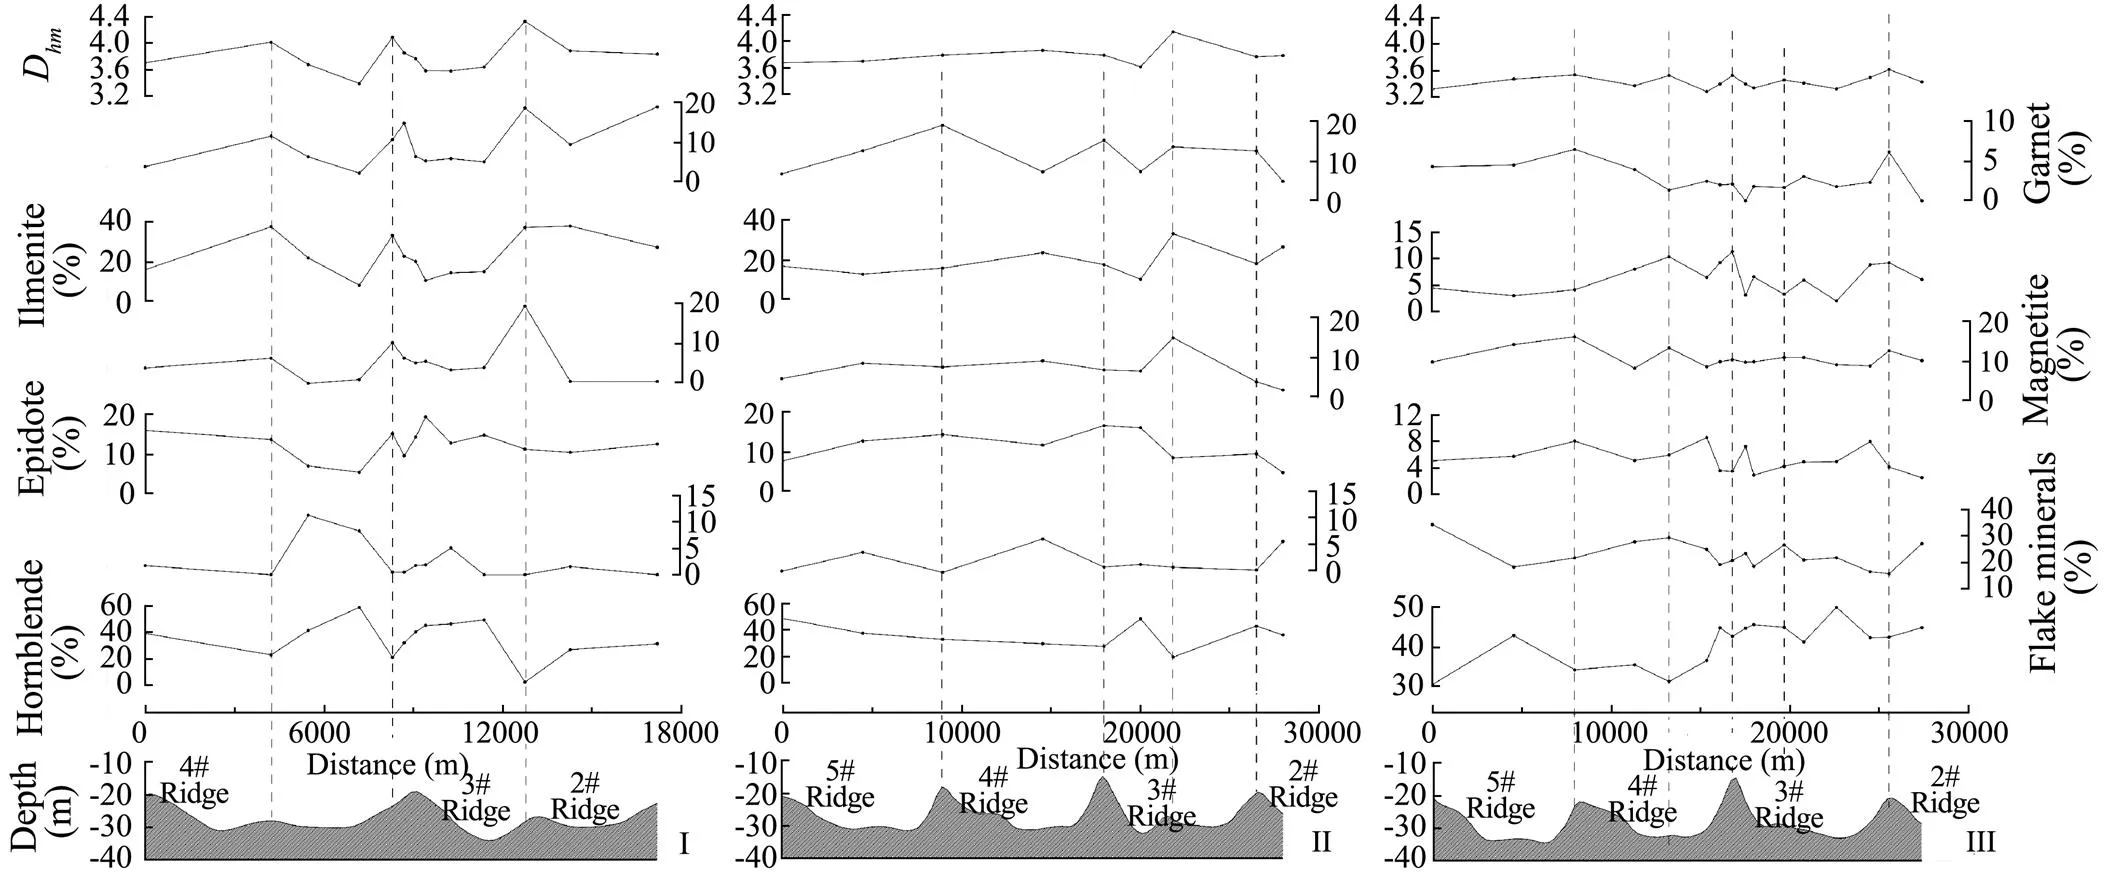
Fig.5 Profiles of the contents and indexes of the detrital heavy minerals in the Liaodong Shoal. The formula for the Dhm index is given in Eq. (1). The locations of the profiles (I, II, III) are shown in Fig.1.
4 Discussion
4.1 Response of Tidal Current Hydrodynamics to Topography
4.1.1 Contour map of the current velocity in profiles
According to the vertical current velocity, profiles can be divided into three segments. In the upper segment, the velocity of subsurface current increases with water depth; in the middle segment where the current is strong, the current velocity decreases from the center towards the outside; in the lower segment, the velocities of middle and near-bottom currents decrease with the increase of water depth. Fig.6 is the contour map of current velocity in a verticle profile based on the ADCP data at the stations 3* and 4* when the flood currents flow fastest. The contour lines uplift from a trough to the neighboring ridge, exhibiting a tongue-shaped distribution.
4.1.2 Near-bed current velocity
Near-bed current velocity is the most important factor affecting the sedimentary characteristics, as the bottom currents directly contact and act on the seabed. Due to the disordered effect of bottom water layers, it is difficult to determine the real status of the near-bed current. Consequently, it is necessary to explore the vertical regularities of the current velocities.
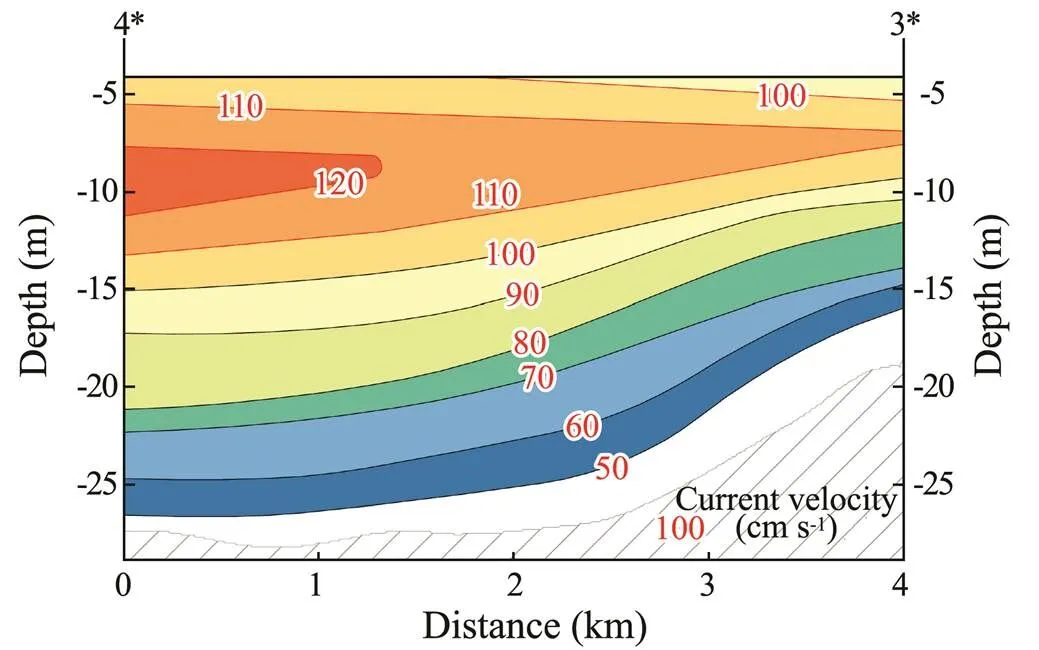
Fig.6 Contour map of the max flood current velocities in profile.
After analyzing the relationship between the water dep- ths and the vertical velocities when the flood currents flow fastest, we found that in the lower segment the vertical velocity is highly correlated with the depth and the linear fitting coefficient (2) is as high as 0.886–0.996 (Fig.7). So we consider that the velocities of the lower currents are linearly correlated with the water depths. Of course, it is just suitable for the water column below the fastest current layer and down to 3m above the sea floor. As close to the sea floor, the correlation between velocity and water depth is not linear, due to bottom friction and turbulence.
Since we did not get the current data of the bottommost 3m, we compared the lowermost data we got. The near- bed (3m above the seafloor) current velocity of each station is shown in Table 1. When the distance from the sea floor is 3m, the deeper the water depth of a station is, the greater the current velocity is, and the finer the surface sediment is. The current velocities at the stations in the trough (Stations 2* and 4*) are much larger than those on the ridge (Stations 1* and 3*).
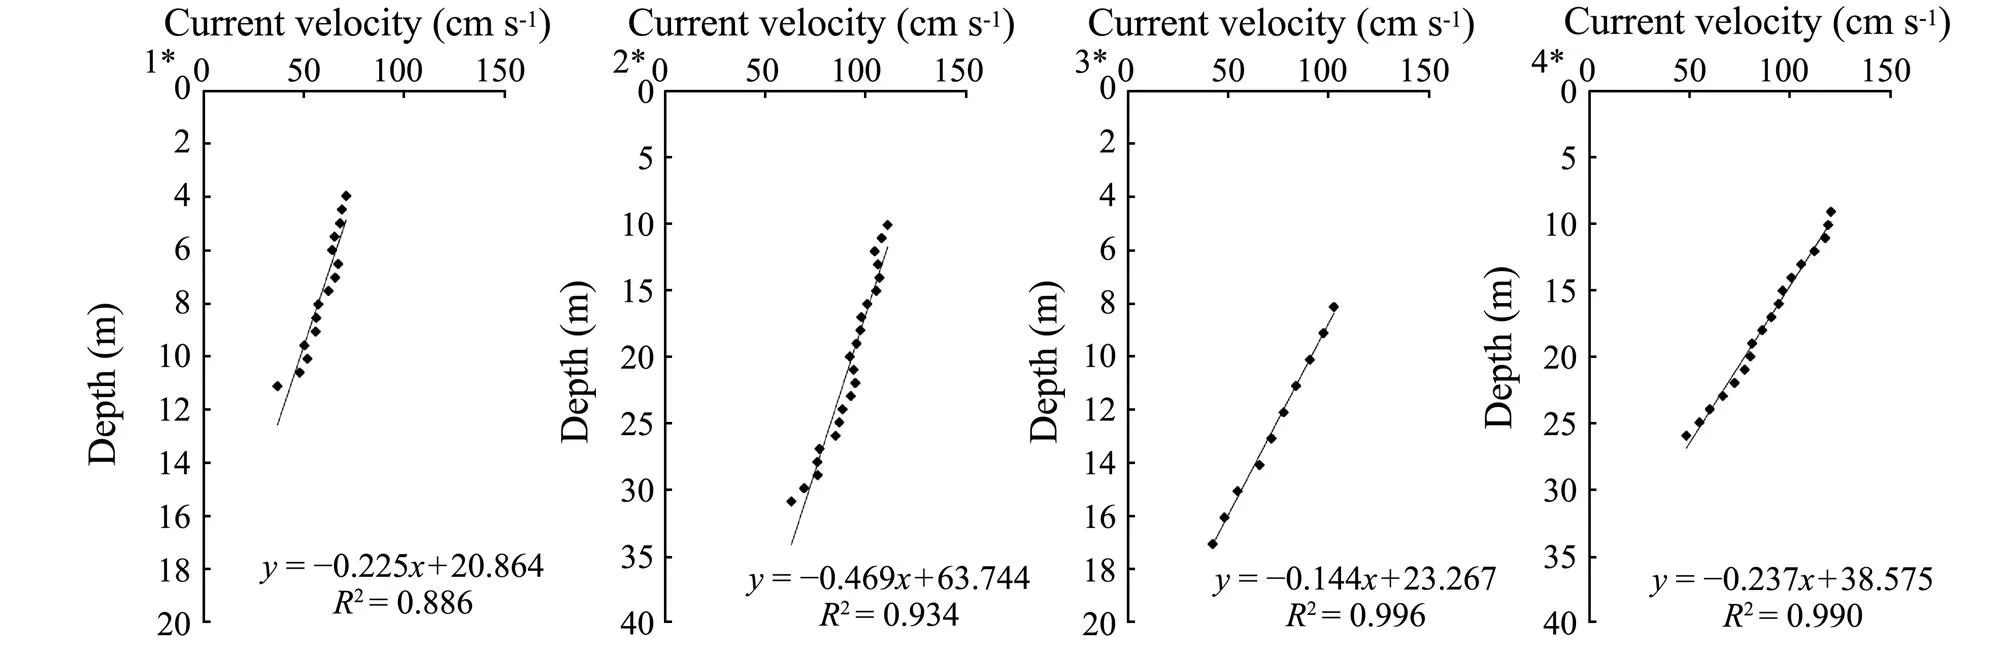
Fig.7 The diagram of water depths vs. the current velocities in the lower segment (the water column below the fastest current layer and down to 3m above the sea floor) during the flood tide.
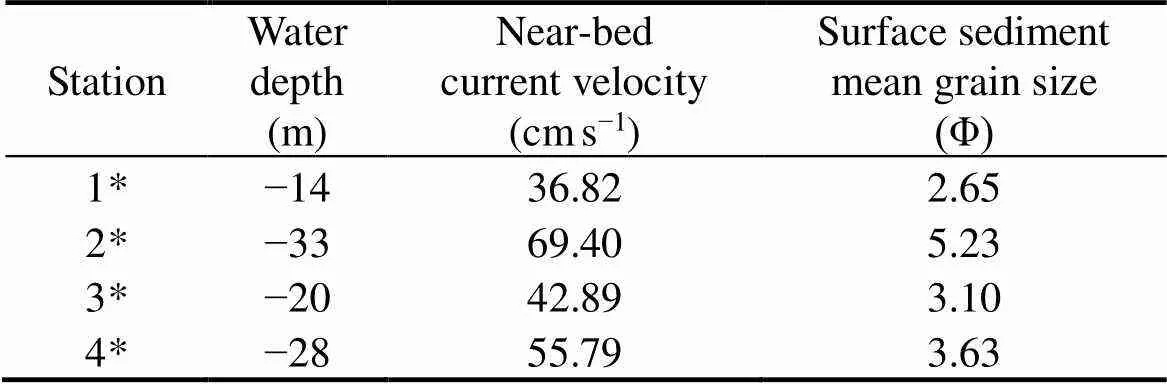
Table 1 Water depth, near-bed current velocity and mean grain size of surface sediments at each station
4.1.3 Explanations for the ridge-trough differences in current velocity
Regardless of the water above the top of the shoal, the ridge-trough topography is quite similar to that of a river. A trough can be regarded as a river channel with a large width-depth ratio, and a ridge can be regarded as a flooded floodplain. A trough possesses a lager velocity than a ridge, and the central channel of a river possesses a larger velocity than a floodplain. Both ridges and floodplains are material accumulation areas with small current velocities. Here, an important problem for this study is proposed: why is the near-bed current velocity on a ridge smaller than that in a trough?
We propose two explanations. The first is the loss of kinetic energy. A flowing current has to overcome some resistance and consume energy (Zhang and Hua, 1988). The rougher the seabed is, the more energy loss there would be, and the smaller the velocity would be (Grass, 2006). Compared with the troughs, the ridges, with the coarser grains and developed sand waves (Liu., 1996), are rougher and make the flowing fluid lose greater kinetic energy.
The second is the conversion of kinetic energy. Due to the angle between the current direction and the strike of sand ridge, the current below the top of the ridge will inevitably experience an initial climb and then slip downhill. The kinetic energy is converted into gravitational potential energy when climbing, so the velocity decreases. The gravitational potential energy is converted into kinetic energy when slipping downhill, so the velocity increases. At the top of the ridges, the gravitational potential energy reaches a maximum and the kinetic energy reaches a minimum, which causes the lowest current velocity.
4.2 Response of Surface Sediments to Tidal Current Hydrodynamics
4.2.1 Response of grain size characteristics
Liu and Xia (1995) compared the empirical incipient velocity curves proposed by scholars and found that their conclusions were consistent: grains with sizes of 0.1–0.2 mm are the easiest to be moved. The coarser or finer grains have larger incipient velocities due to gravity or cohesion(Zhang, 2012).
As for the troughs, a large velocity makes it difficult for particles to settle. Even if sand particles could deposited when current flows slow, they could be easily re-su- spended and transported away with the increase of the velocity accompanying the next tidal cycle because of the small incipient velocity. In brief, the troughs do not have suitable environments for sand particles to stay. However, the fine silt or clay are difficult to be re-suspended once deposited due to their large incipient velocities. As a result, the troughs are mainly covered by erosion resistant silt and clay combined with less sand and several gravels, exhibiting the small mean grain size and bad sorting.
As for the ridges, the particles carried by the current easily deposited on the ridges with small current velocities. The closer to the top of the ridge, the smaller the velocity is and the more suitable the area is for sand to stay. Coarse grains would be moved gradually to the top of the ridges. From the top to the two sides of the ridges, the mean grain size decreases. Therefore, the ridges are mainly covered by sand combined with a little silt and clay, exhibiting a large mean grain size and good sorting.
As for the subordinate sand ridges, the differences in the current velocities cannot be known between the subordinate sand ridges and the neighboring deep troughs due to our limited data. However, as the sediments on subordinate sand ridges have larger grain sizes and better sorting, we can predicate that the near-bed current velocities over subordinate sand ridges are smaller than those in the deep troughs. Otherwise, the coarse grain content could not be so high. Compared with the sand ridges, smaller grain size of the sediments on the subordinate sand ridges could adapt to an environment with a fast flow.
4.2.2 Response of heavy mineral characteristics
Mineral compositions are different between the sediments from the ridges and the troughs, according to the distributions of the contents in profiles. However, the values have some limitations since the percentages of the minerals are determined as ‘component data’ (Aitchison, 2003) with a sum of 1. It is difficult to draw a convincing conclusion based on the analysis of the available mathematical statistics to these data. To be precise, the hydrodynamic response of sediments to tidal currents is merely related to the physical properties of particles, among which the most important parameter aside from grain size is density. The hydrodynamic conditions can be reflected from the mineral compositions merely because a specific mineral has a specific density. Thus, there is no significant meaning to simply analyze the distributions of the contents for a specific mineral species.
As there are varieties of mineral species with densities that differ from one another, and in situ measurements are difficult to implement, we defined an index as the proxy of the density of heavy minerals (D):
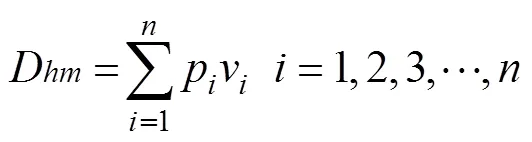
where pis density of heavy mineral species(The values are given in Table 2) andvis its weight percentage.
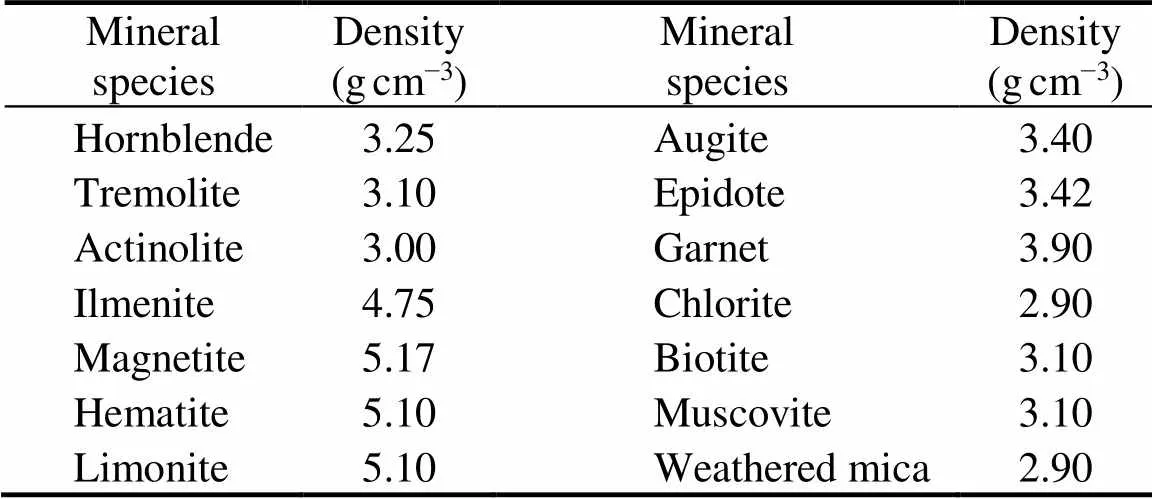
Table 2 Average densities of major heavy mineral species
TheDindex can be used to indicate the average densities of heavy mineral grains. TheDindex was calculated for the subsamples with the grain grade of 0.063– 0.125mm, which are used for the identification of detrital minerals. Although the mineral distribution law for this specific grain grade was biased, it is still representative because the specific grain grade components account for 20%–60% of the whole sample. Compared with lighter minerals, heavy minerals are more suitable for the calculation of theDindex due to the larger density range of mineral species (5.17 maximum, 2.90 minimum).
The distribution of theDindex is shown in Fig.5. The Dindex is large at the top of the sand ridges and the subordinate sand ridges and is small at the bottom of the deep troughs that lie beside the secondary sand ridges.The sedimentary environment not only refers to the hydro- dynamic intensity but also includes disturbance. Scholars have suggested that the disturbance of the environment could affect the ratio between different grain size compo- nents in the sediment (Pejrup, 1988; Flemming, 2000). They proposed that an environment with strong disturbance is not suitable for the deposition of clay. The stronger the disturbance is, the stronger the screening effect of the tidal current acts on surface sediments. Due to a low settling velocity, grains with smaller sizes are prone to suffer a large displacement and have difficulty remaining at one location. This should be the main reason for the low content of clay on the ridges. The small skew of the sediment at the top of the ridges mentioned in Section 3.3 could also be caused by this principle. Besides grains with small sizes, the settling velocities of grains with small densities are also small. Therefore, disturbance can affect the grain density of surface sediments. The disturbances over the ridges are quite different from those in the troughs. The wide distribution of active sand waves on the ridges instead of in the troughs (Liu., 1996) are the most simple and intuitive proof.
The ridges are mainly covered by sand particles (98% maximum) with small incipient velocities. The lack of silt and clay leads to the weak cohesion, so the impacts of disturbances are strong. Active sand waves are widely present on the ridges. The surface sediments on the ridges are universally screened by currents, and numerous grains with small densities are taken away due to the slow settling velocity. With the increasing clay and silt contents from the top of a sand ridge to the neighboring deep trough, the cohesion increases, and the impact of the disturbance becomes weaker. TheDindex decreases as sediments cannot be universally screened (Fig.8).
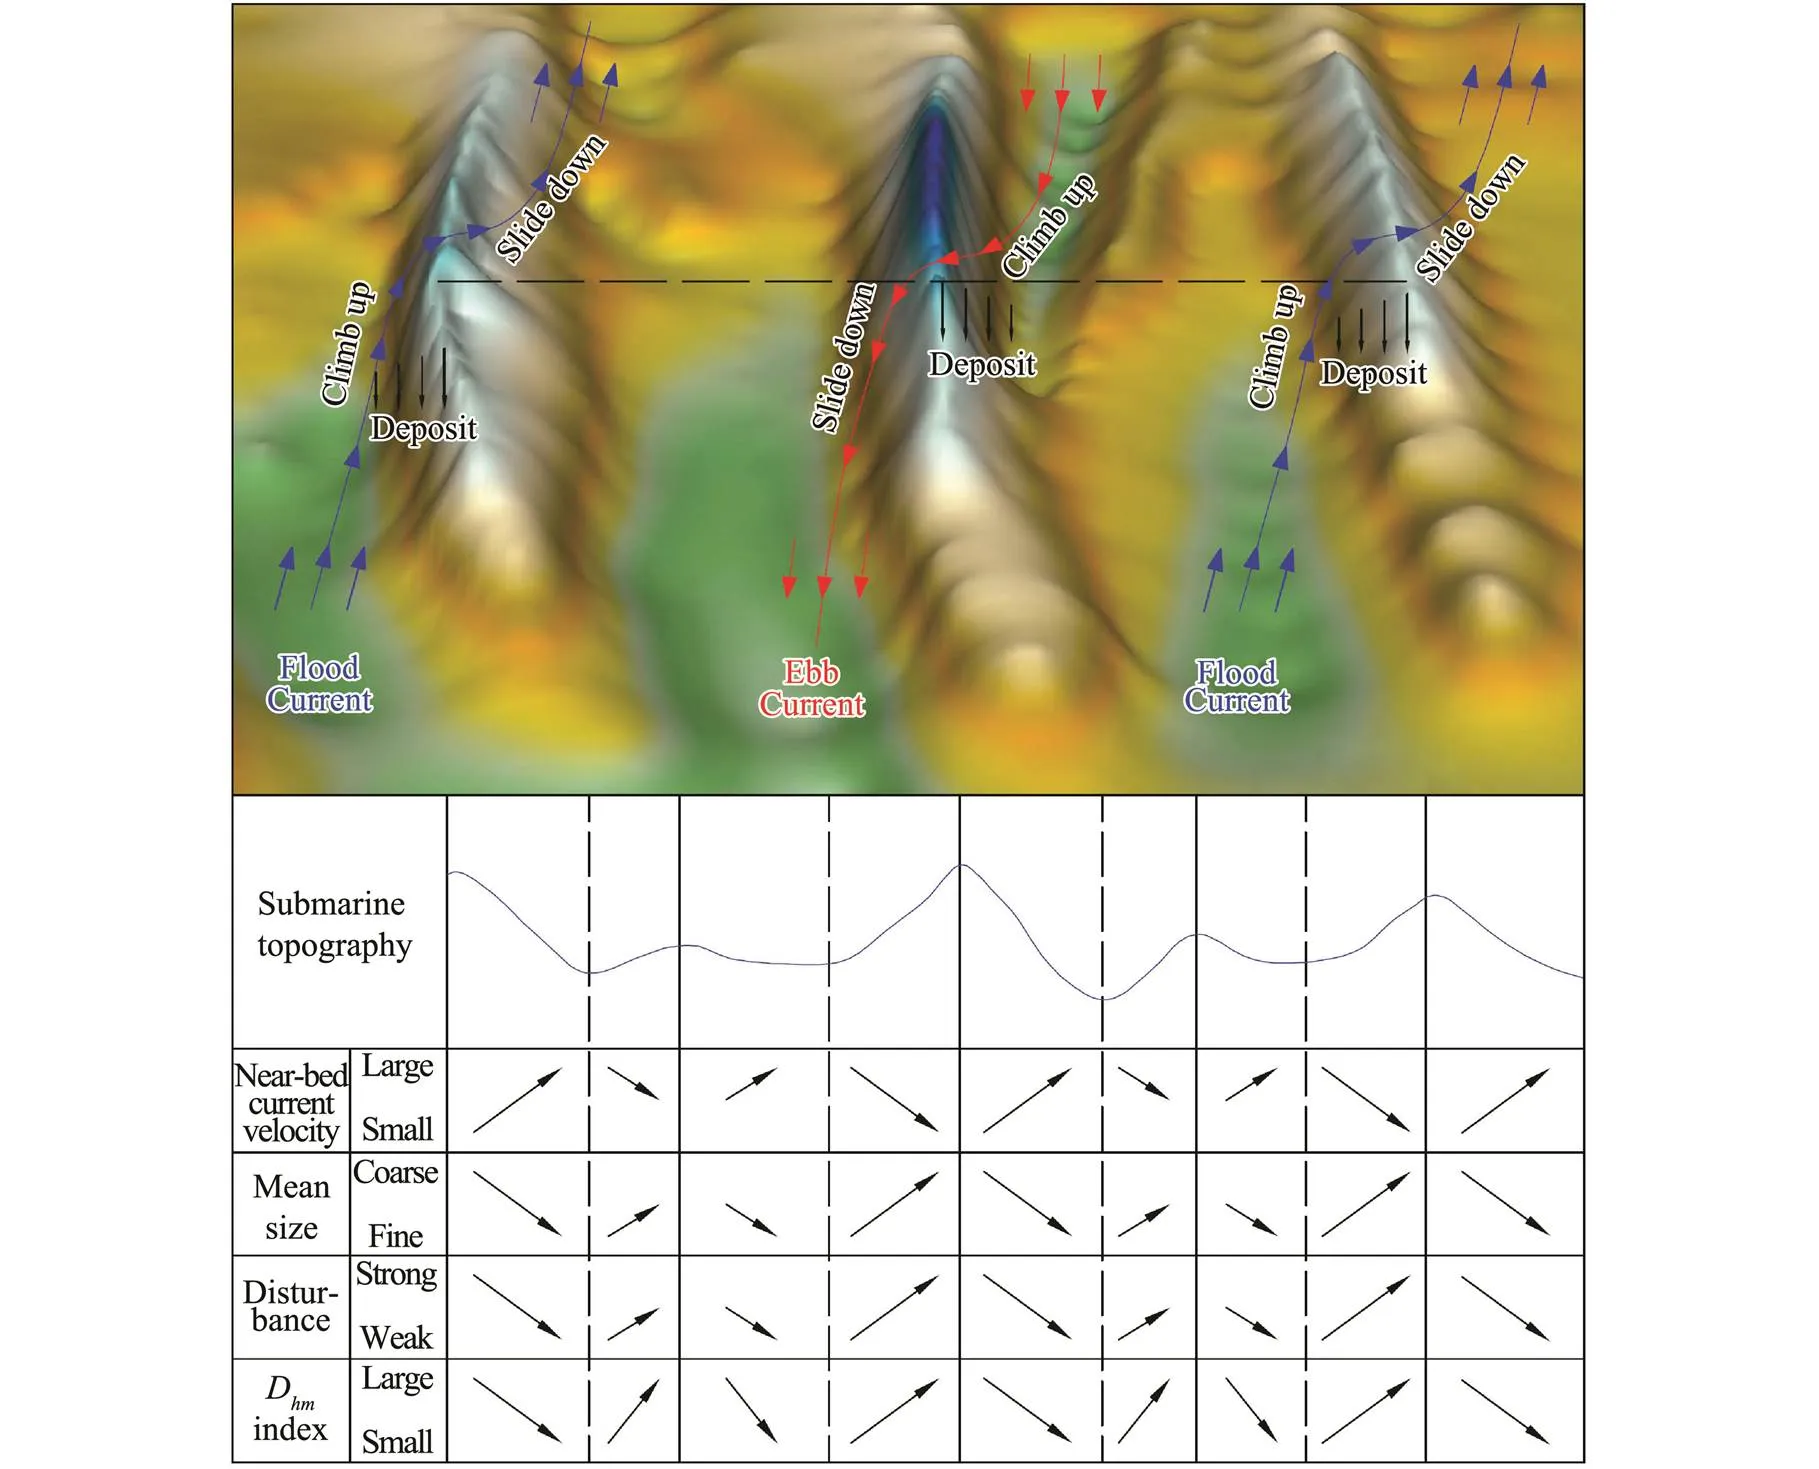
Fig.8 Sedimentary dynamical process in the Liaodong Shoal.
As for the deep troughs, the contents of silt and clay (up to 65%) are largest, the cohesion is the strongest and close packing of the mixed grains with various sizes leads to the weakest disturbance. The sediments can hardly be screened by the current due to the stable seabed, so theDindex reaches the minimum in the trough. Compared with the deep troughs, the subordinate sand ridges possess less silt and clay, stronger disturbance and greaterDindexes (Fig.8).
However, compared with those on the sand ridges, the grains with small densities are harder to retain on the subordinate sand ridges, and tend to produce greater displacements or be suspended after the initial fast flowing current. Thus, theDindex of the sediments on the subordinate sand ridges is sometimes higher than that of the ridges (Fig.8).
4.3 Sedimentary Dynamical Process of the Liaodong Shoal
Previous surveys showed that the current velocity outside the Liaodong Shoal is large, while being small in the Liaodong Shoal (Tang., 1993). The Liaodong Shoal was formed by the deposition of the materials carried by the currents as their velocities decrease. The deposition rates are quite different between the areas on the ridges and in the troughs. The modern deposition is thick on the ridges (tens of meters) and thin in the troughs (0–2m) (Geng., 1983). The Liaodong Shoal is essentially a differential sedimentation region and the product of selective retention of the materials under different sedimentary environments when the currents flow over the ridges.
There are four differences between both sides of the sand ridges. First, the depth in the profile shows that the western slope of the ridge is steep and that of the eastern slope is gentle. Second, the content of heavy minerals (ilmenite, magnetite,.) on the western slope of the ridges is slightly larger than that on the eastern slope. Third, the mean grain size of sediments on the western slope is slightly larger than that of sediments on the eastern slope, at the same distance away from the top of the ridge. Fourth, the coarsest sand particles deposited mainly in the southwest and northeast of the shoal. The distribution of the mean grain size presents a ‘coarse-fine-coarse’ pattern from southwest to northeast.
The rightward-deflected tidal current flows over sand ridges with an angle of 10˚–25˚. The materials carried by the current will naturally deposit on the ridges due to the decrease of velocities, which leads to the growth of the ridges. In addition, for the existence of the angle, the asy- mmetric hydrodynamic features between the flood currents and ebb currents could lead to the differences between both slopes of a sand ridge in topography characteristics and sedimentary characteristics. Therefore, the angle between current direction and sand ridge strike is a key factor for the growth of the sand ridges.
The Sedimentary dynamical process in the Liaodong Shoal can be described as follows (Fig.8): The currents flow into the shoal waters in rightward deflected directions. Although the angles are not large, the currents will eventually travel from a trough to a neighboring ridge. The current velocity gradually reduced due to both increasing losses of kinetic energy caused by increasing seabed resistance and conversion of kinetic energy into gravitational potential energy caused by its up climbing. Therefore, the carrying capacity of the currents becomes weaker, and a large quantity of materials deposit on the ridges. The closer to the top of a ridge, the smaller the current velocity is, and the more suitable the area is for the retention of coarse grains (., fine sand) because of their high incipient velocities. Coarse grains are gradually transported to the ridges, which will cause an increase in grain size towards the tops of the ridges (Fig.8). As the currents flow over a ridge, the velocity increases due to both decreasing losses of kinetic energy caused by decreasing seabed resistance and conversion of gravitational potential energy into kinetic energy caused by down sliding. The deposition gradually reduced, and with the increase of the current velocity, particles with low incipient velocities will be re-suspended and transported away by currents. Periodically, a flood tide and neighboring ebb tide controlled a deposition cycle.
4.4 Evolution of the Liaodong Shoal
4.4.1 Degradation of sand ridges and development of subordinate ridges
Sand ridges grow while several conditions are concurrently true, such as the stable supply of coarse-grained materials, stable sea level, reciprocating current and rapidly weakened current (Liu and Xia, 2004). If one of the conditions changes, sand ridges may degrade or even wither away. Simultaneously, the destruction of waves and currents will stop sand ridges to grow up to the sea surface. Liu. (1996) discovered the degradation of the Liaodong Shoal by comparing the water depths in 1959 with those in 1972. They found that the −10m isometric line on the 3# sand ridge has disappeared, and the −20m isometric line has shrunk.
After comparing the water depth in 1978 (derived from the sea charts published by the Nautical Guarantee Department of the PLA Navy Command in 2005) and the water depth in 2012, we plotted the changes of the −20m isobath for each sand ridge (Fig.9). The sand ridges have shrunk in the past 35 years, most obvious for ridges 2# and 4#. Insufficient material supply is the most important factor leading to the degradation of sand ridges. With the deepening of the Laotieshan Waterway, the material supply reduced, and the amount of materials carried by the currents is far less now than it was. The sediments on the Liaodong Shoal were transported to the north, resulting in the reduction of the shoal scale.
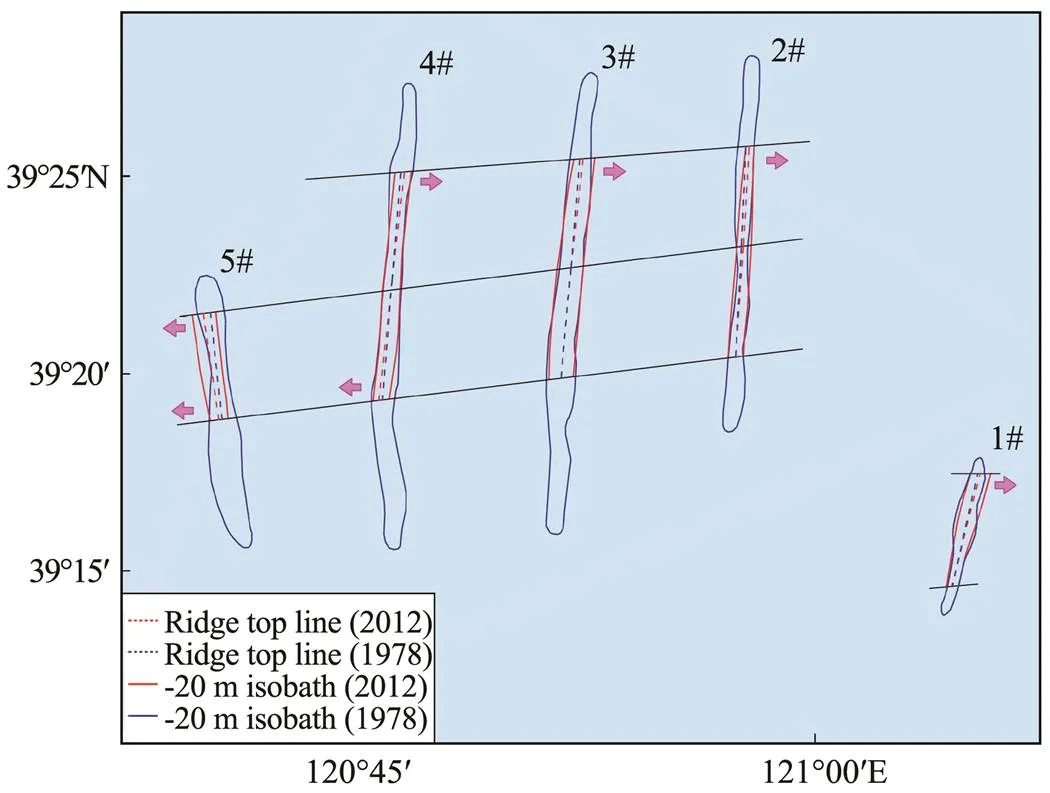
Fig.9 Comparison of −20m isobath and ridge top line be- tween 1978 and 2012.
The material accumulation and human activities reduced the tidal prism in the Bohai Sea (Liu and Xia, 2004), leading to the reduction of the carrying capacity of tidal currents. The deposition status in the trough has changed in areas where deposition has been difficult. The three water depth profiles in Fig.5 show that subordinate sand ridges has developed in the troughs, and in the further north, the scale of a subordinate sand ridge is greater. The tidal current measurements show that the current velocities in the south of the troughs are greater than those in the north, which should be the reason for the difference in the scale.
4.4.2 Migration of sand ridges
After comparing the depth of water in 1978 and 2012, we plotted the variation of the top line of each ridge (Fig.9). In the past 35 years, the northern part of the 1# sand ridge has migrated eastwards by about 100m with no significant change in the southern part. The northern part of the 2# and 3# sand ridge has migrated eastwards by about 120m with no significant change in the southern part. The northern part of the 4# sand ridge has migrated about 80m to the east and about 130m to the west for the southern part. Significant overall displacement occurred on the 5# sand ridge. The northern part migrated about 240m to the west and the southern part migrated about 120m to the west. On the whole, the northern parts of the sand ridges generally migrate to the east, while the southern parts are generally in relative dynamic equilibrium without significant changes. The 5# sand ridge and the southern part of the 4# sand ridge are rather special and unexpectedly violently migrate to the west.
According to the distribution of the major axis of the M2tide, it can be seen that the direction of the maximum tidal flow of the M2tide is 6˚–18˚ at station 2* and 17˚– 24˚ at station 4*. The E component of M2tide at station 4* was significantly enhanced. Correspondingly, the northern tails of the ridges also gradually extend northeastward. It seems that the extension direction of a sand ridge always keeps a certain angle with the tidal currents, showing that the current trend in the Bohai Sea is undergoing some changes. After the largest transgression in the Holo- cene, the sea level decreased slowly in the fluctuation. However, its time scale is long and it can hardly led to the change of the tidal current in short term. What led to changes in the tidal currents? Is it related to the change of shoreline or water depth? These questions deserve further studies in the future.
In the long run, due to the insufficient material supply, the degradation of the sand ridges will continue, and the heights of the sand ridges will decrease. At the same time, subordinate sand ridges will continue to grow in the troughs. When the topography changes of the troughs, caused by the growing of the subordinate sand ridges, lead to certain increases of current dynamics, the subordinate sand ridges will stop growing.
5 Conclusions
1) The water depths in the north of the Liaodong Shoal are shallower than those in the south. Ridges 2#, 3# and 4# are approximately parallel. Subordinate sand ridges developed on the bottom of the troughs.
2) The current directions are rightward deflected relative to the strikes of the sand ridges. The flood currents have a dominant position. Affected by the narrowing effect of the ridge seafloor, the current velocities first increase and then decrease from the surface to the seafloor, exhibiting an anti-‘C’ type vertical profile. The velocities of the lower currents are linearly correlated with the water depths. The near-bed current velocities over the troughs are estimated to be higher than those over the ridges, and this could be explained by the losses of kinetic energy together with the conversion between kinetic energy and gravitational potential energy.
3) The sedimentary characteristics are compatible with the tidal current dynamics. The high near-bed current ve- locity in a trough leads to the gathering of erosion resistant silt and clay particles, a low deposition rate, small mean grain size and bad sorting. Meanwhile, the weak disturbance leads to the enrichment of small-density minerals and a smallDindex. The low near-bed velocity over a ridge set the most suitable environment for the deposition of sand particles, and leads to a high deposition rate, large mean grain size and good sorting. The strong disturbance leads to the enrichment of large-density minerals and a largeDindex. A subordinate sand ridge possesses similar characteristics to a ridge, but has a larger near-bed current velocity, smaller mean grain size, worse sorting, and greater Dindex.
4) The existence of the angles between the current directions and the strikes of the sand ridges is a key factor for shoal growth. Asymmetric hydrodynamic features be- tween the flood and ebb currents lead to differences in the topography and sedimentary characteristics on both ridge slopes.
5) Insufficient material supply from the Bohai Strait has led to the degradation of the sand ridges and weakened currents lead to the growth of the subordinate sand ridges in troughs. The northern parts of the sand ridges generally migrate to the east, while the southern parts are generally in relative dynamic equilibrium without significant changes. The sand ridge 5# and the southern part of the sand ridge 4# are rather special and unexpectedly migrate to the west violently. So the tidal current in the Bohai Sea is undergoing some changes.
Acknowledgements
This work was supported by the National Natural Science Foundation of China (Nos. 41106039 and 41776059).
Aitchison, J., 2003. The Blackburn Press, New Jersey, 139-160.
Amos, C. L., and King, E. L., 1984. Bedforms of the Canadian eastern seaboard: A comparison with global occurrences., 57 (1): 167-208.
Caston, V. N. D., and Stride, A. H., 1970. Tidal sand movement between some linear sand banks in the North Sea off northeast Norfolk., 9 (5): M38-M42.
Chen, L., Luan, Z., Zheng, T., Xu, W., and Dong, T., 1982. Mineral assemblages and their distribution patterns in the sediments of the Gulf of Bohai Sea., 11 (1): 82-103 (in Chinese with English abstract).
Flemming, B. W., 2000. A revised textural classification of gra- vel-free muddy sediments on the basis of ternary diagrams., 20 (10-11): 1125-1137.
Geng, X., Li, S., Xu, X., and Li, C., 1983. The bottom geomorphological types and assembly characteristics in the Bohai Sea., 14(2): 128-137 (in Chi- nese with English abstract).
Grass, A. J., 2006. Structural features of turbulent flow over smooth and rough boundaries., 50(2): 233-255.
Harris, P. T., Pattiaratchi, C. B., Cole, A. R., and Keene, J. B., 1992. Evolution of subtidal sandbanks in Moreton Bay, eastern Australia., 103 (1-3): 225-247.
Houbolt, J. J. H. C., 1968. Recent sediments in the Southern Bight of the North Sea., 47 (4): 245-273.
Howarth, M. J., and Huthnance, J. M., 1984. Tidal and residual currents around a Norfolk Sandbank., 19 (1): 105-117.
Huang, H., and Li, C., 1998. A study on the present evolution of submarine radial sand ridges in the southern Yellow Sea using remote sensing images., 29 (6): 640-645 (in Chinese with English abstract).
Huang, H., Du, T., and Gao, A., 2009. Modern changes of tidal troughs among the radial sand ridges in northern Jiangsu coa- stal zone., 27(3): 658-666 (in Chinese with English abstract).
Huthnance, J. M., 1982. On one mechanism forming linear sand banks., 14 (1): 79-99.
Jin, B. F., 2012. Influencing factors and significance of the skew- ness coefficient in grain size analysis., 36 (2): 129-135 (in Chinese with English abstract).
Jin, Y., Cao, Z., Wu, J., Zhu, L., and Li, S., 2014. The sedimentary characteristics and sediment transport in the tidal depositional system of the eastern Bohai Sea., 13 (4): 685-692.
Jin, Y., Cao, Z., Wu, J., Zhu, L., and Wang, E., 2015. Tidal cur- rent movement and its bearing on sediment transportation on Liaodong Shoal., 35(6): 33-40 (in Chinese with English abstract).
Li, J., 2012. Characteristics of acoustic reflection and geological significance of Liaodong Shoal’s shallow strataPhD thesis. Ocean University of China.
Liu, S., Zhuang, Z., and Long, H., 2008. Environmental evolution and tidal sand sheet sedimentation in late Quaternary in the east Bohai Sea., 28 (1): 25-31 (in Chinese with English abstract).
Liu, Z., and Xia, D., 1983. A preliminary study of tidal current ridges., 14 (3): 118-133 (in Chinese with English abstract).
Liu, Z., and Xia, D., 1995. A probe into hydraulic problems about tidal current ridges., 13 (4): 23-29 (in Chinese with English abstract).
Liu, Z., and Xia, D., 2004. China Ocean Press, Beijing, 109-126 (in Chinese).
Liu, Z., Tang, Y., Wang, K., Xia, D., and Berne, S., 1996. Tidal dynamic geomorphic system in the east part of the Bohai Sea., 14 (1): 7-21 (in Chinese with English abstract).
Liu, Z., Xia, D., Tang, Y., Wang, K., Berne, S., Marsset, T., and Bourillet, F. J., 1994. The tidal deposition system since the Holocene in the eastern part of the Bohai Sea., 24 (12): 1331-1338 (in Chinese with English abstract).
McCave, I. N., 1979. Tidal currents at the North Hinder lightship, southern North Sea: Flow directions and turbulence in re- lation to maintenance of sand banks., 31 (1): 101-114.
McManus, J., 1988. Grain size determination and interpretation. In:Tucker, M. E., ed., Blackwell Scientific Publications, Oxford, 63-85.
Ni, Z., Wu, L., Zhang, X., and Xie, M., 2012. Patterns of vertical velocity profile of tidal current and their fractal law., 34 (3): 13-16 (in Chinese with English abstract).
Off, T., 1963. Rhythmic linear sand bodies caused by tidal currents., 46 (2): 324-341.
Parker, G., Lanfredi, N. W., and Swift, D. J. P., 1982. Seafloor response to flow in a southern hemisphere sand-ridge field: Argentine inner shelf., 33 (3): 195-216.
Pejrup, M., 1988. The triangular diagram used for classification of estuarine sediments: A new approach. In:de Boer, P. L.,., eds., Pergamon Press, Netherlands, 289-300.
Sanay, R., Voulgaris, G., and Warner, J. C., 2007. Tidal asymmetry and residual circulation over linear sandbanks and their implication on sediment transport: A process-oriented numerical study., 112 (C12): 2224.
Smith, J. D., 1969. Geomorphology of a sand ridge., 77 (1): 39-55.
Soulsby, R. L., 1981. Measurements of the Reynolds stress com- ponents close to a marine sand bank., 42 (1): 35-47.
Swift, D. J. P., 1975. Tidal sand ridges and shoal-retreat massifs., 18 (3): 105-133.
Swift, D. J. P., and Field, M. E., 2010. Evolution of a classic sand ridge field: Maryland sector, North American inner shelf., 28(4): 461-482.
Tang, Y., Liu, Z., and Yao, L., 1994. M2tidal current in Bohai Sea and its relation with evolution of tidal current ridges over- shoal off Liaodong Peninsula., 13(1): 25-30 (in Chinese with English abstract).
Tang, Y., Yao, L., and Liu, Z., 1993. Characteristics of the tidal current movement and its relationship with the dev., 11 (4): 9-18 (in Chinese with English abstract).
Wang, A. J., Wang, Y. P., and Gao, S., 2004. Determination of current velocity in blank layer of ADCP., 35 (10): 77-82 (in Chinese with English abstract).
Wu, D., Cui, X., Tong, C., and Zhang, R., 2008. Vertical distribution character of current velocity in Dongdagang channel., 32 (3): 49-54 (in Chinese with English abstract).
Xia, D., and Liu, Z., 1983. The submarine sand ridges in China waters., 1 (1): 45-56 (in Chinese with English abstract).
Xia, D., Liu, Z., Wang, K., and Berne, S., 1995. Stratigraphy and sedimentary environments in the eastern Bohai Sea since the late Pleistocene., 17(2): 86-92 (in Chinese with English abstract).
Yang, Y., Gao, S., and Wang, Y. P., 2008. Fine-grained sediment transport and resuspension process in a tidal channel of the northern Hangzhou Bay in China., 30 (2): 92-101 (in Chinese with English abstract).
Yin, P., 2003. Geomorphology and internal structure of postglacial tidal sand ridges on the East China Sea Shelf., 21 (2): 181-187 (in Chinese with English abstract).
Yuan, B., de Swart, H. E., and Panadès, C., 2016. Sensitivity of growth characteristics of tidal sand ridges and long bed waves to formulations of bed shear stress, sand transport and tidal forcing: A numerical model study.,127: 28-42.
Yuan, B., de Swart, H. E., and Panadès, C., 2017. Modeling the finite-height behavior of offshore tidal sand ridges, a sensitivity study., 137: 72-83.
Zhang, H. W., 2012. A unified formula for incipient velocity of sediment., 43 (12): 1387- 1396.
Zhang, S., and Hua, G., 1988. Water Resources and Electric Power Press, Beijing, 1-253(in Chinese).
Zhu, L., 2010. Research on dynamic geomorphology of tidal deposition in Liaodong ShoalPhD thsis. Ocean University of China.
Zhu, Y., 1998. Studies on mechanism of formation and maintenance of linear sand ridges.,13 (1): 23-27 (in Chinese with English abstract).
December 17, 2017;
May 7, 2018;
March 15, 2019
© Ocean University of China, Science Press and Springer-Verlag GmbH Germany 2020
. Tel: 0086-532-66781882
E-mail: zhulonghai@ouc.edu.cn
(Edited by Chen Wenwen)
杂志排行

Journal of Ocean University of China的其它文章
- Circulation and Heat Flux along the Western Boundary of the North Pacific
- System Reliability Analysis of an Offshore Jacket Platform
- The Mineral Composition and Sources of the Fine-Grained Sediments from the 49.6˚E Hydrothermal Field at the SWIR
- Research Progress of Seafloor Pockmarks in Spatio-Temporal Distribution and Classification
- Application of the Static Headland-Bay Beach Concept to a Sandy Beach: A New Elliptical Model
- Climatology of Wind-Seas and Swells in the China Seas from Wave Hindcast