Climatology of Wind-Seas and Swells in the China Seas from Wave Hindcast
2020-03-09QIANChengchengJIANGHaoyuWANGXuanandCHENGe
QIAN Chengcheng, JIANG Haoyu, WANG Xuan, and CHEN Ge
Climatology of Wind-Seas and Swells in the China Seas from Wave Hindcast
QIAN Chengcheng1), 2), 3), JIANG Haoyu2), 4), *, WANG Xuan5), and CHEN Ge2), 3)
1),266100,2),,266000,3),,266100,4),,430000,5),,200000,
The wind-sea and swell climates in the China Seas are investigated by using the 27-yr Integrated Ocean Waves for Geophysical and other Applications (IOWAGA) hindcast data. A comparison is made between the significant wave height from the IOWAGA hindcasts and that from a jointly calibrated altimetry dataset, showing the good performance of the IOWAGA hindcasts in the China Seas. A simple but practical method of diagnosing whether the sea state is wind-sea-dominant or swell-dominant is proposed based on spectral partitioning. Different from the characteristics of wind-seas and swells in the open ocean, the wave fields in the enclosed seas such as the China Seas are predominated by wind-sea events in respect of both frequencies of occurrences and energy weights, due to the island sheltering and limited fetches. The energy weights of wind-seas in a given location is usually more significant than the occurrence probability of wind-sea-dominated events, as the wave energy is higher in the wind-sea events than in the swell events on average and extreme wave heights are mostly related to wind-seas. The most energetic swells in the China Seas (and other enclosed seas) are ‘local swells’, having just propagated out of their generation areas. However, the swells coming from the West Pacific also play an important role in the wave climate of the China Seas, which can only be revealed by partitioning different swell systems in the wave spectra as the energy of them is significantly less than the ‘local swells’.
the China Seas; wind-sea; swell; wave climate; WAVEWATCH III
1 Introduction
Wind-generated surface gravity waves (hereinafter, simply called waves) are a ubiquitous phenomenon at the interface between atmosphere and ocean. Although waves are generated by the wind at the sea surface, they are not always coupled to the local wind as they can be further classified into two types: wind-seas and swells. Wind-seas are waves under growth or in equilibrium with the local wind while swells are generally regarded as waves which are not, or hardly, affected by the local wind. Swells are generated when waves propagate out of their generation area or when local wind diminishes or changes its direc- tion (Kinsman, 1965). It is noted that there is no definite boundary between wind-seas and swells as wind-seas will turn into swells in a gradual process. However, some rules of thumb are often used to identify wind-seas and swells roughly. For instance, some thresholds of waveperiod (usually 10s) or wave age (usually 1 or 1.2) may be selec-ted as criteria (., Kinsman, 1965; Drennan., 2003).
The purposes and concerns are different in the studies on wind-seas and swells. The studies on wind-seas mainly focus on the generation and growing processes while those of swells mainly focus on their propagation and the impacts on ocean/coastal engineering (., Janssen, 1989; Ardhuin., 2009). Therefore, the wave climate com- munity sometimes studies wind-seas and swells separately. Many studies on global or basin-scale wave climate have been conducted, highlighting the respective features of wind-seas and swells using the data from voluntary observing ships (VOS) (., Gulev., 2003; Gulev and Grigorieva, 2006), remote sensing (., Chen., 2002; Jiang and Chen, 2013), and model hindcast (., Hanley., 2010; Semedo., 2011; Fan., 2014). Each type of above data sources has its own advantages and disadvantages, but they are all useful tools in the studies of wave climate, about which a detailed review is made by Semedo. (2011, 2015). These studies have drawn many similar conclusions such as the distributions of wind-seas and swells and the swell prevalence in the open ocean.
Analyses of global or basin-scale wave climate mostly focus on the large-scale wave dynamics and features in the open ocean. In regional seas, many mesoscale effects or local factors, such as the coastal wind, shoaling, and limited fetches, will lead to the different results for the wind-sea and swell climates in enclosed seas and marginal seas from those in the open ocean. This is confirmed by the study of Semedo. (2015) which presented a de- tailed wind-sea and swell climatology in the Nordic Seas using downscaling ERA-40 reanalysis data.
The China Seas is a regional affected by the East Asia monsoon with northerly prevailing in the (boreal) winter and southerly prevailing in the summer, and it is affected by extratropical storms in the winter and tropical cyclones in the summer. The wave can be strong in this region (Huang., 2008), thus, many studies have been con- ducted on the assessment of wave energy in the China Seas (., Zheng., 2012, 2013; Wan., 2015), and there are also many studies on the wave climate and wave extrema in this region (., Huang., 2008; Li., 2016; Liang., 2016; He and Xu, 2016; He., 2018).Wave parameters including significant wave height (SWH), mean wave period (MWP), and mean wave direction (MWD) were employed to describe the wave climate in this studies without separating wind-seas and swells. These three parameters can only give a limited description of the sea state (Semedo., 2011) as two different sea states might have the same SWH, MWP, and MWD. The aim of this study is to present the climatology of wind-seas and swells in the China Seas, as analyzing the wind-sea and swell parameters separately can provide a more detailed description of the wave climate. There are no publicly available wave buoy data with more than 10 years’ time series in the China Seas as far as we know. As for remote sensing data, altimetry cannot separate the wave energy from wind-seas and swells, and synthetic aperture radars still have some problems regarding the data quality to restrict its application to wave climate (Jiang., 2017). The numerical wave model is still the best tool to investi- gate the wave climate of wind-seas and swells separately. Therefore, the Integrated Ocean Waves for Geophysical and other Applications (IOWAGA) dataset, which is a hindcast dataset of the numerical wave model WAVE- WATCH-III (WW3) (Tolman and the WAVE-WATCH- III Development Group, 2014), are employed in this study. The regional distribution of the wind-sea and swell wave parameters and their relation with the total wave para- meters in the China Seas are presented.
The paper is organized as follows. The WW3 data em- ployed in this study are briefly described and is validated against altimetry measurements in Section 2. The clima- tology of the wind-sea and swell parameters in the China Seas are presented in Section 3. The discussion and the concluding remarks are presented in Section 4.
2 Data and Methods
2.1 Model Data
IOWAGA dataset is the model hindcast outputs com- puted by WW3 with physical parameterizations of the source term package ST4 (Ardhuin., 2010) forced by the global 10-m wind (10) data from the National Cen- ters for Environmental Prediction (NCEP) Climate Fore- cast System Reanalysis (CFSR). The model simulation is performed at 0.5˚ spatial resolution and complemented by a multi-grid system including higher resolution up to 3΄ in some focused regions, and unstructured grids are employed for the coastal domains (Rascle and Ardhuin, 2013).The directional spectrum computed in the model is spaced in 32 frequency bins, which increase exponentially from 0.038 to 0.72Hz, and 24 directional bins with 15˚ spacing. The parameters of total wave fields such as total SWH and MWD employed in this study are integrated from the directional spectra. The spectrum at each grid is also partitioned into at most one wind-sea partition and up to five swell partitions using the method of Hanson and Philips (2001). For each partition, the SWH, peak wave period (PWP), and peak wave direction (PWD) can be obtained. Using the partition information, some other para- meters such as the frequencies of occurrence of crossing sea or crossing swell (Jiang., 2017) can be obtained. The outputs employed here are on a spatial resolution of 0.5˚×0.5˚ and a temporal resolution of 3h in the period of 1990–2016. This resolution is better for the studies of regional wave climate compared with other global hind- casts such as ERA-40 (Uppala., 2005). It is noted that although contemporary numerical wave models are remarkably good in predicting windseas, they are still facing many problems regarding the reliability of swell prediction (., Young., 2013; Stopa., 2016b; Babanin and Jiang, 2017). In this model, an explicit swell dissipation source term is included for parameterizing based on the result of Ardhuin. (2009). Although the swell problem is not totally solved, the data shows good agreement with the observations from both buoys and altimeters (., Ardhuin., 2010; Stopa., 2016a), and some studies about the evolution of swells are con- ducted using this dataset (.,Delpey., 2010; Jiang., 2016). The data is available from the FTP server of IFREMER (ftp.ifremer.fr) where more detailed informa- tion is available (Rascle and Ardhuin, 2013).
2.2 Validation
To demonstrate the errors of the model and evaluate the performance of the IOWAGA dataset in the China Seas, the forcing wind data from CFSR and the SWH data from the model output are compared with the corres- ponding measurements from altimeters in the region of interests. Altimeters can provide simultaneous measure- ments of sea surface wind speeds and SWHs. Particularly, the altimeter-derived SWHs are believed to have an accu- racy comparable with in situ measurements (., Zieger., 2009; Young., 2017), and are widely used for verification and validation of numerical wave models (., Ardhuin., 2010; Stopa., 2016a). The alti- meter dataset selected here is a merged and calibrated altimeter wind and wave database processed by the French ERS Processing and Archiving Facility (CERSAT) which merges the observations from a series of altimeter missions (Queffeulou., 2011). This dataset has been validated againstmeasurements and jointly calibrated via cross altimeter comparisons, thus, it can be regarded as homogeneous and consistent. Detailed information about this database is available at URL: http://tinyurl.com/kg7 kofg. In this study, the data from Topex-Poseidon, ERS-2, GFO, Jason-1, Envisat, Jason-2 in the period 2001-2010 are selected for the model validation.
The measurements of altimeters falling into the same spatio-temporal grid of the model output are averaged to smooth the altimetry measurements along the satellite tracks, and the data pairs from the altimeter and the model output are collocated. The scatter plots for the comparison are shown in Fig.1 where the color bars are on a logarithm scale with the data density in each 0.1×0.1ms−1or 0.05m ×0.05m bin. The bias, root mean square error (RMSE), and correlation coefficient () are computed. In the China Seas and their nearby waters (the spatial range for the comparison is shown in Fig.2), the bias of wind speed is −0.32ms−1, which means the wind speed is slightly under- estimated in CFSR. The value offor wind speed is 0.88 and the RMSE is 1.68. This result is in line with the comparison between CFSR and Envisat wind speed data made by Stopa. (2016a). The bias of SWH is −0.16m, which means the model also tend to slightly under- estimate the SWH. The two datasets are highly correlated with aof about 0.94 and the RMSE is about 0.37m.
Fig.2a displays the spatial distributions of the bias of SWH and Fig.2b displays the distribution of RMSE of wind speeds from CFSR. Relatively large errors are mainly located in coastal regions, especially near the coasts of Taiwan, the Philippine Islands, and the Indonesian Archi- pelago. The corresponding bias and RMSE distribution maps of SWHs are displayed in Figs.2c and 2d. Similarly, relatively large errors of SWHs are also mainly located in coastal regions. Near the aforementioned regions with large errors of wind speeds such as Taiwan and the Philippine Islands, the errors of SWHs are also relatively large possibly due to the errors in the forcing wind field. The bias of SWHs is generally over −0.3m and the RMSE is larger than 0.5m in these regions. Another region with RMSE of SWHs larger than 0.5m is the waters near the Ryukyu Islands, which might be mainly due to the insufficient sub-grid blocking and the lack of considering wave reflection/diffraction of islands in the numerical wave models. These regions significantly increase the overall errors in Fig.1, and except for these regions, most areas in the China Seas have a much lower error with the bias less than 0.2m and the RMSE less than 0.3m. In general, the SWHs from the model compare well with the observations and are sufficient to conduct studies of wave climate in the China Seas.

Fig.1 The scatter plots of collocated datasets in the China Seas and nearby waters from 2001 to 2010: (a) wind speeds from CFSR and (b) SWHs from WW3 hindcast versus corresponding measurements from altimeters. The data density is plotted on a logarithmic scale.
3 China Seas Wind-Sea and Swell Climates
All the data from the model are divided into four groups according to the seasonal partition of World Meteoro- logical Society: boreal spring (March–May, MAM), sum- mer (June–August, JJA), autumn (September–November, SON), and winter (December–February, DJF). Only the maps of extreme seasons, DJF and JJA, are visualized in the text in spite of some descri- ptions about MAM and SON. Both the mean wind and wave directions in the text are computed by averaging the zonal and meridional components separately. It is also noted that all the wind and wave direction arrows in the maps are not scaled with the background field.
3.1 Wind-Sea and Swell SWHs
The climatological means of the10and wind direction (arrows) in the China Seas for DJF and JJA are shown in Fig.3. The seasonality of the surface wind field in this re- gion, which is controlled by the monsoon, is noticeable in the figure. In winter, the mean10is higher than 8ms−1in most of the area of interest, and higher than 10ms−1in the Taiwan Strait, Luzon Strait, and to the southeast of Indo-China Peninsula. The region with the strongest mean wind speed is in the Taiwan Strait, and the sea with the weakest wind is the Bohai Sea, where the wind speeds are still higher than 7ms−1in winter. In summer, the climato- logical means of10are generally lower than those in win- ter with values of around 6ms−1in most parts of the China Seas. The10in the Taiwan Strait, Luzon Strait, Ryukyu Islands waters can reach 7ms−1, and the maximum10in summer is found to the southeast of Indo-China Peninsula (around 8ms−1), which is due to the summer southwest monsoon. The surface winds are predominantly northerly in the Bohai Sea, the Yellow Sea, and the East China Sea and are predominantly north-easterly in the South China Sea (SCS) during winter. During summer, the wind direc- tions are opposite in the area of interest, being predo- minated by southerly and south-westerly. As the winds are stronger in winter, the distributions of wind directions in MAM and SON (not shown) are more close to those in DJF than JJA with the north-easterly predo- minant wind.
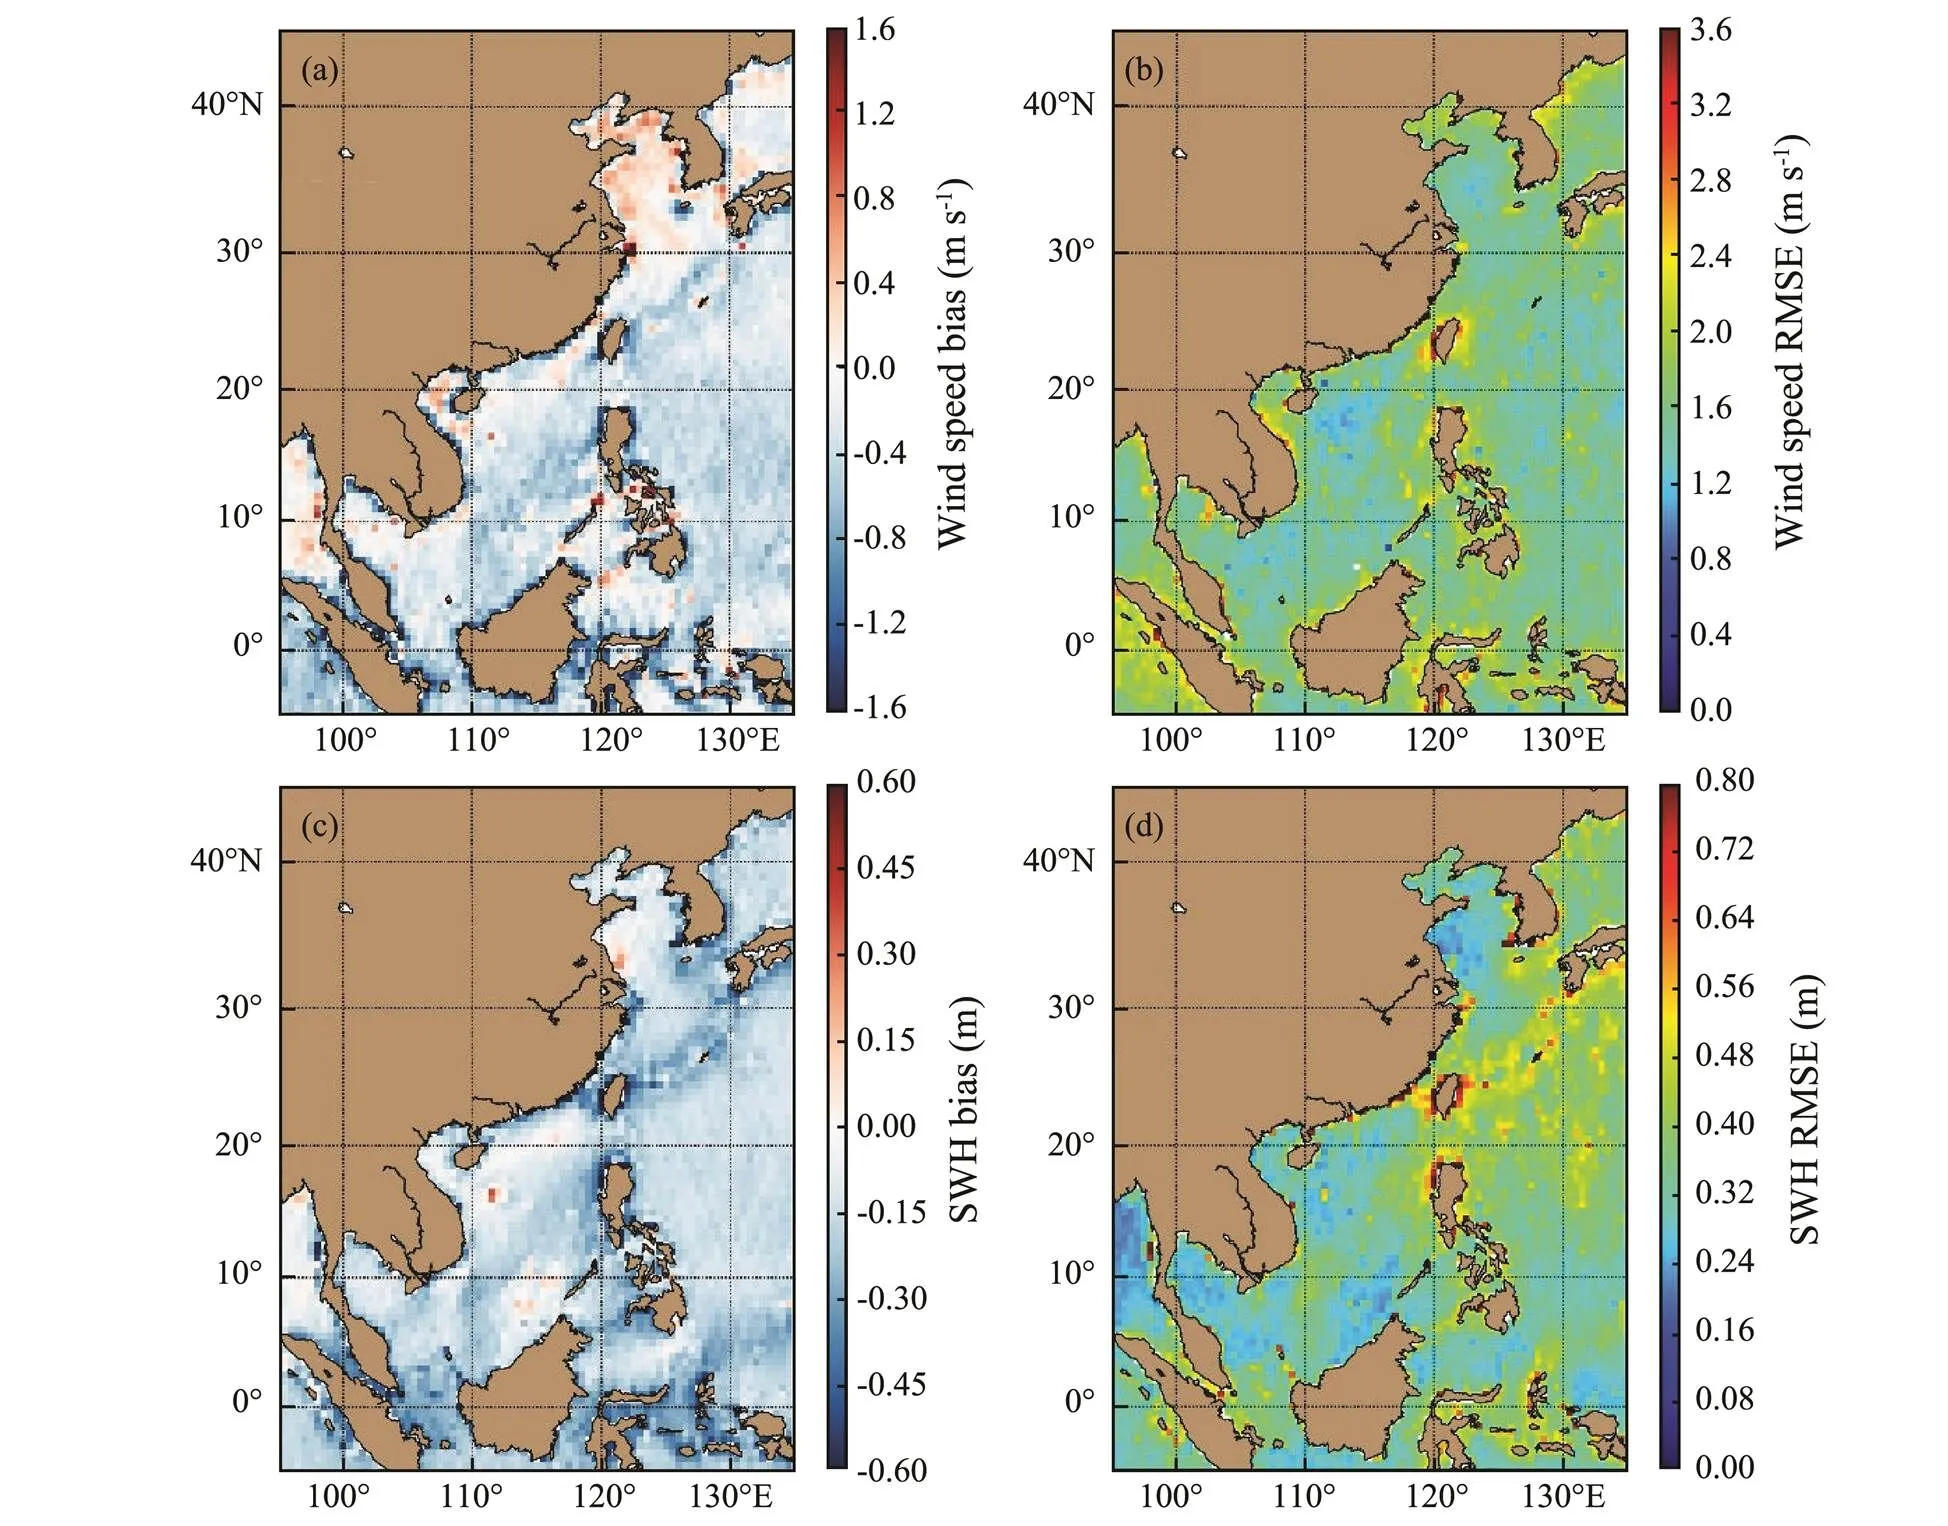
Fig.2 The spatial distributions of the errors presented as, (a) bias and (b) RMSE for wind speeds and (c) bias and (d) RMSE for SWHs, in the China Seas and nearby waters from 2001 to 2010.
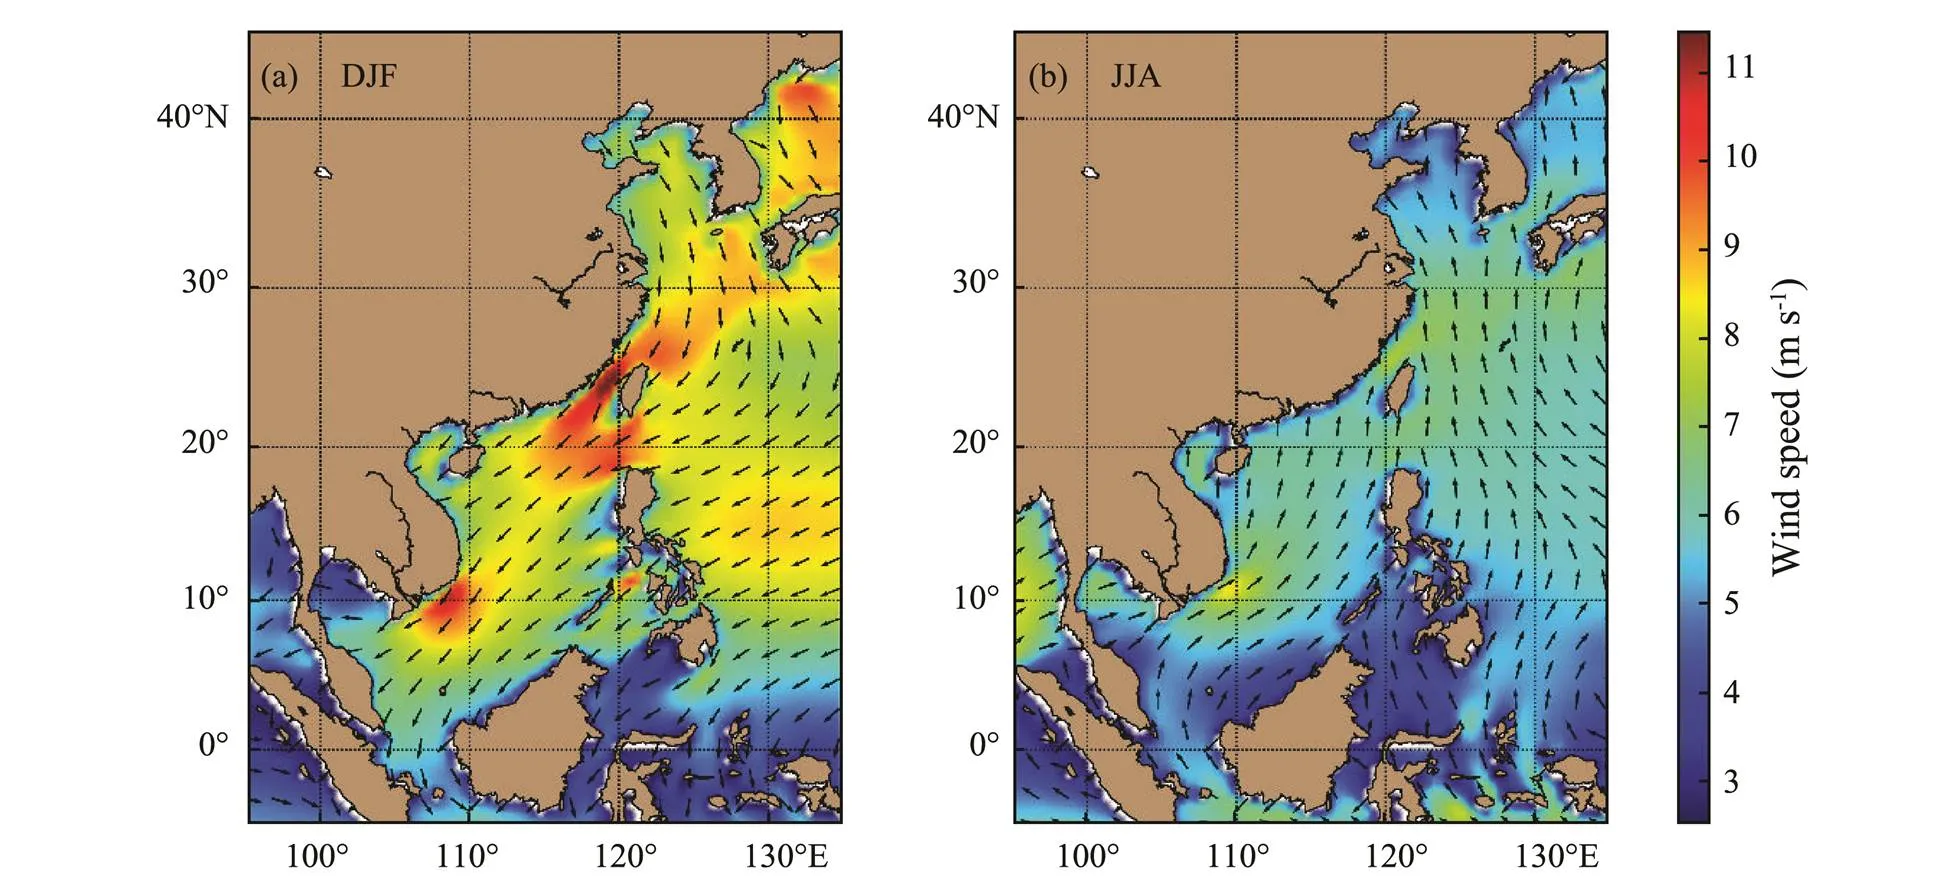
Fig.3 Seasonal averages of sea surface wind speed and wind direction in China Seas for (a) DJF and (b) JJA.
The seasonal maps of climatological mean SWH, wind- sea SWH, and swell SWH for DJF and JJA in the China Seas are displayed in Fig.4. The arrows in the maps represent the averaged total/wind-sea/swell MWD over the period of interest. The two most noticeable features in the figure are 1) the similarity between the patterns of total wave fields and wind-sea fields and 2) that the mean wind-sea SWHs are generally higher than the mean swell SWHs, in both seasons. Previous studies have shown that the swell energy is much higher than the wind-sea energy in the open ocean from a climatological point of view (., Semedo., 2011; Jiang and Chen, 2013). How- ever, this is not the case in the regional seas like the China Seas where limited fetches make it hard for wind- seas to convert into swells and swells cannot propagate over large distances even if they can be generated. As wind-seas are strongly coupled with the local wind, the distributions of wind-seas are consistent with those of surface wind in respect of both intensity and direction. The wind-sea SWHs are higher in DJF than in JJA and the wind-sea MWDs are opposite in the two seasons.
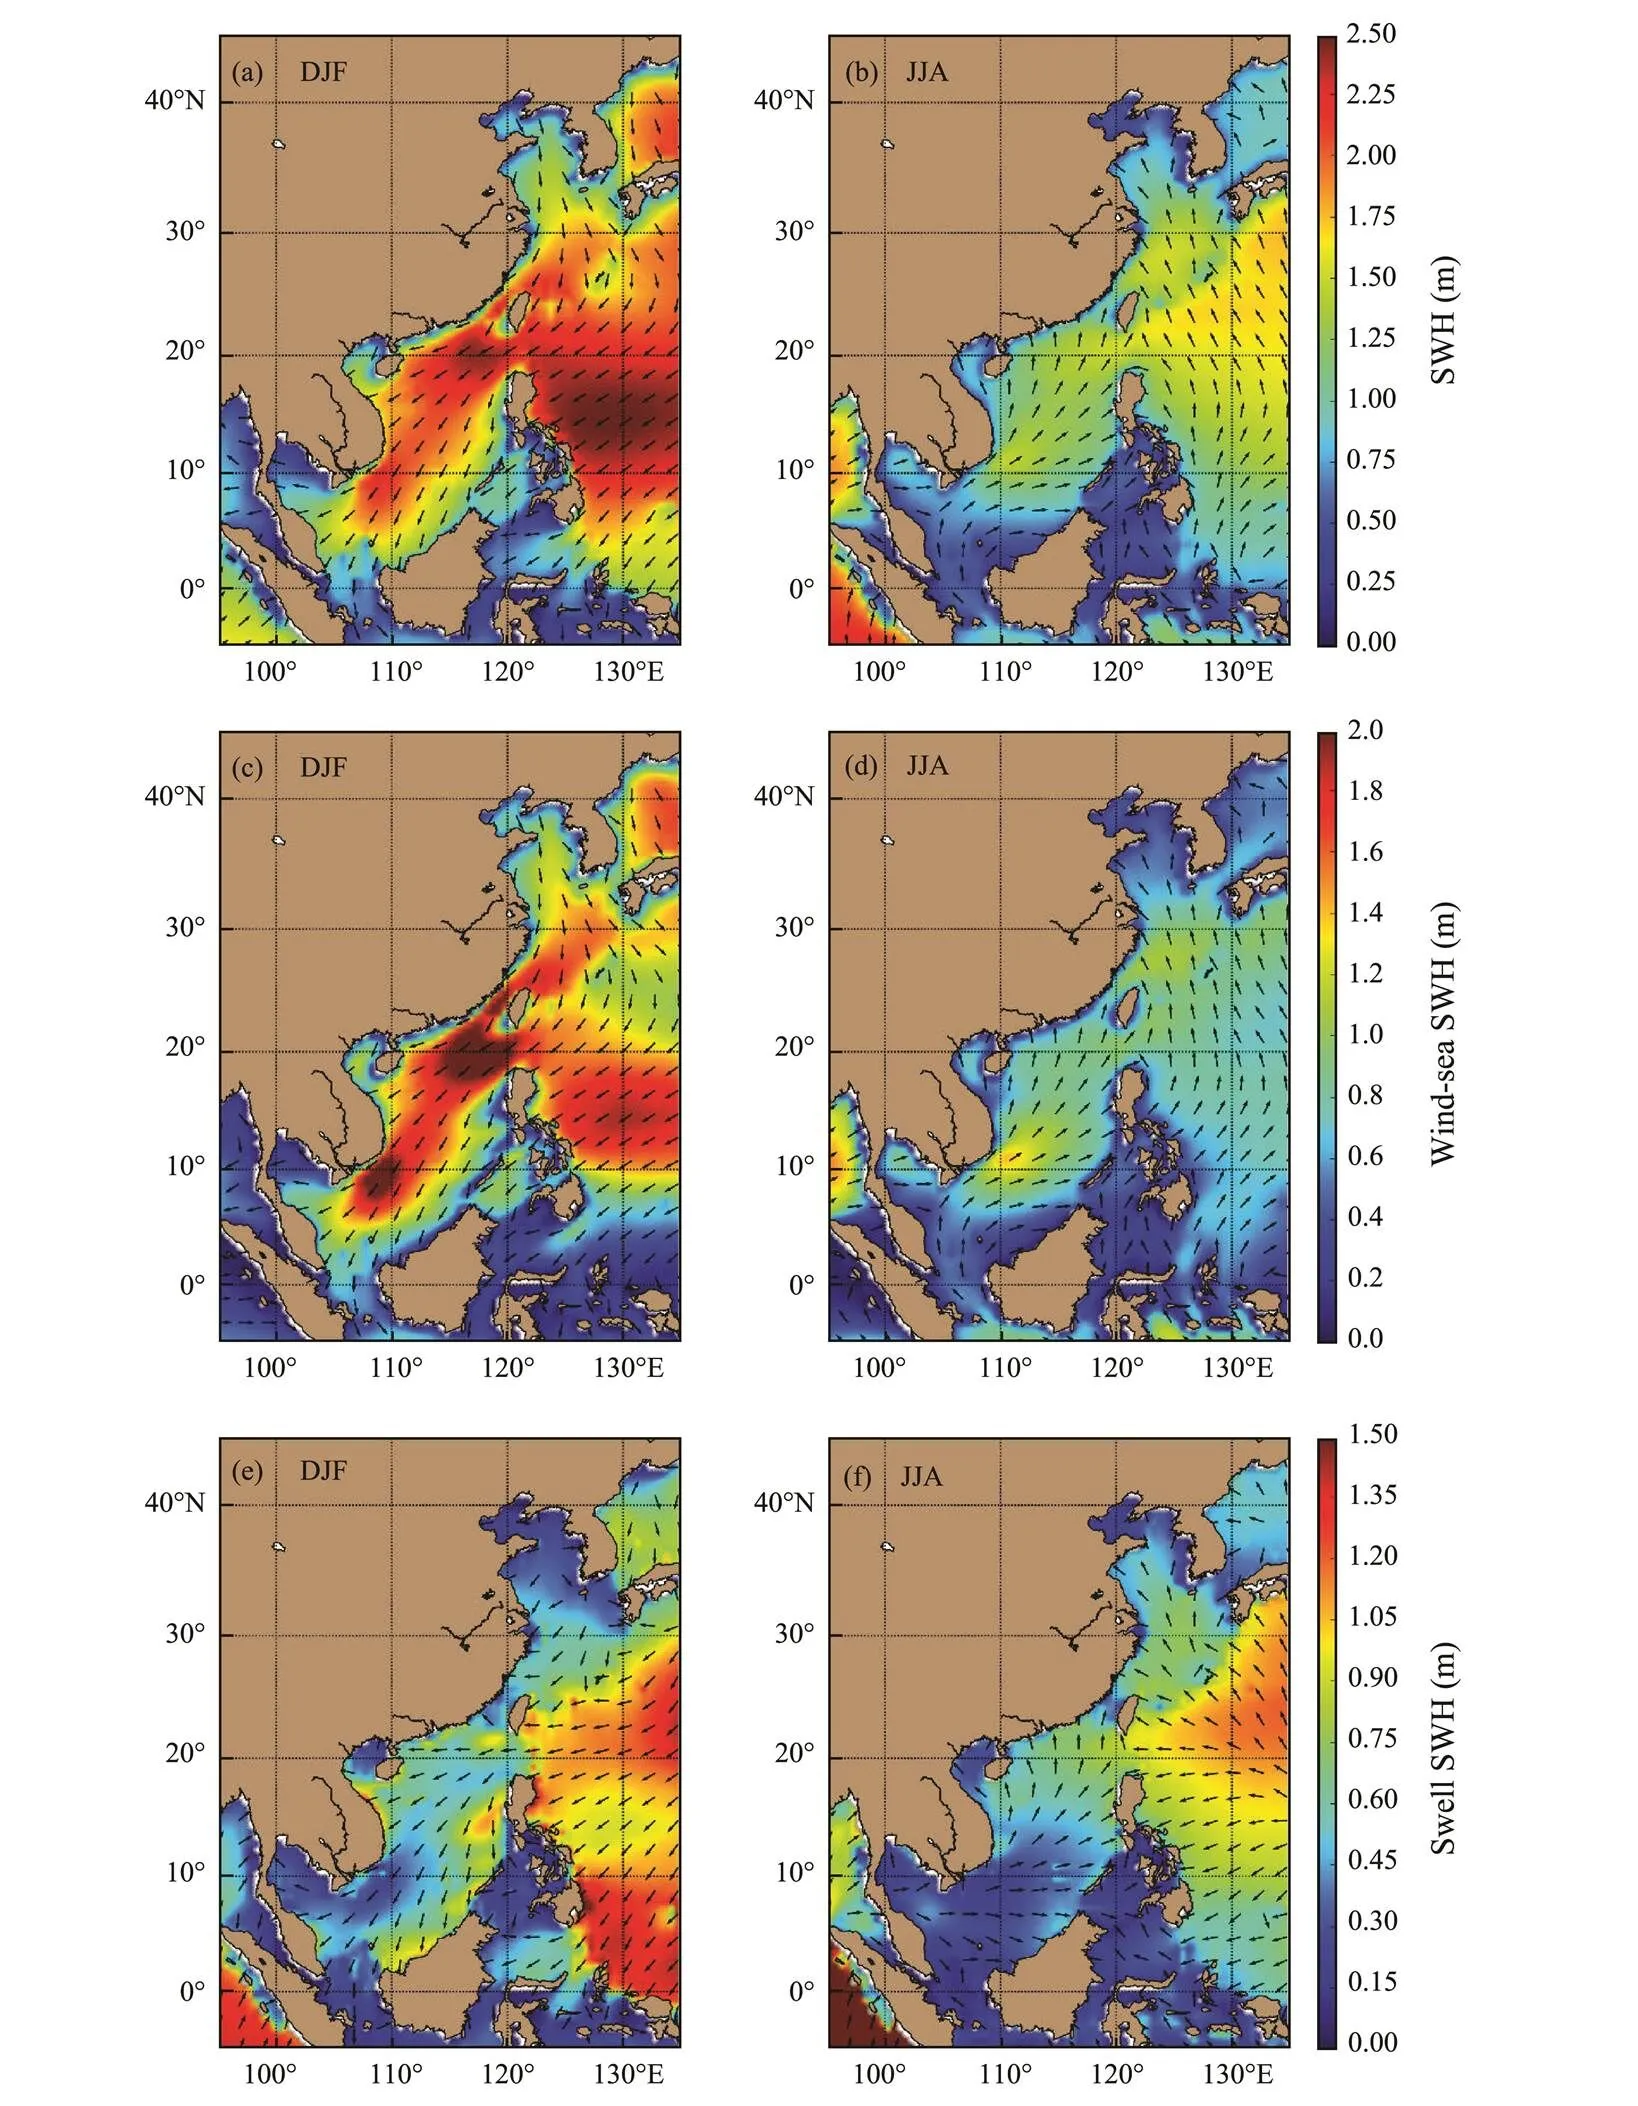
Fig.4 Distribution of seasonal averages of total SWHs and MWDs for (a) DJF and (b) JJA, wind-sea SWHs and MWDs for (c) DJF and (d) JJA, swell SWHs and MWDs for (e) DJF and (f) JJA in China Seas.
For swells, the situations are different in the SCS and the other three seas. The Bohai Sea is a small and shallow semi-enclosed sea so that the swells are weak in both DJF and JJA. Although the Ryukyu Islands can partially block the swells energy coming from the West Pacific leading to a clear boundary of swell SWHs between the East China Sea and the West Pacific, some swells from the West Pacific can still propagate into the East China Sea and the Yellow Sea. The swell climates in these two seas are the superposition of the westward swells from the West Pacific and the ‘local swells’ propagating southward in winter and northward in summer. Therefore, the total swell directions are generally southwestward in DJF and northwestward in JJA in these two seas. Sheltered by the islands around, few westward swells from the West Pacific can propagate into the SCS. Most swells in the SCS are ‘local swells’ which are residual waves of dimi- nished wind and waves that have just propagated out of fetches, thus, the wave directions of swells and wind-seas are similar in the SCS. In the open ocean, the regions with large wind-sea energy are usually also regions with relatively large swell energy and vice versa. For instance, both wind-seas and swells are strong in the midlatitude storm track regions and generally weak in the tropical regions (Semedo., 2011). The condition can be dif- ferent in regional seas. The SWHs of swells and wind- seas show somewhat opposite distributions in the SCS, which is particularly clear in JJA: the swells in the north of the SCS are from the northeastward wind-seas which propagate out of the fetches to the southeast of Indo- China Peninsula. In DJF, it can also be observed that most swells in the basin are located in areas around the central high-wind-sea areas. The results show that the local wind- sea and swell climates are mainly impacted by the orien- tation of fetches as well as the island sheltering, which is in line with the conclusions drawn by Semedo. (2015).
3.2 Wind-Sea and Swell Probabilities
The concept of wind-sea/swell probability presented by Chen. (2002) is widely used in the studies of wave climate. A binary classification to the sea states might be simplistic considering the complexity of the wave field, but it has been proved to be an effective and statistically meaningful description (., Hanley., 2010; Semedo., 2011, 2015). The probability of swells and wind- seas at a given grid point can be calculated asP=NandP=N, where,N, andNare the numbers of total events, swell-dominated events, and wind-sea-domi- nated events, respectively. According to the definition, the sea state should be dominated by either wind-seas or swells, so thatP+P=1.
Previous studies usually used the fully developed wind- wave relations, either the relation between wind speeds and SWHs (., Chen., 2002; Jiang and Chen, 2013) or the relation between wind speeds and peak wave phase speeds (., Hanley., 2010; Semedo., 2011, 2015), to determine whether the sea state is swell-domi- nated or wind-sea-dominated. For the cases that most of the wave energy is carried by the wave component with the highest peak in the spectrum, these two categories of criteria are equivalent (Pierson, 1991). However, for a mixed sea state with two or more wave components with similar energy, these criteria might become somewhat inaccurate. For instance, when the sea state is dominated by nearly fully-developed wind-seas, an overlapped swell system with only half energy will let the total SWH exceed the threshold of the fully-developed SWH, leading to the sea state being regarded as a swell-dominated one. Therefore, these criteria are only regarded as valid from a statistical point of view (Chen., 2002). The parti- tioning of wave spectra (., Hanson and Philips, 2001) makes the task of identifying the predominant wave much simpler since the SWHs of both wind-seas and swells can be obtained from the model output after spectral parti- tioning. If the swell energy is larger than the wind-sea energy at a given time and location, the sea state can be regarded as swell-dominated, otherwise, wind-sea-domi- nated. This definition can be used to diagnose the domi- nated wave component both case-by-case and statistically. In this study, the swell probability can then be simply defined asP=[H≥H], whereHdenotes the swell SWH and Hdenotes the wind-sea SWH. Similarly, the wind-sea probability will beP=[H<H]=1−P.
Chen. (2002) have shown that the swell proba- bility is more than 75% in most areas of the open ocean, even in the mid-latitude areas where strong wind-waves are generated, and this number can reach 100% in the tropical ‘swell pools’. Follow-on studies (., Hanley., 2010; Semedo., 2011; Jiang and Chen, 2013) also confirmed these results. The spatial distributions of wind- sea probabilities in the China Seas for DJF and JJA are shown in Fig.5. The distributions of swell probability, which are totally opposite to that of wind-sea, are not shown in order to save space. One of the most noticeable features in Fig.5 is the predominance of wind-seas in the China Seas. The wind-sea probability is more than 75% in most parts of the China Seas in DJF, and is generally lower in JJA, but it is still more than 50% in most areas of interests. In both seasons, the highest probability of oc- currence of wind-sea-dominated wave field is found to the southeast of Indo-China Peninsula, which is due to the outbreak of monsoon. In MAM and SON (not shown), this region also has high wind-sea probabilities, but not as high as in DJF and JJA. The Taiwan Strait has the wind- sea probability of nearly 90% in DJF and of about 80% in MAM and SON due to the local high wind speeds. Other regions with high wind-sea probability can be found in the Beibu Gulf and the Bohai Sea where the fetch length is very low and swells can hardly intrude. Lower wind- sea predominance is found in the leeside of the Luzon Island and the northeast coasts of Kalimantan Island in DJF, which can be linked with the low wind speeds in these regions as shown in Fig.3a. In JJA, the wind-sea predominance is also notably low in the Yellow Sea and the northeast of the SCS, with wind-sea probabilities of less than 50%, which can roughly be linked with the wind- sea and swell SWH patterns in Figs.4d and 4f.
In both two regions where swell probabilities are rela- tively high (the Yellow Sea and the northeast of the SCS), the swells from the West Pacific contributes signi- ficantly to the swell predominance. This can be confirmed by plotting the map of crossing swell probability in JJA (not shown) using the scheme of Jiang. (2017). It is found that both these two regions have the crossing swell pro- bability of more than 30%, showing that the energy of the ‘local swells’ and the ‘extraneous swells’ are often com- parable with each other. Using the partitioned wave spec- trum, the wave PWP and SWH roses at the point 20˚N, 120˚E for JJA representing the occurrence of wave events per direction are plotted in Fig.6 as an example. There are clearly two sets of wave systems with different directions, a westward one and a northeastward one. Limited by the fetch and the propagation distance, the PWPs of the northeastward waves at this point, even for swells, can hardly reach 10s. Meanwhile, nearly half of the westward waves (mainly swells coming from the West Pacific) have the PWP of more than 10s and can reach 20s. The frequencies of occurrences of the westward swell events are also generally higher than the northeastward ones. However, the swells from the West Pacific are mostly generated thousands of kilometers away, and their energies have been attenuated by frequency dispersion, angular spreading, and dissipation. Therefore, most of the swells propagating westward in the SCS only have an SWH of less than 0.5m, while the northeastward waves have much more energy. That is why the MWDs of both wind-sea and swells in JJA are northeastward at this point, even if the swells from West Pacific are non-negligible.
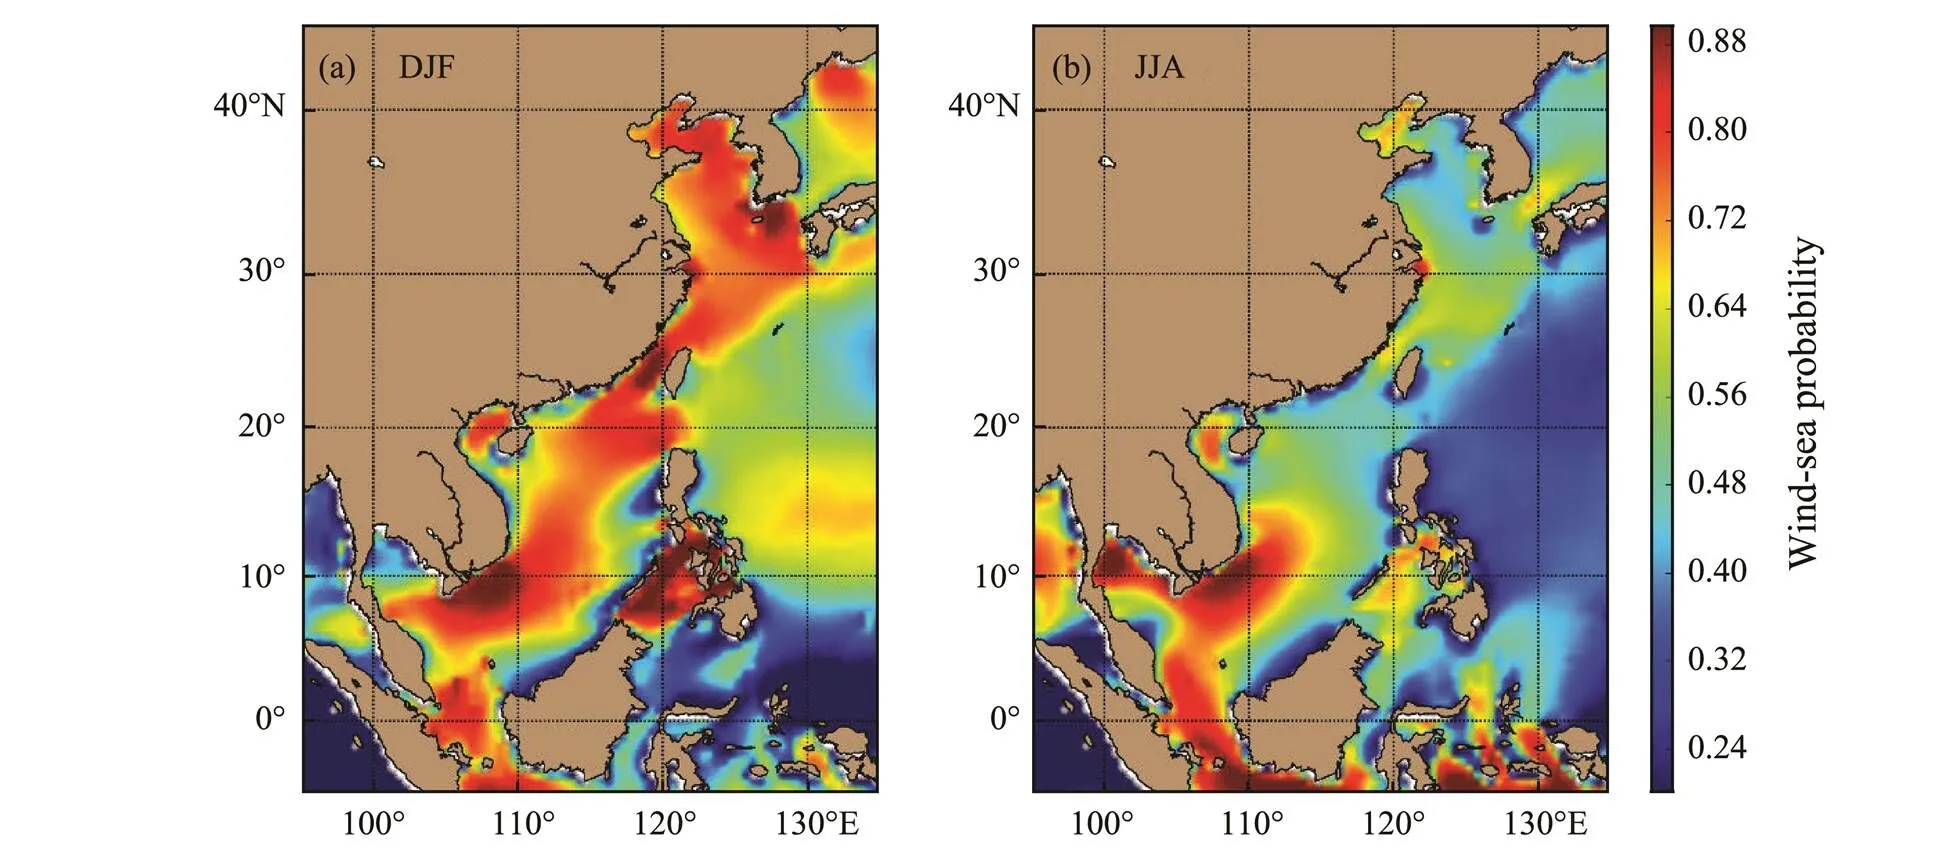
Fig.5 Seasonal distributions of wind-sea probability in China Seas for (a) DJF and (b) JJA.
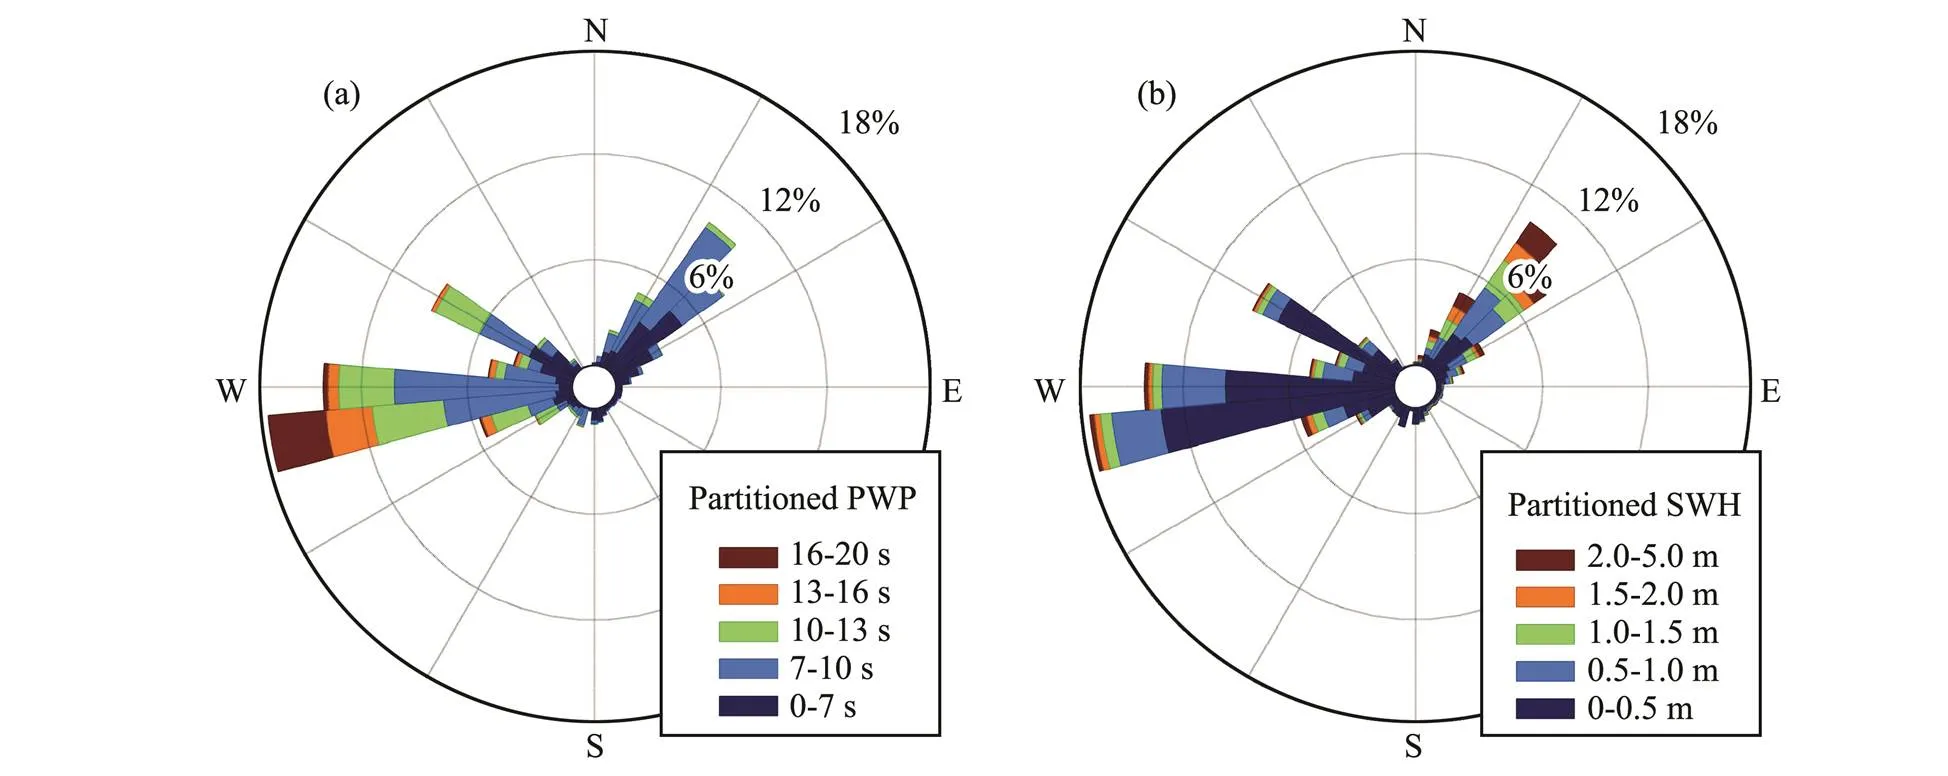
Fig.6 Wave rose plots of (a) partitioned PWD and (b) partitioned SWH at 20˚N, 120˚E for JJA. The direction of the sector denotes the direction that waves propagate towards.
3.3 Wind-Sea and Swell Energy Proportions
Fig.4 shows that the wind-sea SWHs are larger than the swell SWHs in most areas of interests in the China Seas, and Fig.5 shows that the wind-seas are also more preva- lent than swells in respect of time in the China Seas. To estimate the relative weights of wind-seas and swells in respect of energy, the energy densities per unit area in the China Seas were computed for both wind-seas and swells following the method of Semedo. (2011, 2015). The energy proportions of wind-seas and swells to the total wave energy are then computed and are displayed in Fig.7 (only the energy proportion of wind-seas is shown as that of swells is simply opposite). Not surprisingly, in spite of the different definitions, there are many similarities between the distributions of wind-sea probability and wind-sea proportion. For instance, the southeast of Indo- China Peninsula has high wind-sea energy proportions in both seasons. Areas with the lowest wind-sea energy pro- portions are located in the leeside of the Luzon Island and the northeast coasts of Kalimantan Island in DJF. How- ever, it is clear that the wind-sea proportions are signi- ficantly higher than the wind-sea probabilities over the areas of interests (the color bars in Fig.5 and Fig.7 are the same). By spatially averaging the data of the China Seas in Fig.7, it is found that more than 90% of the wave energy at the surface of the China Seas in DJF and more than 75% in JJA are wind-sea energy. Even in the Yellow Sea and the northeast of the SCS where the wind-sea probabilities are less than 50%, the wind-seas in JJA can still contribute more than 50% of the wave energy to the wave fields from a climatological point of view.
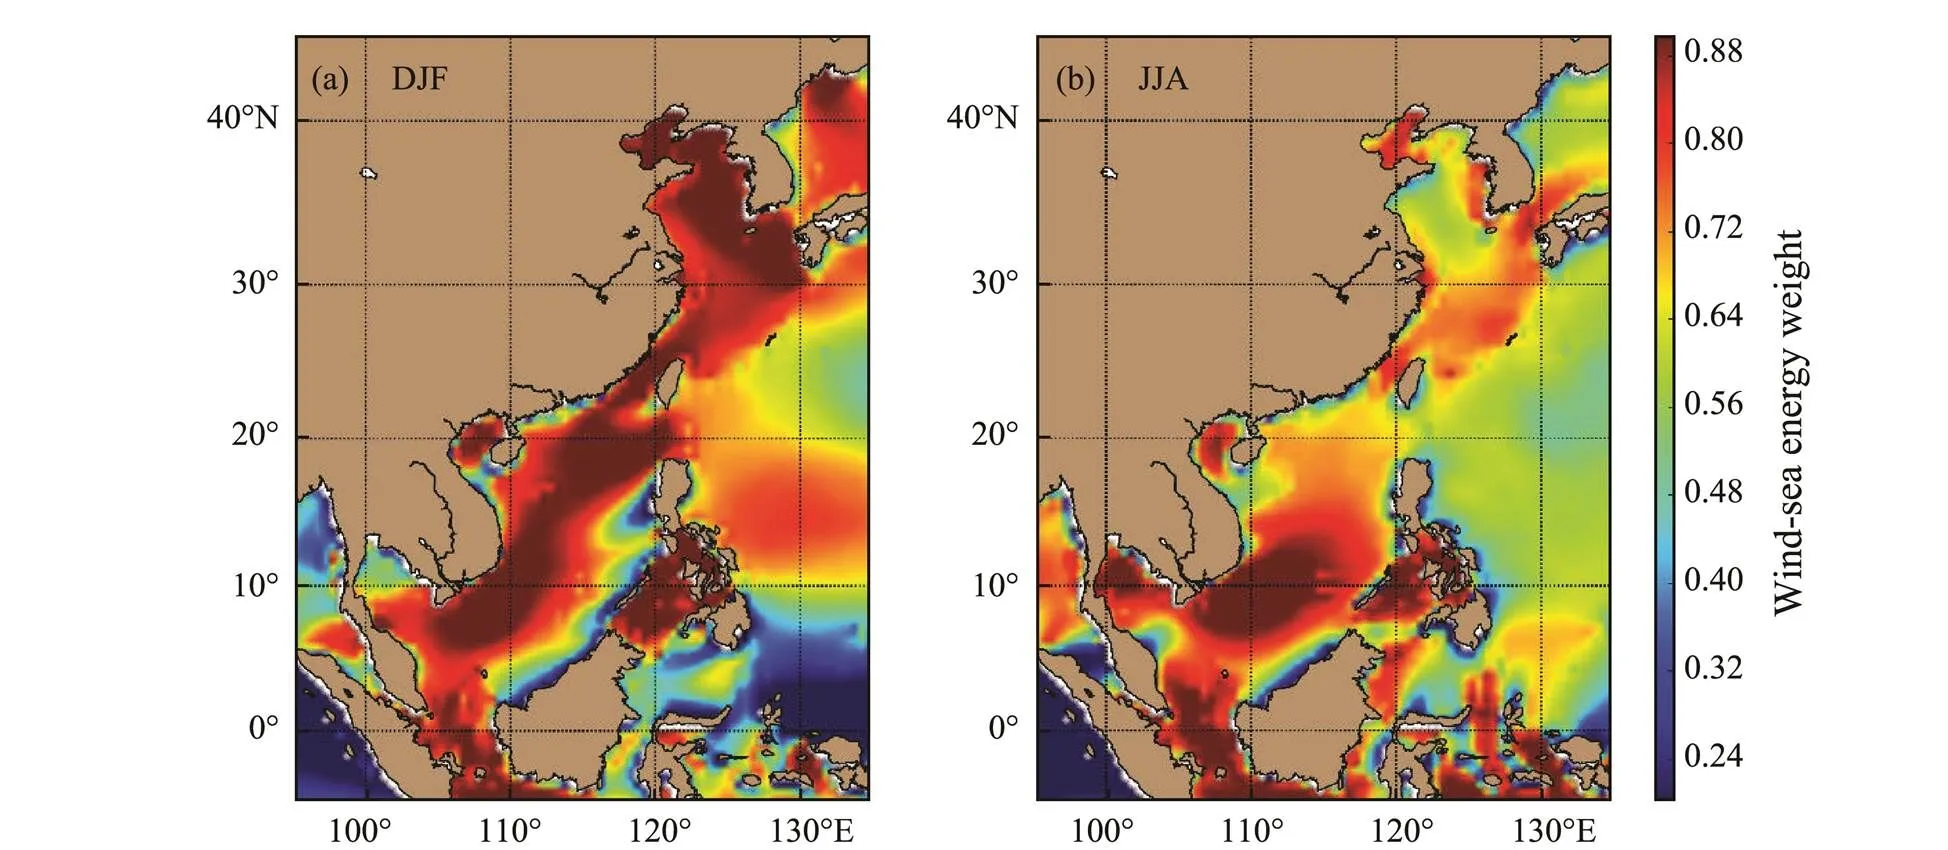
Fig.7 Seasonal distributions of wind-sea energy weight in China Seas for (a) DJF and (b) JJA.
On average, the wave energy during wind-sea-domi- nated events are higher than during swell-dominated events, as extreme sea states are more linked with wind-seas. For instance, Huang. (2008) pointed out the response of summertime extreme wave heights to local wind climate in the East China Sea. This can explain why the wind-sea energy proportion is systematically higher than the wind- sea probability at a given position from a climatological point of view. To demonstrate this phenomenon, the dis- tributionsof maximum SWHs for DJF and JJA in 2000 are shown in Fig.8 along with the corresponding wind-sea and swell SWHs. Extreme SWHs in China Seas are usually due to severe meteorological events such as extratropical storms in the winter and tropical cyclones in the summer. For instance, a typhoon event (BILIS, No.200010) can be observed with SWHs of more than 8m along the track in Fig.8b. Such spatial distributions of maximum SWHs are also plotted for other years and seasons (not shown). Al- though the spatial patterns of the maximum SWHs are different from season to season, they always have much higher consistency with the spatial patterns of the corre- sponding wind-sea SWHs than swell SWHs. This indi- cates that wind-seas are over-whelmingly predominated in such extreme sea states. In contrast, the swell-domi- nated events usually correspond to relatively low total SWHs. Therefore, even in the situation that the proba- bili- ties of wind-seas and swells are similar, wind-sea SWHs will have higher climatological mean than swell SWHs. Such a phenomenon can also be observed in the open ocean. The swell probabilities are also slightly higher thanthe swell energy proportions in the global ocean according to Fig.4 and Fig.6 of Semedo. (2011), indicating that the method of using the swell/ wind-sea probabilities to approximate the swell/wind-sea proportions presented by Jiang and Chen (2013) will lead to systematic errors and needs to be improved.
4 Discussion and Conclusions
The wave climatology in the China Seas is presented using the IOWAGA hindcast data from 1990–2016 in this study. The wind-seas and swells are analyzed separately considering the fact that the wave parameters integrated from the entire wave spectrum such as the total SWH might only give a limited description of the wave field. A multiple-source altimetry dataset of wind speeds and SWHs is employed to validate the performance of the WW3 model and the result confirms that the WW3 outputs employed in this study are sufficient for studies of wave climates in the China Seas.
The characteristics of wind-seas and swells in the China Seas are very different from those in the open ocean where swells dominate the sea states. In most areas of the China Seas, the SWH of wind-seas is significantly higher than that of swells and the wind-seas are predo- minant. On the one hand, wind-seas require sufficient time and space to grow into large swells and propagate away from their generation areas, but the limited fetches in the China Seas make the waves hard to reach a fully- developed state and to turn into swells. On the other hand, the islands around the China Seas shelter most of the swells from the West Pacific. Most of the swells in the China Seas are relatively short-wavelength ‘local swells’ which have just propagated out of their fetches. These features can also be found in other enclosed and semi- en- closed seas where the geometry of the coasts is an im- portant factor to influence the wind-sea and swell climate. In the winter of the China Seas, the relatively stronger norther corresponds to a longer fetch for the fully- developed sea state so that the predominance of wind- seas is more obvious than in the summer when the swell probabilities can be more than 50% in some parts of the areas of interests. However, even in the waters where the swell probabilities are more than 50%, the energy weights of swells may be less than 50%. The energy weights of wind-seas are generally higher than the wind-sea pro- babilities in a given location because wind-sea-domina- ted events usually have higher energy than swell-domi- nated events and most extreme wave events with high SWHs are related to wind-sea conditions.
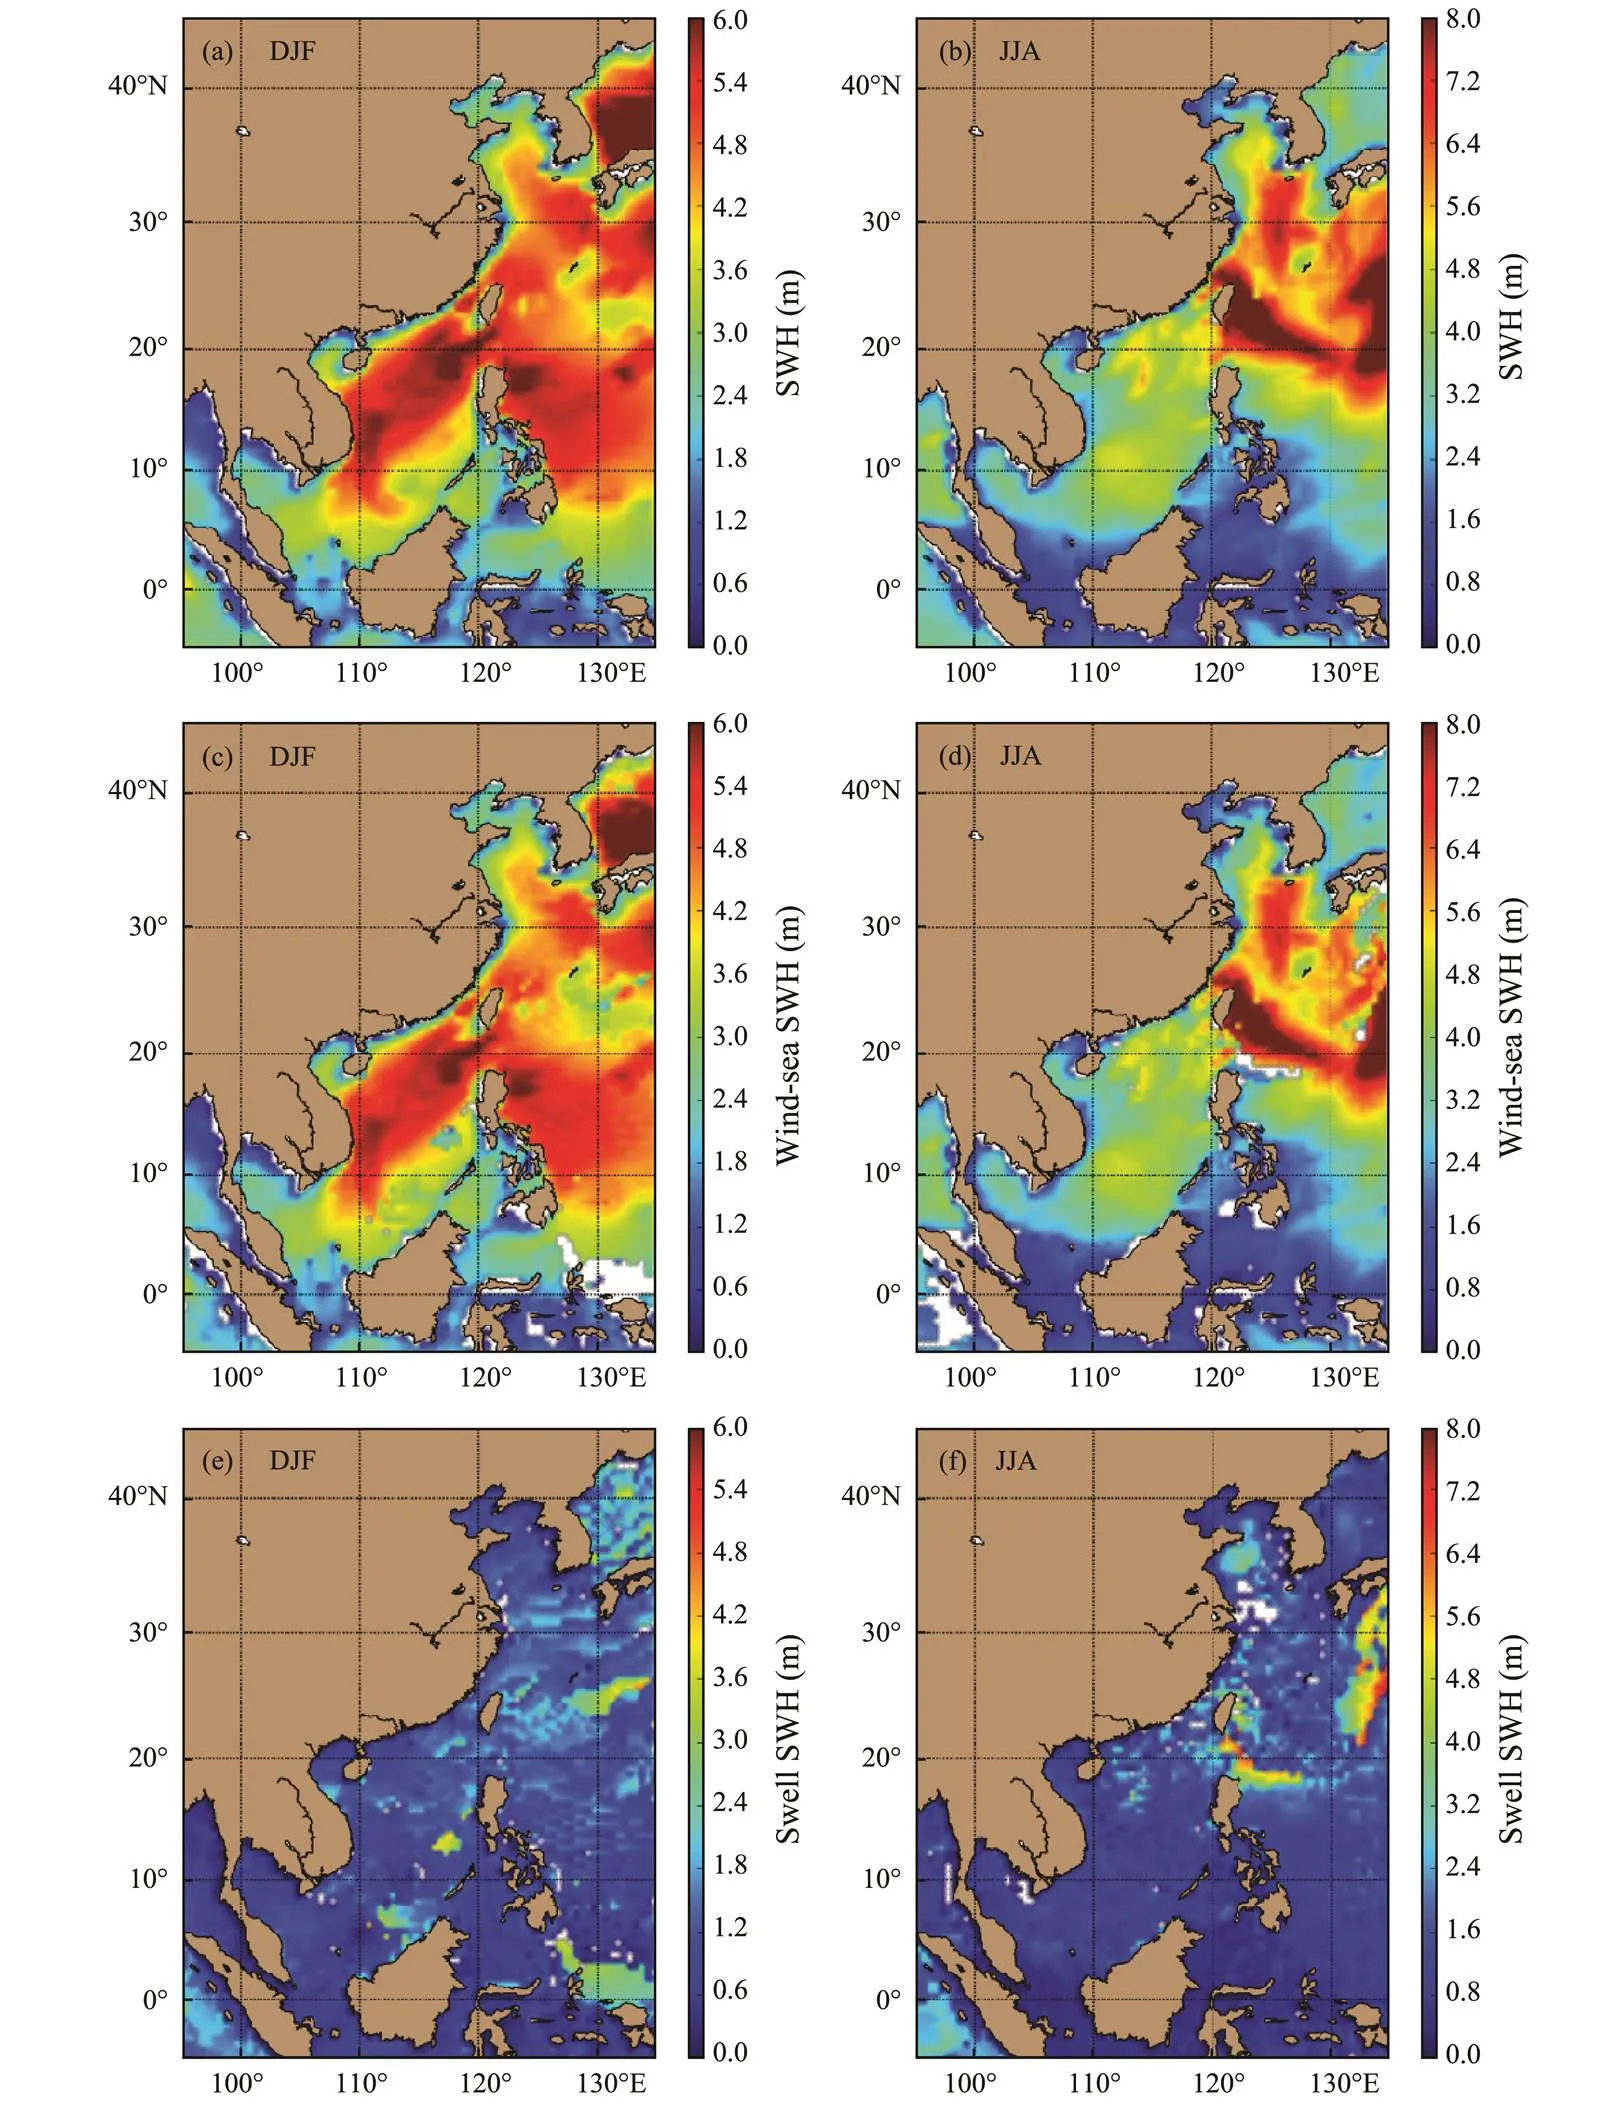
Fig.8 Distributions of maximum SWHs for (a) DJF and (b) JJA and the corresponding wind-sea SWHs ((c) and (d)) and swell SWHs ((e) and (f)) in 2000 in the China Seas.
The results of this study confirmed that the study separating wind-seas and swells can give a much more detailed description of the wave climate. However, based on the spectrum partitioning scheme, it is found that there might be more than two systems of swell climates with dis- tinct wave directions and wave periods at a given location as shown in Fig.6. So only the classification of wind-seas and swells might be still insufficient. The wave rose can reveal the detailed swell climate at a fixed point, but more advanced methods or technologies are still needed to describe the spatial patterns of swell climates especially in the crossing swell conditions. The wave climate is a very important part of the global climate system. The long-term variability of the wave parameters for wind-sea and swells in the China Seas and the relation between the interannual variability of wave climates and the El Niño/ Southern Oscillation are not discussed here as the time series of the dataset used in this study does not reach the minimum length of 30 years recommended by the World Meteorological Organization. Further studies on the long- term and interannual variability of wind-sea and swell climates could be conducted by using wave hindcasts with a longer time span.
Acknowledgements
The altimeter data and the IOWAGA data are both from IFREMER ftp (ftp.ifremer.fr). This work is jointly supported by the National Key R&D Program of China (No. 2017YFC1404700), the National Natural Science Foundation of China (No. 41806010), Laboratory for Regional Oceanography and Numerical Modeling, Qingdao National Laboratory for Marine Science and Technology (No. 2019A03), the Discipline Layout Project for Basic Research of Shenzhen Science and Technology Inno- vation Committee (No. 20170418), and the Guangdong Special Fund Program for Marine Economy Development (No. GDME-2018E001).
Ardhuin, F., Chapron, B., and Collard, F., 2009. Observation of swell dissipation across oceans., 36: L06607, DOI: 10.1029/2008GL037030.
Ardhuin, F., Rogers, E., Babanin, A., Filipot, J., Magne, R., Roland, A., Van der Westhuysen, A., Queffeulou, P., Lefevre, J., Aouf, L., and Collard, F., 2010. Semi-empirical dissipation source functions for ocean wave. Part I: Definition, cali- bration and validation., 40: 1917-1941.
Babanin, A. V., and Jiang, H., 2017. Ocean swell, how much do we know., Trondheim, DOI: 10.1115/ OMAE2017-61692.
Chen, G., Chapron, B., Ezraty, R., and Vandemark, D., 2002. A global view of swell and wind sea climate in the ocean by satellite altimeter and scatterometer., 19: 1849-1859.
Delpey, M. T., Ardhuin, F., Collard, F., and Chapron, B., 2010. Space-time structure of long ocean swell fields., 115: C12037, DOI: 10.1029/2009JC 005885.
Drennan, W. M., Graber, H. C., Hauser, D., and Quentin, C., 2003. On the wave age dependence of wind stress over pure wind seas., 108: 8062, DOI: 10.1029/2000JC000715.
Fan, Y., Lin, S., Griffies, S., and Hemer, M., 2014. Simulated global swell and wind-sea climate and their responses to anth- ropogenic climate change at the end of the twenty-first cen- tury., 27: 3516-3536.
Gulev, S. K., and Grigorieva, V., 2006. Variability of the winter wind waves and swell in the North Atlantic and North Pacific as revealed by the voluntary observing ship data., 19: 5667-5685.
Gulev, S. K., Grigorieva, V., Sterl, A., and Woolf, D., 2003. Assess- ment of the reliability of wave observations from voluntary observing ships: Insights from the validation of a global wind wave climatology based on voluntary observing ship data., 108: 3236-3236.
Hanley, K. E., Belcher, S. E., and Sullivan, P. P., 2010. A global climatology of wind-wave interaction., 40: 1263-1282.
Hanson, J. L., and Phillips, O. M., 2001. Automated analysis of ocean surface directional wave spectra., 18: 277-293.
He, H., and Xu, Y., 2016. Wind-wave hindcast in the Yellow Sea and the Bohai Sea from the year 1988 to 2002., 35: 46-53.
He, H., Song, J., Bai, Y., Xu, Y., Wang, J., and Bi, F., 2018. Climate and extrema of ocean waves in the East China Sea.–, 61 (7): 980-994, DOI: 10.10 07/s11430-017-9156-7.
Huang, Y., Yin, B., William, P., and Hou, Y., 2008. Responses of summertime extreme wave heights to local climate variations in the East China Sea., 113: C09031, DOI: 10.1029/2008JC004732.
Janssen, P. A. E. M., 1989. Wave-induced stress and the drag of air flow over sea waves., 19: 745-754.
Jiang, H., and Chen, G., 2013. A global view on the swell and wind sea climate by Jason-1 mission: A revisit., 30: 1833-1841.
Jiang, H., Mouche, A., Wang, H., Babanin, A. V., Chapron, B., and Chen, G., 2017. Limitation of SAR quasi-linear inversion data on swell climate: An example of global crossing swells., 9 (2): 107, DOI: 10.3390/rs9020107.
Jiang, H., Stopa, J. E., Wang, H., Husson, R., Mouche, A., Cha- pron, B., and Chen, G., 2016. Tracking the attenuation and nonbreaking dissipation of swells using altimeters., 121: 1446-1458, DOI: 10.10 02/2015JC011536.
Kinsman, B., 1965.. Prentice-Hall, New Jersey, 1- 676.
Li, J., Chen, Y., and Pan, S., 2016. Modelling of extreme wave climate in China Seas., 32: 522- 526.
Liang, B., Liu, X., Li, H., Wu, Y., and Lee, D., 2016. Wave climate hindcasts for the Bohai Sea, Yellow Sea, and East China Sea., 32: 172-180.
Pierson, W. J., 1991. Comment on ‘effects of sea maturity on satellite altimeter measurements’ by Roman E. Glazman and Stuart H. Pilorz., 96: 4973- 4977.
Queffeulou, P., Ardhuin, F., and Lefèvre, J. M., 2011. Wave height measurements from altimeters: Validation status and applications.. San Diego, 19-21.
Rascle, N., and Ardhuin, F., 2013. A global wave parameter database for geophysical applications. Part 2: Model valida- tion with improved source term parameterization., 70: 174-188.
Semedo, A., Sušelj, K., Rutgersson, A., and Sterl, A., 2011. A global view on the wind sea and swell climate and variability from ERA-40., 24: 1461-1479.
Semedo, A., Vettor, R., Breivik, Ø., Sterl, A., Reistad, M., and Lima, D., 2015. The wind sea and swell waves climate in the Nordic Seas., 65: 233-240, DOI: 10.1007/ s10236-014-0788-4.
Stopa, J. E., Ardhuin, F., Bababin, A. V., and Zieger, S., 2016a. Comparison and validation of physical wave parameteriza- tions in spectral wave models.,103: 2-17, DOI: 10.1016/j.ocemod.2015.09.003.
Stopa, J. E., Ardhuin, F., Husson, R., Jiang, H., Chapron, B., and Collard, F., 2016b. Swell dissipation from 10 years of Envisat advanced synthetic aperture radar in wave mode., 43 (7): 3423-3430.
Tolman, H. L., and the WAVEWATCH III® Development Group, 2014. User manual and system documentation of WAVE- WATCH III® version 4.18. Technical Note 316. NOAA/NWS/ NCEP/MMAB, U. S. Department of Commerce, National Oce- anic and Atmospheric Administration, College Park, Md, 1- 282.
Uppala, S. M., Kållberg, P. W., Simmons, A. J., Andrae, U., Bech- told, V. D. C., Fiorino, M., Gibson, J. K., Haseler, J., Her- nandez, A., Kelly, G. A., Li, X., Onogi, K., Saarinen, S., Sokka, N., Allan, R. P., Andersson, E., Arpe, K., Balmaseda, M. A., Beljaars, A. C. M., Van De Berg, L., Bidlot, J., Bormann, N., Caires, S., Chevallier, F., Dethof, A., Dragosavac, M., Fisher, M., Fuentes, M., Hagemann, S., Hólm, E., Hoskins, B. J., Isa- ksen, L., Janssen, P. A. E. M., Jenne, R., McNally, A. P., Mahfouf, J. F., Morcrette, J. J., Rayner, N. A., Saunders, R. W., Simon, P., Sterl, A., Trenberth, K. E., Untch, A., Vasiljevic,D., Viterbo, P., and Woollen, J., 2005. The ERA-40 re-analysis., 131: 2961-3012.
Wan, Y., Zhang, J., Meng, J., and Wang, J., 2015. A wave energy resource assessment in the China’s seas based on multi- satellite merged radar altimeter data.,34: 115-124.
Young, I. R., Babanin, A. V., and Zieger, S., 2013. The decay rate of ocean swell observed by altimeter., 43: 2322-2333.
Young, I. R., Sanina, E., and Babanin, A. V., 2017. Calibration and cross validation of a global wind and wave database of altimeter, radiometer, and scatterometer measurements., 34 (6): 1285-1306, DOI: 10.1175/JTECH-D-16-0145.1.
Zheng, C., Pan, J., and Li, J., 2013. Assessing the China Sea wind energy and wave energy resources from 1988 to 2009., 65: 39-48.
Zheng, C., Zhuang, H., Li, X., and Li, X., 2012. Wind energy and wave energy resources assessment in the East China Sea and South China Sea.–, 55: 163-173.
Zieger, S., Vinoth, J., and Young, I. R., 2009. Joint calibration of multiplatform altimeter measurements of wind speed and wave height over the past 20 Years., 26: 2549-2564.
May 18, 2018;
July 4, 2018;
October11, 2018
© Ocean University of China, Science Press and Springer-Verlag GmbH Germany 2019
. E-mail: haoyujiang@cug.edu.cn
(Edited by Chen Wenwen)
杂志排行

Journal of Ocean University of China的其它文章
- Circulation and Heat Flux along the Western Boundary of the North Pacific
- System Reliability Analysis of an Offshore Jacket Platform
- The Mineral Composition and Sources of the Fine-Grained Sediments from the 49.6˚E Hydrothermal Field at the SWIR
- Research Progress of Seafloor Pockmarks in Spatio-Temporal Distribution and Classification
- Application of the Static Headland-Bay Beach Concept to a Sandy Beach: A New Elliptical Model
- Dynamical Control of Asymmetrically Oblique Tidal Currents to the Sedimentary Characteristics and Development of Linear Sand Ridges in the Liaodong Shoal, East Bohai Sea