Resistance welding of glass fiber reinforced thermoplastic composite: Experimental investigation and process parameter optimization
2020-02-24BingDULimingCHENHouchangLIUQinghaoHEWeimingQINWeiguoLI
Bing DU, Liming CHEN, Houchang LIU, Qinghao HE,Weiming QIN, Weiguo LI
a College of Aerospace Engineering, Chongqing University, Chongqing 400030, China
b Chongqing Key Laboratory of Heterogeneous Material Mechanics, Chongqing University, Chongqing 400030, China
c Chongqing Key Laboratory of Nano-Micro Composite Materials and Devices, School of Metallurgy and Materials Engineering, Chongqing University of Science and Technology, Chongqing 401331, China
d Centre for Advanced Materials Technology, School of Aerospace, Mechanical and Mechatronic Engineering, The University of Sydney, NSW 2006, Australia
KEYWORDS Mechanical property;Processing parameters;Resistance welding;Response Surface Method;Thermoplastic
Abstract The utilization of fiber reinforced thermoplastics(FRTP)is expected to fulfill lightweight demand in mass-produced aerospace products. Facing the unavoidable assembly of FRTP parts,fusion bonding methods such as resistance welding are promising compared with mechanical joint and adhesive bonding.In this paper,a procedure has been brought out to understand the relationship between processing conditions and performance of the FRTP welding joints. The adherends were continuous glass fiber reinforced polypropylene (GF/PP) laminates fabricated by hotpressing method. The influences of time, current and pressure on the bending strength of the resistance welding joints were investigated.A processing window was drawn based on the optical observation of welded surfaces. The quantitative relationship between process parameters and mechanical property of GF/PP welding joint was established by Response Surface Method(RSM) with high accuracy. It was found that bending strength of GF/PP welding joint was improved by 31% compared with hot-pressing benchmark.
1. Introduction
Continuous fiber reinforced thermoplastic composites(CFRTCs) are finding their wide industrial applications for higher impact resistance,recyclability and reformability.1Generally speaking, higher temperature and higher forming pressure are required for thermoplastic composites (TPCs)compared with thermosetting composites (TSCs). This intrinsic characteristic limits the complexity of TPC components and increases the manufacturing costs.2,3
Similar to metals and TSCs, traditional joining methods including mechanical fastening and adhesive bonding are feasible but not ideal to join TPCs.Mechanical fastening is insensitive to surface preparation and environmental factors but it introduces stress concentration and increases overall weight.4,5Adhesive bonding overcomes these shortcomings to some extent but it requires special surface treatments which are difficult to be achieved in industrial environment for TPCs.6-8
Due to the possibility of reformability achieved by heating,fusion bonding methods introducing heat into the contact area by conduction, convection and/or radiation are promising to join TPCs with high efficiency.2,3,6,9-16Resistance welding is one of the most encouraging techniques for integrating TPCs.However,the quality of resistance welding is highly sensitive to process parameters such as pressure, time and current.2,3,6Usually, researchers need to do plenty of experimental work and draw the process window to identify the optimized welding parameters to achieve desired welding quality before massive application.2,17,18Hou et al.19presented the optimum process window for resistance welding of CF fabric/PEI composite based on a critical level of lap shear strength. Ageorges et al.17experimentally and numerically investigated the resistance welding of carbon-fibre and glass-fibre reinforced polyetherimide laminates. Process window was conducted to indicate the power level and welding time under the fixed welding pressure. In general, every data point in process window presented above referred to a group of experiments based on the criterion of reaching certain mechanical strength. Since it can be regarded a point-by-point search,much time and labor work will be spent and the research period will be prolonged to some extent.
In this paper, a procedure for optimizing the resistance welding process has been brought out to understand the relationship between processing conditions and performance of the FRTP welding joints. Firstly, a heating element consisting of GF/PP prepreg-metal mesh-GF/PP prepreg was proposed and its electrical and thermal properties were investigated.Secondly,the resistance welding process window was drawn based on the shape of the lap joint area to determine the optimization interval of process parameters. The orthogonal test method was used to find the contribution of these process parameters.Thirdly, the quantitative relationship between bending strength and process parameters was established by RSM and the theoretical prediction values were compared with experimental ones.Finally,the optimal resistance welding process parameters were validated by comparing with hot-pressing benchmark in terms of mechanical property and microscope morphology.
2. Fabrication and characterization methods
Differential Scanning Calorimeter(DSC)was used to measure of the melting point of polypropylene and the result was 164.2°C (Fig. 1(a)). As shown in Fig. 1(b), the polypropylene resin started to decomposed at about 424.3°C and decomposes at about 469°C by Thermogravimetric Analysis (TGA). The glass fiber mass content of prepreg was about 58.5%. The microscope of prepreg was shown in Fig. 2.

Fig. 2 Micrographs of prepreg.

Fig. 1 Thermal analysis of GF/PP prepreg.
The adherends were GF/PP laminates with the layup [0°]6.Firstly,the prepreg was cut into the desired size,wiped with NMethylformamide and placed within the molds. The temperature was raised to 200°C with the speed of 5°C/min under the pressure of 0.8 MPa, then kept at 1.6 MPa for 10 min and finally cooled down to room temperature by water. After taking out from molds,laminates were cut into 100 mm×25 mm long strips. The heating element sandwiched with two GF/PP prepregs and a metal mesh (Fig. 3) was hot-pressed and then cut into 12.5 mm×90 mm strips. The extra area in the ends of the heating element was burnt to increase the contact between the metal mesh and the electrode.
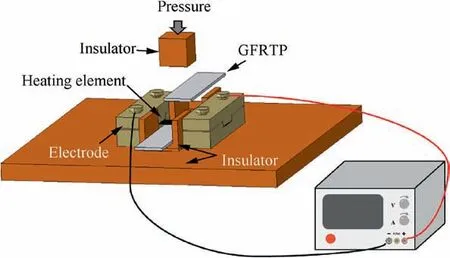
The resistance welding set-up platform was shown in Fig.4 which consisted of DC power supply, electrode, heating element, adherend, bakelite board and pressure control unit.The current was supplied by the DC power supply with a maximum voltage of 60 V and a maximum current of 20 A. The current was transmitted to the heating element through the brass electrode whose size was 100 mm×25 mm×20 mm.Under the applied current and pressure, the polymer in both heating element and adherend was melt and flowed to bring the welding surfaces into intimate contact.After stopping current, the mixed polymer was consolidated and the strength of the joint was formed. The K-type thermocouple with a diameter 0.254 mm was used to monitor the temperature history during resistance welding process.
As shown in Fig.5,benchmark specimens having a layup of[0°]12were also prepared by hot pressing where a polyimide(PI) film (thickness 0.015 mm) was placed between the sixth layer and the seventh layer. After hot pressing, the additional portion was carefully removed by the CNC cutter. The edges of the test specimen were polished with fine sandpaper to remove burrs.

Fig. 3 SEM image of metal mesh.

Fig. 4 Resistance welding of single lap specimen.

Fig. 5 Fabrication of single lap benchmark specimen.

Fig. 6 Three-point-bending of single lap specimen.
Since bending is one of the critical load case for joining,the resistance welding single-lap specimen was evaluated by threepoint bending test with the loading speed of 1 mm/min (refer to JIS K6856-1994) as shown in Fig. 6. During the threepoint bending test, the load P and displacement x were recorded. Specimen geometry were width W=25 mm, span l0=38 mm,lap joint length L0=12.5 mm.Radius of support in three-point bending test R is 7.5 mm. The bending strength σbof the single lap test specimen was calculated by Eq. (1)

where Pmaxis the maximum load.
Normalized displacement was expressed by Eq. (2)


Fig. 7 Microscopic observation directions of resistance welding specimen.

Fig. 8 Distribution of electrical resistance of heating element.

Fig. 9 Electrical resistance versus temperature of heating element.
For resistance welded specimen, the cross sections of the overlapping region in two typical directions named the length(x-direction) and the width (y-direction) were selected as the microscopic topography observation region as shown in Fig.7.A-A represents the x-direction which is along with fiber direction and B-B represents for y-direction which is vertical to fiber direction.
3. Optimization method
Design of Experiment (DOE) is a mathematical statistical method for arranging experimental and analytical data. It yields scientific and reliable conclusions with fewer trials,lower trial costs and shorter test cycles.
The orthogonal test method is used to study the multifactor test with multiple levels. According to the orthogonal table, select representative data points from the whole factor test are selected to carry out the test. The orthogonal table is denoted as Ln(ji)where n,i and j represent the number of trials,the number of factors,and the number of factor levels,respectively. The influence of each factor on the response value can be calculated by the orthogonal test and then to select the key influence factors.
RSM is a kind of optimization method that uses a multivariate quadratic regression equation to fit the relationship between various factors and response values such as on defined in Eq. (3)20

In Eq. (3), y represents the response, xirepresents the individual variable, βiand βiirepresent the regression coefficients and ε is the error. By analyzing the regression equation, the best combination of factors can be found. The two most common methods of RSM are Central Composite Design (CCD)and Box-Behnken Design (BBD). Before using the RSM, factors and levels need to be determined properly to get the desired optimal results.
In this paper,the orthogonal test method was used to filter the key influencing factors and determine the reasonable level of the factors. Then the CCD of RSM was used to find the optimal level of key factors.
4. Results and discussions
4.1. Heating element
The resistance of the heating element directly affects the performance of the resistance welding technique.Firstly,the electric resistance values of 50 heating elements were measured and the statistical results after fitting with the normal distribution curve are shown in Fig.8.The resistance values of the heating elements selected in the following research were between 0.19-0.23 Ω.K-type thermocouples were placed in the middle of the heating element, 1/4 left and 1/4 right to measure the surface temperature of the heating element during the resistance welding process.The average of the three thermocouples was taken as the heating element temperature value, and the heating element resistance value was directly obtained from the power source. As shown in Fig. 9, the resistance value of the heating element was linearly related to the temperature,and the linear correlation coefficient was +0.0254/°C and the COD (Coefficient of Determination)of linear fit was 0.9596.In the temperature range studied in this paper, the resistance value of the heating element did not increase by more than 5%. Ageorges and Ye21points out that the variation of the resistance value within 10% is technically acceptable.
4.2. Process window
In order to investigate and optimize the resistance welding process,it is necessary to study the influence of process parameters on the resistance welding performance. As a commonly-used tool in manufacturing, process window is constructed based on the values of process parameters and it can provide useful instruction for selecting suitable process parameters.Generally speaking,there are two main ways to plot the process window:one is to perform series of experiments changing values of the process parameter and another is to simulate the process by developing a model. Considering that experimental way is the essential foundation for simulation way, experimental method is chosen to construct process window in this paper.
After preliminary exploration, the welding pressure was determined to be 0.05 MPa,the input current range was determined to be 8-13 A, and the welding time was determined to be 0.25-2 min. The process window in terms of time and current was drawn as shown in Fig. 10(a). Generally speaking,the proposed process window can be divided into three typical regions corresponded to the specimens under the following process conditions of (a) under-processed, (b) acceptable and(c) over-processed respectively.
Under-processed specimens resulted from too short a process time and/or too low a current level, and the contact surface were not fully melted. On the contrary, the resin in over-processed specimens have melted so excessively that squeezed out.Both under-processed and over-processed specimens are not expected since the mechanical property of lap joint will be reduced. Correspondently, the surface morphology of the lap area under the above process conditions were shown in Fig. 10(b). Although this process window is only valid for the currently-used welding pressure 0.05 MPa,similar process windows can be constructed for other welding pressure. The process window diagram can provide guidance for determining the optimal combination of process parameter under other value of pressure or other desired process factor.
4.3. Process parameter optimization
4.3.1. Selecting key process parameters
Three process factor levels in orthogonal test method were selected as shown in Table 1, and the orthogonal table L4(23)was designed as shown in Table 2 where X/Y/Z represented the time, current and pressure, respectively, and y represents the bending strength of resistance welding specimen (unit:MPa).It was shown that the contribution rates of three factors X/Y/Z to bending strength were 76.2%, 23.8% and 0.0088%,respectively. The welding time (X) and input current (Y) were the main factors affecting the bending strength of the single lap joint.
4.3.2. Determining optimal process parameter
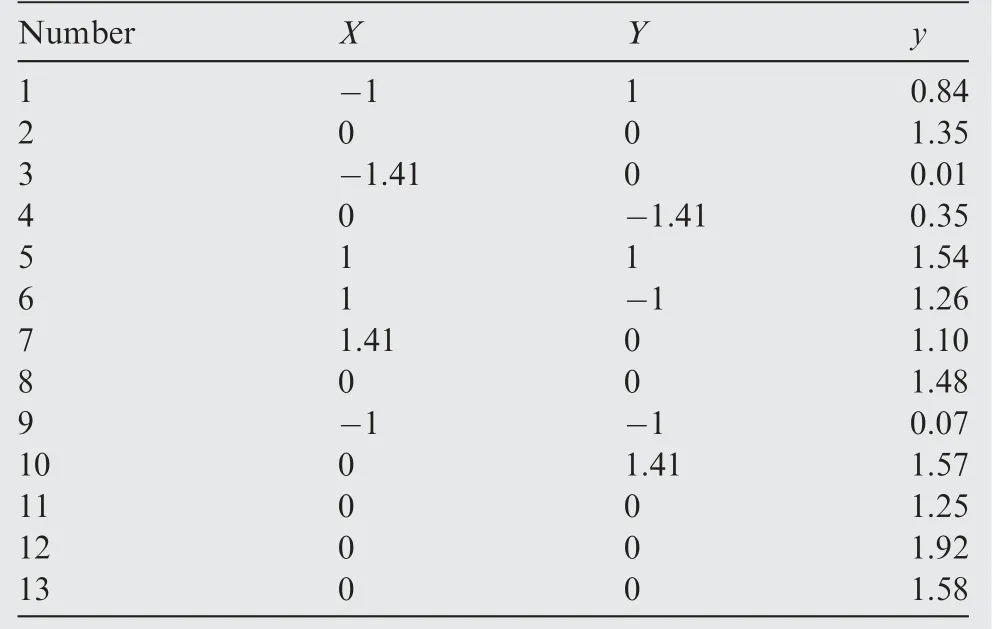
Based on the orthogonal test, three levels of welding time (X)and input current (Y) were further refined into three typical levels as shown in Table 3 with a consistent pressure of 0.05 MPa.The design and test results of the RSM were shown in Table 4.
Taking the bending strength as the dependent variable and the specific level of each factor as the independent variable,the quadratic regression equation Eq.(4)was established to obtain the following results:
Cinderella brought the trap to her, and in it there were three huge rats. The fairy made choice of one of the three which had the largest beard, and, having touched him with her wand, he was turned into a fat, jolly coachman, who had the smartest whiskers eyes ever beheld26. After that, she said to Cinderella:

X, Y, X2and Y2in the model were significant influence items. The model variance R2=0.9110, indicating that 91%of the test data can be interpreted by this model. Adj R2and Pred R2had higher values and the difference was within 0.2,indicating that the regression model can fully fit the test results. The comparison between the experimental values and the response surface prediction results was shown in Fig. 11.
4.3.3. Validation of optimization result
As shown in Table 4,when the welding time was 1 min and the input current was 10 A, the bending strength of the single lap joint reached a maximum value of 1.46±0.36 MPa. According to Eq.(4), when the welding time is 1.2 min and the input current is 10.63 A,the bending strength of the joint is supposed to have a theoretical maximum value of 1.71 MPa. Under these predicted optimal process parameters,five lap joints were prepared for bending test to verify the theoretical prediction.The bending strength versus normalized displacement curves were shown in Fig. 12. The bending strength test result was 1.60±0.12 MPa, and the error from the theoretical valuewas 6.4%which showed that it was feasible to use the RSM to optimize the resistance welding process parameters.

Table 1 Factor level design table of orthogonal test.

Fig. 10 Influence of process parameters on resistance welding specimen.

Table 2 Design and test results of orthogonal table L4(23).

Table 3 Factor level design table of Response Surface Method.

Table 4 Design and test results of Response Surface Method.

Fig. 11 Comparison of predicted values of regression equation with experimental results.
The temperature rise characteristic during resistance welding under optimization parameters was also investigated.Thermocouples T1/T2/T3were placed between the heating element and adherend.T1was placed in the center,T2was placed in the length direction 1/4 and T3was placed in the width direction 1/4 as shown in Fig.13.It was found that the temperature gradient in the longitudinal direction and the width direction of the resistance welding process were14 °C and 37°C, respectively.This edge effect was due to the poor heat transfer capability between the heating element and the air near the edge,which made the faster internal heating of the heating element.Therefore,the resin at the edge melted first and then spread to the middle part, and finally resin in the side began to melt.
According to the DSC and TGA analysis of GF/PP prepreg, the PP resin used in this paper has a melting point of 164°C and a decomposition temperature of 424°C. The resin mass fraction remains unchanged below 220°C. Therefore,under the optimal process parameters,both the resin was fully melted and not yet pyrolyzed.
4.4. Process evaluation
In this section,hot-pressed lap joints were used as benchmarks to evaluate the resistance welding process of single lap test specimens under the optimal process parameters in terms of surface integrity, microstructure, joint interface and mechanical properties.
4.4.1. Surface integrity and microstructure
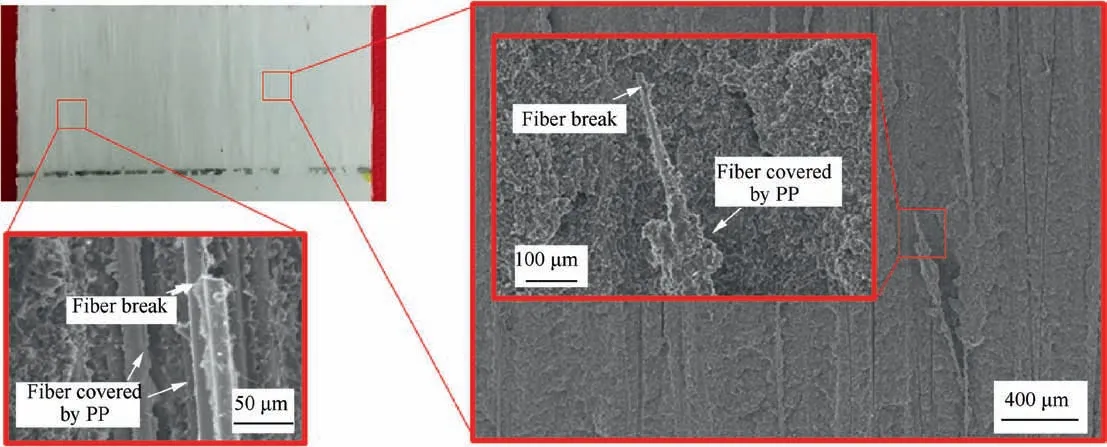
Investigation of the surface integrity and microstructure can help reveal the failure mechanisms involved in the fracture process.22According to the experimental results, there were three main failure modes after the three-point bending of the lap joint specimens named cohesive failure, interlayer failure of the heating element and mixture failure as shown in Fig. 14.Cohesive failure occurred between the heating element and the adherend surface which was a failure between the GF/PP prepreg layers. Note that the direction of the GF/PP prepreg in heating element is vertical to that of the adherend surface.Part of the fibers were found pulled out and broken due to the interaction of the orthogonal GF/PP prepreg layers, and this is different from the hot-pressing benchmark specimens as shown in Fig. 15. Interlayer failure of the heating element corresponded to the failure between metal mesh and GF/PP prepreg of the heating element. As previously seen in Fig. 3,the metal mesh had a rough surface which facilitated bond with the polymer which contributed to enhance interface strength compared with the hot-pressing benchmark specimens. On the contrary, cohesive failure was the only failure mode for hot-pressing benchmark specimen as shown in Fig.15.There existed relatively less pulled-out fibers compared with in resistance welding specimens.

Fig. 12 Experimental results of single lap specimen with optimization parameters in resistance welding.

Fig. 13 Temperature history of lap area on resistance welding specimen.
4.4.2. Joint interface
The interfaces of two joint namely resistance welding specimens and hot-pressing benchmark specimens were observed by optical microscope. Note that A-A was along the fiber direction and B-B was vertical to fiber direction. For hotpressing benchmark, each layer of prepreg was continuous and there was no artificially-introduced interface (Fig. 16).For the resistance welding specimen, the interface between the heating element and the adherend was also continuous(Fig.17).Moreover,the thickness of each prepreg was uniform which validated that the chosen pressure was suitable without squeezing resin in the bond aera.
4.4.3. Mechanical property
As shown in Fig.18,the average bending strength of the optimal resistance welding specimen can reach 1.60 MPa, which was 31% higher than that of the hot-pressing benchmark. As mentioned ahead, the morphology of fracture surface was observed by a scanning electron microscope and compared in Figs. 14 and 15. For the optimal resistance welding specimen,the metal mesh had a rough surface and the contact area between the PP resin and the mesh was relatively large which contributed to enhance interface strength compared with the hot-pressing benchmark specimens. As for failure mode, the PP/metal mesh interface was dominant for optimal resistance welding specimen while only the PP/glass interface was dominant for hot-pressing benchmark.
5. Conclusions
In this paper,a procedure for investigating the resistance welding process has been brought out to in-depth understand the relationship between processing conditions and performance of the FRTP welding joints. Compared with traditional laborious experimental work, a relatively fast method was presented to determine the optimal process parameter. Firstly,the initial resistance welding process window was drawn which gave a preliminary selection guidance for the following process parameter optimization. Secondly, within the optimization range, the orthogonal method and response surface method were utilized to establish quantitative relationship between bending strength and process parameters.In fact,the proposed approach is a target point search within optimization domain and reliable conclusions with fewer experiments, lower costs and shorter test cycles can be yielded. Main conclusions were drawn as followed:

Fig. 14 Surface integrity and microstructure of typical failure modes.

Fig. 15 Surface integrity and microstructure of hot-pressing benchmark specimens.

Fig. 16 Microscope morphology of hot-pressing benchmark specimens.

Fig. 17 Microscope morphology of resistance welding specimen.

Fig. 18 Comparison on three-point-bending property between resistance welding specimen with optimal parameters and benchmark.
(1) A heating element consisting of GF/PP prepreg-metal mesh-GF/PP prepreg was proposed. The resistance value of the heating element conformed to the normal distribution, and the increased range did not exceed 5% within the target temperature range. A resistance welding platform containing DC power supply, electrode, heating element, adherend, bakelite board and pressure control unit was set up.
(2) The resistance welding process window was drawn based on the shape of the lap joint area, and the optimization interval of process parameters was determined. The orthogonal test method was used to find the contribution of process parameters: current possess highest contribution of 76.2%, followed by time had (23.8%) and pressure had (0.0088%).
(3) Taking the three-point bending strength of single-lap specimen as the optimization index, the quantitative relationship between bending strength and process parameters was established by RSM.The error between theoretical prediction value and experimental value was 6.4%.
(4) Under the optimal resistance welding process parameters the bending strength was increased by 31% compared with hot-pressing benchmark. The main reason was that the contact area between the metal mesh and the resin was increased after introducing metal mesh which improved the interface strength.
Acknowledgements
Supports from the National Natural Science Foundation of China(Nos.11972096 and 11572059),CAST Young Elite Scientists Sponsorship Program (2017QNRC001) and Chinese-Foreign Excellent Youth Exchange Program(2017CASTQNJL042), Fundamental Research Funds for the Central Universities (2018CDQYHK0029), Chongqing Key R&D Program (cstc2017zdcy-zdyfX0005) and Chongqing Natural Science Foundation (cstc2018jcyjAX0089) are gratefully acknowledged.
杂志排行
CHINESE JOURNAL OF AERONAUTICS的其它文章
- Design and experimental study of a new flapping wing rotor micro aerial vehicle
- CFD/CSD-based flutter prediction method for experimental models in a transonic wind tunnel with porous wall
- Prediction of pilot workload in helicopter landing after one engine failure
- Study of riblet drag reduction for an infinite span wing with different sweep angles
- Modulation of driving signals in flow control over an airfoil with synthetic jet
- Strong interactions of incident shock wave with boundary layer along compression corner
