Semi-analytical model for flat indentation of metal materials and its applications
2020-02-24XiokunLIULixunCAIHuiCHENShuqinSI
Xiokun LIU, Lixun CAI,*, Hui CHEN, Shuqin SI
a Applied Mechanics and Structure Safety Key Laboratory of Sichuan Province, School of Mechanics and Engineering,Southwest Jiaotong University, Chengdu 610031, China
b School of Civil Engineering, Changsha University of Science & Technology, Changsha 410114, China
KEYWORDS Energy-density-equivalence;Flat indentation;Power-law material;Semi-analytical model;Stress-strain relationship
Abstract The increasing use of small material components in a wide range of industrial fields necessitates the development of an accurate and robust indentation testing method.To this end,this paper proposes an Energy-density-equivalence for a Flat Indentation (E-FI) model based on the energy density equivalent principle. The proposed model describes the relationships among the material parameters of Hollomon’s power law (H-law), flat indenter diameter, energy, and indentation displacement. An E-FI Method (E-FIM) that determines the H-law parameters of materials through the indentation test is also developed. The energy-displacement curves forward-predicted by the E-FI model (based on known H-law parameters of materials) and the H-law parameters of materials given by the E-FIM (based on known energy-displacement curves)are consistent with the results of Finite Element Analysis (FEA) and the H-law parameters of materials used as the input for FEA, respectively. Using E-FIM, the goodness of fit for both stress-strain curves with H-law, predicted based on the displacement with 2% signal interference, and that for stress-strain curves without interference is more than 0.98.The stress-strain relations predicted by E-FIM were consistent with the results obtained via uniaxial tensile tests of ten ductile materials.
1. Introduction
Conventional uniaxial tensile tests can be used to determine the stress-strain relationships and mechanical properties of materials such as elastic modulus, yield strength, and tensile strength. In the past 30 years, the demand for mechanical property testing for small-scale materials and components,and service components in nuclear power and aeronautical engineering has gradually increased. Consequentially, testing methods of small samples, especially involving the local indentation methods of materials or service components, have received increased attention.
In 1992, Oliver and Pharr1proposed an advanced indentation test method for solving the elastic modulus using the unloading stiffness of the spherical indentation.They promoted the development of test methodologies using elastic indentation instrumentation.This approach has been widely used in experimental studies of the elastic modulus of nanoindentation. In 1993,Haggag2used the representative strain εrand representative stress σrproposed by Tabor3to complete spherical indentation stress-strain relationship experiments through multilevel automatic loading and unloading.The representative stress σrand representative strain εrare shown in Eq. (1):

where P is the load of spherical indentation and D is the diameter of the indenter.The segmentation correction parameter ω,which includes the empirical values τ, α, and φ in Eq. (1), can either be determined empirically or through tensile tests on known material.In fact,σrand εrare corrections for the average stress and strain, respectively, and not the true equivalent stress and strain; the plastic indentation diameter dp, which is approximated as the Hertz elastic solution, and the segmentation correction parameter ω,do not possess theoretical universality. In 1995, Biwa and Stora°kers4studied the spherical indentation of rigid-plastic materials theoretically and numerically based on classical plastic flow theory. The Haggag method and Kwon5,6method developed on the basis of the Haggag method were applied to aircraft components, reactor pressure vessels, in-service bridges, and natural gas pipelines.However, these methods are characterized by certain limitations such as pile-up,inconvenience,lack of universality, poor precision,and a scale effect due to their inherent empirical features and multi-level loading and unloading.In 2004,based on dimensional analysis by Cheng Y and Cheng C7and representative stress proposed by Dao et al.,8Cao and Lu9achieved the separation of yield stress and hardening index and proposed a solution process for determining the mechanical properties of materials.The determination of representative stress using this method requires a number of calculations, and the equation obtained contains over 40 fitting parameters.
In 2019, Chen et al.10proposed a semi-analytical spherical indentation model based on the energy density equivalent principle; it contained only seven parameters, and Hollomon’s power law(H-law)could be obtained for light alloys by spherical indentation and simple model iterations, as shown in Eq.(2):

where E is the elastic modulus, K is the strain hardening coefficient,σeqis the equivalent stress,εe-eqis the equivalent elastic strain, εep-eqis the equivalent elastoplastic strain, σyis the initial yield stress, and n is the strain hardening index.
Using the theory of conical indentation, in 2008 and 2009,Le11,12obtained the regression equation for the characteristic parameter of the load-displacement curve versus the parameters of stress-strain relationships using Finite Element Analysis (FEA), completing the inversion analysis of the stressstrain relationship of materials using this equation. For materials with a yield platform,Pham et al.13obtained a large number of FEA calculations for conical indentation at a half-apex angle of 70.3°. A complex equation with approximately 100 regression parameters describing the relationship among the indentation loading curvature, unloading stiffness, and Hlaw parameters of materials was established. However, the application is limited because of the complexity of the equation and the requirement of two different cone angles to complete the indentation test due to the self-similarity of single-cone indentation.
Since 2016, Chen et al.,10Chen and Cai,14-16and Peng et al.17,18have proposed semi-analytical equations for spherical indentation and the conversion among Brinell, Rockwell,and Vickers hardness for uniform, isotropic, and H-law materials based on the energy density equivalent principle.The Chinese national standard GB/T 37782-2019 was subsequently established. The spherical indentation test standard has high requirements in terms of measurement accuracy of the instruments employed and sample processing accuracy.
Compared with other shaped indenters, the advantages of the flat indenter are that the material under a flat indenter can quickly reach a fully plastic state and the size of the plastic zone remains constant during further indentation.19Lu and Shinozaki20found that the flat indenter requires the least indentation depth to probe the plastic properties of a material.In 2011, Boschetto et al.21performed a simple empirical calibration of specific materials and obtained the yield strength from the maximum linear load for cylindrical flat indentation.In 2017,Midawi et al.22estimated the stress-strain relationship of metal materials by adjusting H-law parameters to optimize the matching of the flat indentation load-displacement curve obtained using FEA with the experimental curve. The flat indentation method is the most commonly used method for testing the mechanical properties of a variety ofhyperelastic,23-25ductile22,26,27, and surface-coating materials.28,29Among these,experiments pertaining to the most ductile material rely on optimization algorithms or empirical formulas and lack theoretical universality.
Numerous studies have previously been conducted on test methods for sphere, cone, and flat indentations. Test methods based on experience and numerical analysis have different degrees of adaptability limitations in terms of test convenience,accuracy, universality, and test equipment accuracy.
Based on the energy density equivalent principle, a semianalytical model describing the relationship among the Hlaw parameters of the material,flat indenter diameter,indentation work, and displacement is proposed for cylindrical flat indentation in this paper. A flat indentation test method for obtaining stress-strain relationships is also proposed for ductile metal materials.
2. Research conditions
2.1. Finite element analysis

Fig. 1 FEA model for flat indentation.

Fig. 2 Influence of r on load-displacement curves.

Fig. 3 Influence of grid size on load-displacement curves.
FEA was conducted on flat indentation using ANSYS v14.5.According to the geometric characteristics of the flat indentation, the two-dimensional axisymmetric FEA grid model as shown in Fig.1 was established.The PLANE182 planar unit was selected as the grid unit for a total of 17825 units.The diameter D of the cylindrical flat indenter was 0.5 mm,and the elastic modulus E of the indenter material (tungsten carbide) was set to 600 GPa. The H-law parameters of the specimen material were set in the conventional range.The planar target element TARGE169 and the planar 3-node surface contact element CONTA172 were adopted for the grid unit of the contact area. The mesh of the contact surface was refined to 1.74 μm. When the finite element grid model was established,it included a fillet radius of 40 μm to facilitate FEA convergence, due to the sharpness of the end edge of the flat indenter.
The H-law parameters of the materials, E, σy, and n, were set to 70 GPa,500 MPa,and 0.1,respectively.For FEA at different fillet radii r, the difference between the flat indentation load-displacement curves was negligible when the fillet radius was r±2 μm (Fig. 2).
To investigate the effect of grid density on the calculation results, the diameter D of the flat indenter was set to 0.5 mm and the grid size of the core area of the flat indentation was set to 0.93 μm, 1.74 μm, and 3.48 μm. Fig. 3 shows the FEA load-displacement curves for the three grid sizes, indicating that grid density had little effect on the analysis results. Considering the calculation efficiency, a grid size of 1.74 μm was selected for the core area of flat indentation.
Fig.4 shows a typical FEA plastic strain nephogram.When a flat indenter with a diameter of 0.5 mm was indented into the material to a depth of 100 μm,the plastic strain of the indented material was mainly distributed near the indenter and the area close to the diameter of the cylindrical indenter.
2.2. Experimental conditions
2.2.1. Materials and specimens
Flat indentation experiments were conducted using ten types of ductile metal. The H-law parameters of materials obtained by uniaxial tensile tests are shown in Table 1. The specimens for flat indentation were cylinders with a cross-sectional diameter of 25.4 mm and a height of 10 mm. The roughness of the indented surface of the specimens was Ra<0.8 μm.

Fig. 4 Plastic strain nephogram for flat indentation.

Table 1 Mechanical properties of test materials.
2.2.2. Equipment and experiments
Fig. 5 shows the multi-functional high-precision MMTI type indentation instrument (Chengdu Miniature Mechanical Testing Science & Technology Co. ltd.). The instrument has a plate-ring type load cell with a measurement range of 1000 N. A differential displacement sensor with a measurement range of 2 mm was employed for measuring displacement. The accuracy of the load cell and the displacement sensor was 0.5%.
The flat indenter had a 0.5 mm diameter tungsten carbide indenter head, and the end edge was machined with 0.04 mm fillets. The distance between adjacent indentation points was no less than 1.5 mm, the test loading rate was 3 μm/s, and the indentation displacement h was 0.11 mm. Each material sample was subjected to three indentation tests.
2.3. Elastic modulus test method
The typical load-displacement curve for flat indentation is shown in Fig. 6, where Pmaxis the maximum load of the flat indentation test, hmaxis the maximum displacement corresponding to Pmax, hfis the displacement corresponding to unloading of zero loads,and S is the initial unloading stiffness of the unloading section of the load-displacement curve.
When loading reaches the maximum load Pmaxof the flat indentation test,it is assumed that the initial unloading section of the load-displacement curve conforms to the functional relationship shown in Eq. (3):

Fig. 6 Schematic diagram of load-displacement curves for flat indentation.

where a and b are the parameters of the least-squares fitting.
The unloading stiffness is the slope of the P-h function provided in Eq.(3),and the initial unloading stiffness S is defined as

The Hertz contact theory can be used to obtain the equivalent elastic modulus Er1

where the indenter coefficient β is a parameter related to damage, and A=πD2/4 is the elastic contact area. Then,

where ν is Poisson’s ratio for the material and νiand Eiare the Poisson’s ratio and elastic modulus of the indenter material,respectively.

Fig. 5 MMTI test instrument and system control software user interface.
In 2018, Zhang et al.30presented the relationship between the elastic modulus solved by the unloading section of the load-displacement curve and the unloading position for spherical indentation.To determine the value of parameter β for flat indentation in Eq. (5), multi-level unloading tests were performed,where each unloading test was conducted in 11 stages using equal displacement increments. They were performed using three kinds of light alloy (5052-H112, 6061-T6511, and 7075-T6511) and three kinds of steel (16Mn, P92, and Cr12Mov).Two flat indentation tests were performed for each material,the results of which are shown in Fig.7(a)and Fig.8(a). Fig. 7(b) and Fig. 8(b) show that from the multi-level unloading load-displacement curve, the β values corresponding to the different dimensionless indentation displacements were obtained using Eqs. (4) to (6). When dimensionless displacement reached 0.1,the β value tended to be stable.During the flat indentation tests,the dimensionless displacement of the unloading position was mostly greater than 0.1.Therefore,in a case where dimensionless displacement is greater than 0.1, β can be represented by the corresponding average β value.For light alloys, β was 1.006; for steel, β was 0.8511.
2.4. Criterion validity of goodness of fit
The stress-strain relationship obtained for a material based on indentations at different locations on its surface may be subject to different degrees of dispersion due to material nonuniformity, measurement error, and problems related to the test method. The degree of dispersion of the test results can be comprehensively evaluated using the goodness of fit G.First, the σ-ε curve for a certain elastoplastic strain range(Δε ∈[εy, εmax]) was selected and divided into k sections(k ≥20). σicorresponded to εi,i=1...k(εi=i·Δε/k) and the goodness of fit G that characterizes the dispersion is defined as follows:

where σi_ref,i=1,2...kis the i-th reference stress under the kdivided σ-ε reference curve.The σ-ε reference curve can be calculated using the average σ-ε curve taken either from the σ-ε curves obtained at different indentation locations or the true uniaxial tensile stress-strain curve. A G value greater than 0.95 is considered significant.
3. Theoretical model and parameter determination methodology
3.1. Energy density equivalent principle
For a loaded component with a deformation domain of Ω,O is any point in Ω.The Representative Volume Element(RVE)at this point is subject to a complex stress state σij.This complex stress state can be expressed as the equivalent von Mises stress,such that the energy density u3-Dis equal to the RVE energy density ueqin the uniaxial equivalent stress state, i.e.,

It was assumed that the uniaxial equivalent stress-strain relationship of a given material conforms to H-law, and is within the linear elastic regime of H-law for the material as follows:

Within the deformation domain Ω, the equivalent strain energy density ueqof the RVE is continuous. According to the integral mean-value theorem, there must be a point ξ(xξ, yξ, zξ) in the deformation domain Ω at which the strain energy density uξof the RVE of the material is equal to the average strain energy density; hence, the deformation energy U of the deformation domain is satisfied as follows:
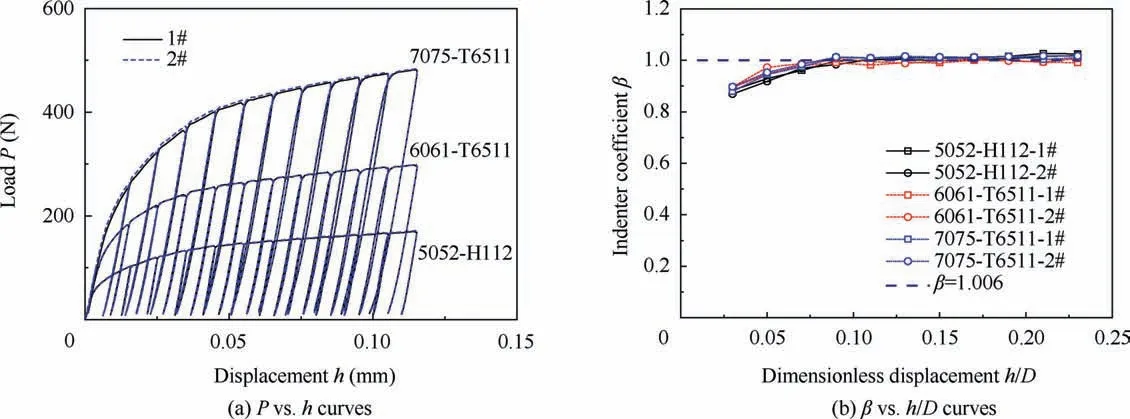
Fig. 7 Flat indentation of aluminum alloys with multi-level loading and unloading.
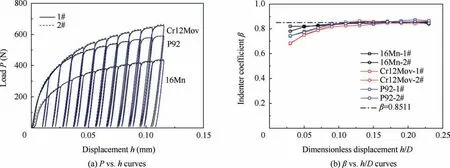
Fig. 8 Flat indentation of steels with multi-level loading and unloading.

where ξ(xξ, yξ, zξ) is the mean value of the strain energy density of the deformation domain Ω,and V is the effective deformation volume of the loaded component.
When no other forms of energy dissipation are considered,the deformation energy U of the unidirectional load P is equal to the external force work W, i.e.,

Eq.(15)describes the relationships among equivalent strain of the mean energy density of the material RVE,H-law related parameters K and n, load P, and displacement h. This is the governing equation used to solve the elastoplastic problem.
3.2. Semi-analytical model for flat indentation
Fig. 9 shows the deformation of a cylindrical flat indenter of diameter D when it is used for the indentation of a specimen.
For power-law hardening materials, according to the FEA model,the energy-displacement curve is in accordance with the power law and is related to σy/E.Therefore,the form of V and εep-eqis assumed as follows:

Fig. 9 Indenter, specimen, and deformation domain Ω of flat indentation.

where k1and k2-k4are the displacement coefficient and displacement indices related to the effective deformation volume,respectively;and k5and k6are the displacement coefficient and displacement index related to the equivalent strain, respectively. k1-k6are dimensionless constants.
The governing energy equation for flat indentation can be derived from Eqs. (15) and (16)

where W* = EnD3is the characteristic indentation work.This equation is termed the Energy-density-equivalence for the Flat Indentation(E-FI)model,based on the energy density equivalent principle.
Load and displacement values were collected during the flat indentation test and the energy-displacement curve was readily obtained. Nonlinear least-squares fitting, based on Gauss-Newton iteration, was applied to the energydisplacement curve using Eq. (17), to obtain the H-law parameter σyand n of the material. This is named the Energy-density-equivalence for Flat Indentation Method (EFIM).
3.3. E-FI model parameter determination
A typical light alloy (E=70 GPa) and steel (E=200 GPa)were selected. The initial yield stress σyand the strain hardening index n of two types of material were set to four groups:(A) 200 MPa, 0.1; (B) 200 MPa, 0.4; (C) 800 MPa, 0.1; and(D) 800 MPa, 0.4. The load-displacement curves corresponding to the four groups of H-law parameters of materials were calculated using FEA, and the energy-displacement curves were obtained from the load-displacement curves. The displacement range was 0.04-0.1 mm, and the values of k1to k6were obtained according to the regression of Eq. (17), as shown in Table 2.
4. Model verification
4.1. Forward prediction of the E-FI model
The forward prediction of the E-FI model is the energydisplacement relationship predicted by the E-FI model under the condition that the H-law parameters of materials (E, σy,n) are known. Steel (E of 120 GPa, 150 GPa, 180 GPa, 200 GPa, and 220 GPa) and light alloy (E of 50 GPa, 70 GPa,and 90 GPa) H-law materials with initial yield stress σyof 100 MPa, 400 MPa, and 800 MPa and strain hardening indices n of 0.05, 0.2, and 0.4 were forward predicted using the E-FI model. The energy-displacement curves were obtained for the H-law materials under the above conditions using the E-FI model, and the load-displacement curves of the corresponding H-law materials were acquired by FEA to produce the energy-displacement curves. The comparison of the energy-displacement curves obtained using the E-FI model and the FEA showed that the two were in good agreement (Fig. 10).
4.2. Reverse prediction using E-FIM
Reverse prediction is the process of first attaining the energydisplacement curve by the load-displacement curve of the flat indentation experiment, and then calculating the H-law parameters of materials using E-FIM from the energydisplacement curve. FEA was conducted for steel and lightalloy H-law materials with an initial yield stress σyof 100 MPa, 200 MPa, 400 MPa, 600 MPa, and 800 MPa and a strain hardening index n in the range of 0.05, 0.1, 0.2, 0.3,and 0.4. The 0.04-0.1 mm range of the load-displacement curve obtained by FEA and the H-law parameters of materials obtained by E-FIM were consistent with the corresponding known H-law parameters of the materials,as shown in Fig.11.
4.3. Stability of the E-FIM solution
The stability of the solution model refers to its sensitivity to experimental signal test errors. The model is stable when the solution model can obtain reverse-solution results that are within the allowable test error range.
4.3.1. Effect of displacement interference on E-FIM
Test errors are inevitable in the experimental process due to uncertainties in the test environment, manufacturing accuracy of the test instrument, and flatness of the testing material. By disregarding the error of the load sensor and considering the effect of the fixture and indenter of the load chain on the accuracy of the indentation displacement, a proportional displacement error δ1(±2%) was introduced. In addition, due to the uncertainty at the zero-point of the load-displacement curve,a zero-drift error δ2hmax(±2%hmax) of the displacement was introduced. We then obtain the following equation:

where herroris the displacement after these errors were introduced.
When the E values of the H-law materials were 70 GPa and 200 GPa,the σyvalues were 200 MPa and 600 MPa,and n was 0.1 and 0.4, the corresponding load-displacement curves were obtained using FEA,and the displacement error shown in Eq.(18)was introduced.For the four types of errors for δ1and δ2,the energy-displacement curves were obtained from the loaddisplacement curves after the errors were introduced and compared with the reverse-solved H-law parameters of materials obtained using E-FIM, as shown in Fig. 12.
The eight σ-ε curves in Fig. 12 were used for the σ-ε reference curve to calculate the goodness of fit between the σ-ε curves after introducing the errors and the reference σ-ε curve;the results are shown in Table 3.The G values were above 0.98,all of which are in the significant range.
4.3.2. Effect of data selection range on E-FIM
The valid range of the indentation displacement parameters for the E-FI model was 0.04-0.1 mm. In principle, any range of displacement data could be selected in this interval to calculate H-law parameters using E-FIM.To determine the stability of E-FIM in the different ranges of the energy-displacement curve, three displacement ranges were defined, as shown in Table 4. The H-law parameters were obtained using E-FIM for the energy-displacement curves,according to the three displacement ranges, which were in close agreement with the given hypothetical material parameters, as shown in Fig. 13.Therefore, E-FIM is highly robust in terms of the selection range.
5. Application of E-FIM
The dimensionless energy-displacement curves for flat indentation experiments on five kinds of steel and five kinds of light alloy are shown in Fig. 14(a) and Fig. 15(a), respectively.The three dimensionless energy-displacement curves of flat indentation for each material indicate a high level of repeatability. The dimensionless indentation work range of 0.004 to 0.012 in the initial loading, which corresponds to the dimensionless energy-displacement curve, was linearly fitted. The intersection of the fitted straight line and the h/D axis was taken to be zero points for the dimensionless energydisplacement curve of flat indentation. The translated dimensionless energy-displacement curve and the reverse-solved Hlaw parameters for materials that were obtained using EFIM are compared in Fig. 14(b) and Fig. 15(b). The results obtained using E-FIM are consistent with the uniaxial tensile test results.

Table 2 k displacement values for light alloy and steel.
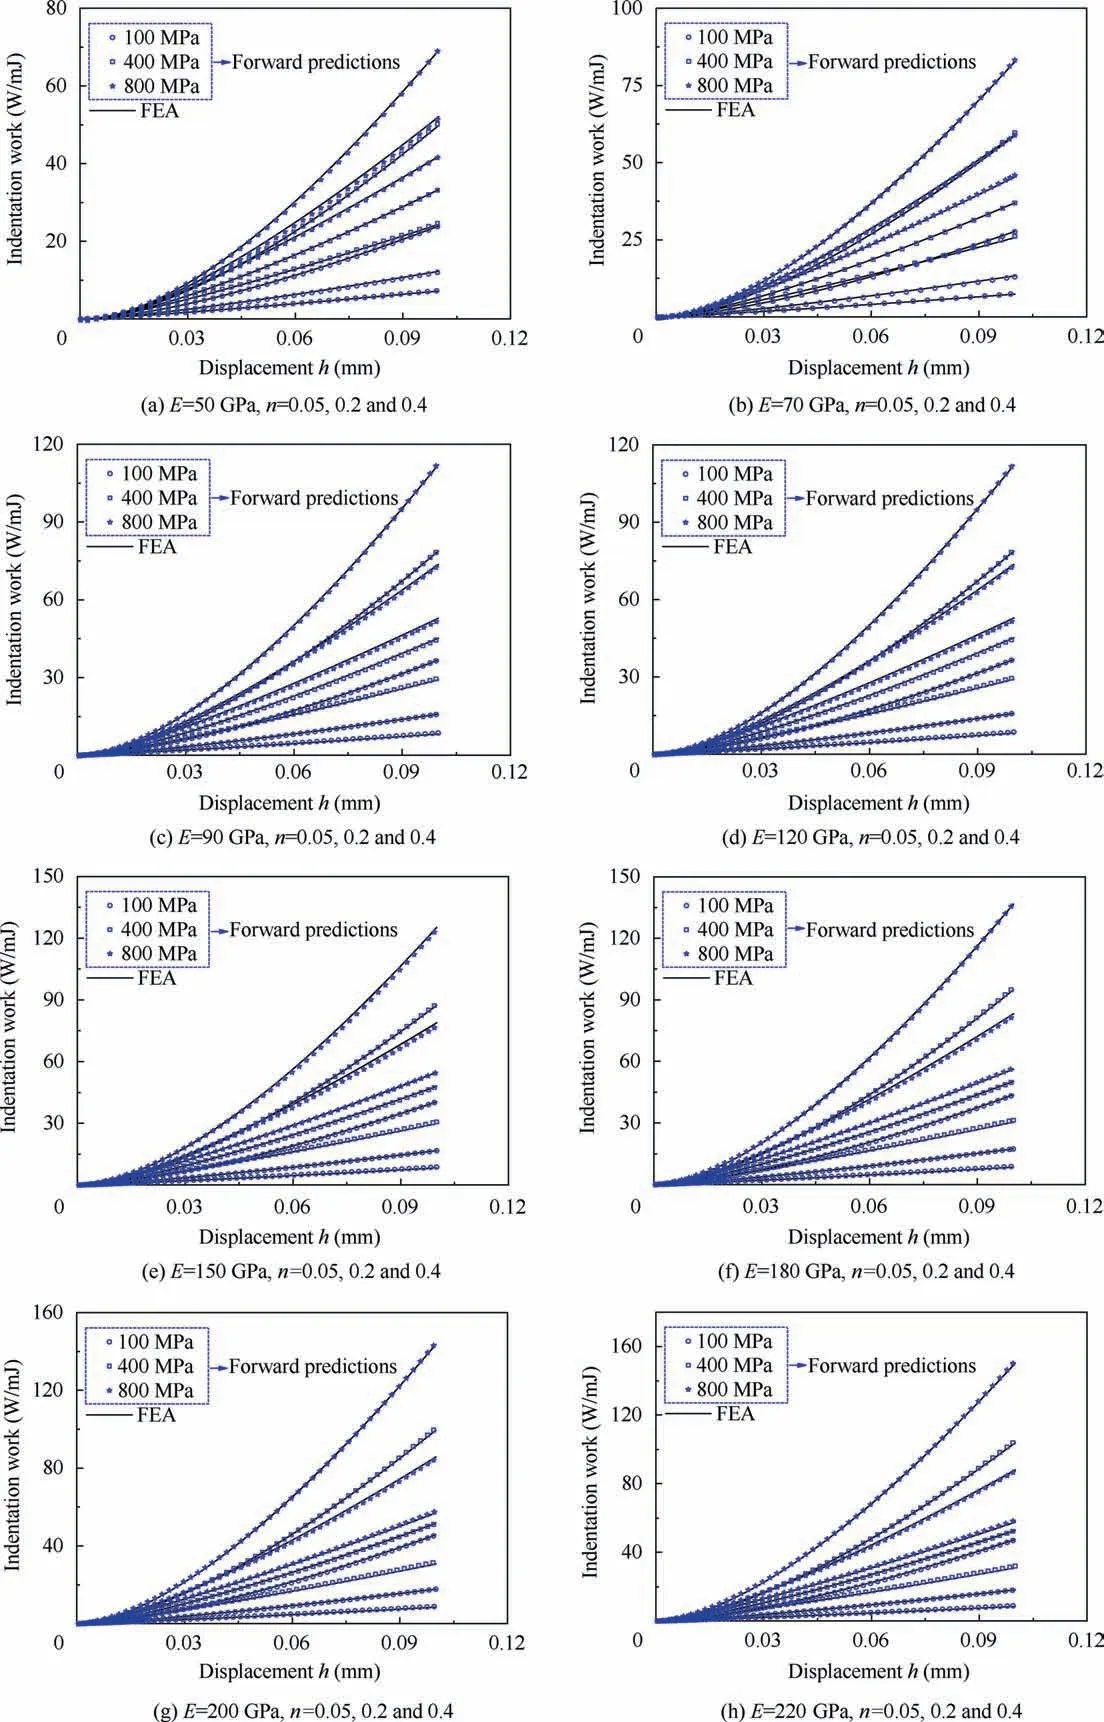
Fig.10 Comparison between forward-prediction results obtained using the E-FI model and FEA under various material parameters(E,σy, n) for steel and light alloy H-law materials.

Fig. 12 E-FIM stability contrast diagram.

Table 3 Goodness of fit between stress-strain curves with and without errors.

Table 4 Ranges of displacement h.

Fig. 13 σ-ε curves for different displacement ranges.
The tensile strength Rm31, as acquired by E-FIM, can be obtained from the H-law parameters for a material as follows:

where e is a natural base.The prediction method of the elastic modulus described in Section 2.3 was employed, and the flat indentation loading and unloading experiments were completed three times.The elastic modulus was calculated by solving for the initial unloading section of the load-displacement curve.
For the ten kinds of material under consideration,three flat indentation experiments were performed, and the tensile strength Rmwas obtained from the average H-law parameters of the three flat indentation experiments and Eq.(19).Table 5 shows the test results for tensile strength and the average elastic modulus of the materials used in the flat indentation experiment. The results of uniaxial tensile tests are also presented.
Table 5 shows that the majority of the relative errors between Rmvalues obtained by flat indentation and uniaxial tensile testing were less than 3 %, and the maximum relative error was no greater than 4.5 %. Most of the relative errors between the elastic modulus and uniaxial tensile test results were less than 3 %, and the maximum error was no greater than 5.5 %.

Fig. 14 Test results for five types of steel.
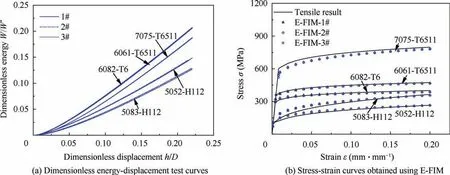
Fig. 15 Test results for five types of light alloy.

Table 5 Comparison of elastic modulus and tensile strength with uniaxial tensile results.
6. Conclusions
1) An E-FI semi-analytical model for flat indentation based on the energy density equivalent principle was proposed to describe the relationship among the H-law parameters of materials,flat indenter diameter, indentation work, and displacement.
2) An E-FIM for calculating the H-law parameters of materials by flat indentation was also proposed based on the energy density equivalent principle. The E-FI model and E-FIM were applied to a wide range of materials for both forward and reverse verification,and their accuracy and universality was demonstrated.
3) The stability of the E-FIM was discussed in detail. The results show that the E-FIM exhibits high stability in terms of displacement interference and different data selection ranges.
4) Flat indentation experiments were conducted for ten kinds of ductile metal material, and the H-law parameters for each material were obtained using E-FIM,which were in good agreement with the H-law parameters of the materials obtained by uniaxial tensile tests. Both elastic modulus and tensile strength of ten ductile materials were closed to the uniaxial tensile results.These test results indicate the robustness and accuracy of the proposed model and method, validating their potential for future industrial use.
Acknowledgement
This study was co-supported by the National Natural Science Foundation of China (No. 11872320).
杂志排行
CHINESE JOURNAL OF AERONAUTICS的其它文章
- Design and experimental study of a new flapping wing rotor micro aerial vehicle
- CFD/CSD-based flutter prediction method for experimental models in a transonic wind tunnel with porous wall
- Prediction of pilot workload in helicopter landing after one engine failure
- Study of riblet drag reduction for an infinite span wing with different sweep angles
- Modulation of driving signals in flow control over an airfoil with synthetic jet
- Strong interactions of incident shock wave with boundary layer along compression corner
