Extension of continuous scanning laser Doppler vibrometry measurement for complex structures with curved surfaces
2020-02-24CuihongLIUChaopingZANGBiaoZHOU
Cuihong LIU, Chaoping ZANG, Biao ZHOU
Aero-engine Thermal Environment and Structure Key Laboratory of Ministry of Industry and Information Technology,Nanjing University of Aeronautics and Astronautics, Nanjing 210016, China
KEYWORDS Arbitrary scanning path;Continuous Scanning Laser Doppler Vibometry(CSLDV);Fitted polynomial;Galvanometer scanner system;Rectangular scanning path
Abstract The continuous Scanning Laser Doppler Vibrometry (SLDV) developed on the base of the galvanometer scanner system has made it possible to quickly obtain the full field vibration responses within a rectangular area of the structure.In this paper,an arbitrary continuous scanning path generating method for Continuous Scanning Laser Doppler Vibometry (CSLDV) is further put forward in order to allow the CSLDV suitable for testing structures featured by complex shapes not just for regular areas. In the first step, the relationship between position of laser spot and the driving voltages of galvanometer scanner system has been described by a mathematical modeling.Then,a novel arbitrary scanning path generating strategy based on CSLDV is presented by deforming a normalization rectangular scanning path to an arbitrary continuous scanning path.The mapping relation between the normalization rectangular scanning path and arbitrary continuous scanning path is established using the reference points.In the second step,a compressor blade with curved surface was taken as an example for modal test using the proposed method. At the same time, a validated experiment was performed in SLDV. The results show the mode shapes derived from the extended CSLDV are in agreement with those from SLDV and the Modal Assurance Criterion (MAC) between the two are all greater than 0.96. They also demonstrate the feasibility and effectiveness of the proposed method for CSLDV test and show strong potential on further practical engineering applications.
1. Introduction
In recent years, the Laser Doppler Vibrometry (LDV), as a powerful technique for non-contact vibration measurements,1is widely used in modal testing of structures in order to avoid the problems met with conventional accelerometers’ measurement2such as loading effect, limitation of the number of measurement points,time consuming and so on.The Scanning Laser Doppler Vibrometry (SLDV)3-4that is characterized by two orthogonally-positioned mirrors driven by galvanometer motors significantly extends the capability of LDV. It allows to direct the laser beam as a movable velocity transducer and performs in the point-by-point scan mode to obtain vibration responses of all the measurement points.5The mode shapes can be obtained by modulating the measurement data of a series of scan points. For a spatially dense measurement of the structural mode shape, hundreds or thousands of scan points are usually taken and the test time can be quite lengthy.Such limited capability of SLDV in dealing with a huge amount of measurement data and excessive testing time6motivates its evolution into the Continuous Scanning Laser Doppler Vibometry (CSLDV).7The CSLDV is a spatial field measurement technique.8During scanning of the laser beam,the acquisition of the time history of vibration velocity is performed. Park9and La10et al. performed the vibration measurements by directing the laser beam to move continuously and sinusoidally on a structure surface. Since the laser spot continuously moves along a scan trajectory over the surface of structure, all the velocity responses along to the scanning path can be collected. Therefore, the structural Operational Deflection Shapes (ODS) and mode shape can be obtained11with significantly reduced time. Generally speaking, CSLDV is always applied into vibrational measurement of the structures with rectangular area such as beams12-17and plates.18,19The continuous scanning paths are straight lines of beams and the scanning paths for the rectangular plates can be generated by dissimilar frequency sinusoids using sinusoidal trajectories,e.g., 2D Lissajous trajectories. However, many structures featured by irregular surfaces such as the twist blades of aeroengine have limited of the applications of CSLDV due to the difficulties of generating the suitable scanning path for irregular geometric profiles. Currently, the relevant research is rare.
The objective of this paper focuses on exploring a novel approach to extend the applicability of CSLDV on complex structures with curve surfaces.Based on a mathematical model of the laser spot in the galvanometer scanner system,a normalized scanning path for a square area is introduced and transformed to suitable scanning over the non-rectangular area.The coordinates of reference points in galvanometer Scanner Coordinate System (SCS) and the corresponding location of this reference points mapped on the square area are explored.The coordinates of reference points in SCS can be generally obtained by recording the rotation angles of mirrors or the driving voltages of motors. Utilizing the information of the reference points,a set of appropriate polynomials can be determined to transform the normalized scanning path to an arbitrary deformed scanning path for complex structures. As an example,a compressor blade featured by curve surface is taken for vibration measurement using the extended CSLDV test and the feasibility and effectiveness of this proposed method is evaluated.
This paper is organized as follows. Section 2 briefly discusses the mathematical model of the laser spot in the galvanometer scanner system. Then, an arbitrary continuous scanning path generating strategy based on CSLDV measurement is developed to be suitable for testing structures featured by curve shapes. In Section 3, the proposed method is applied for accomplishing the vibration measurement of the curved blade and also compared with the results from the SLDV test in order to illustrate the effectiveness and accuracy of this approach. Section 4 summarizes the conclusions.
2. Arbitrary continuous scanning approach based on CSLDV measurement
2.1. The mathematical modeling of the laser spot in the galvanometer scanner system
The galvanometer scanner system consisted of two orthogonal mirrors (X mirror and Y mirror) driven by two motors is shown in Fig. 1(a). The laser spot’s coordinate depending on the rotation angles of mirrors in the scanner coordinate system is also shown in Fig.1(b).Considering the voltages of vxand vysupplied to the X and Y mirrors, the mirrors will produce certain rotation angles θxand θy.Both rotation angles are proportional to the input voltages and can be expressed in the following:

where S is the proportional constant which depends on the scanner control system.

According to the principle of light reflection, the relation between the incident beam I and reflection beam R is written as follows:

where n is the normal vector of incident plane.
Combine above geometric relationships and the principle of light reflection, the position of the laser spot P in SCS can be obtained, which yields its coordinates P (x, y, z) in O2XYZ:

Fig. 1 Galvanometer scanner system and coordinates of laser spot in SCS.
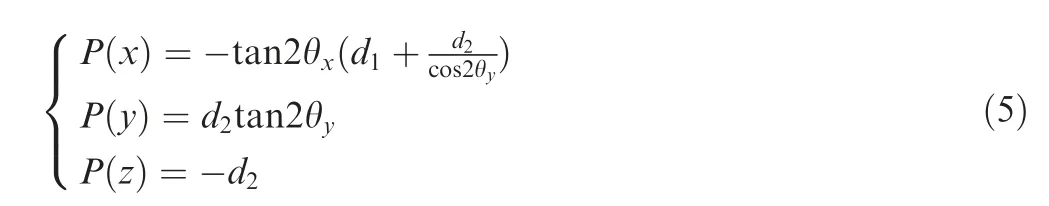
where d2is defined as distance along the Z axis between the position of the laser spot beat on object’s surface and the plane O2XY. Substituting the Eqs. (1) to (5), the relationship between position of laser spot and the driving voltages of galvanometer scanner system is obtained.If the laser spot on a 2-D planar structure’s surface,d2is a constant value and for the situation that the laser spot on 3-D structure surface,the value of d2are varied.The more detailed discussion can be found in our previous work.20
2.2. Generation of arbitrary scanning path based on CSLDV measurement
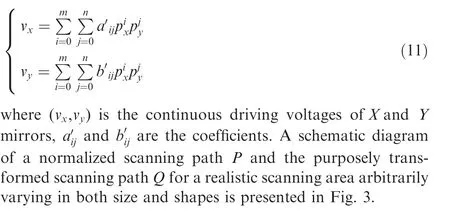
The position of the laser beam in SCS is uniquely determined by the rotation angles of X and Y mirrors according to Eq.(5).For CSLDV, a normalized scanning path P(px,py) for a normalized square testing area with sides of length 1 is firstly defined:
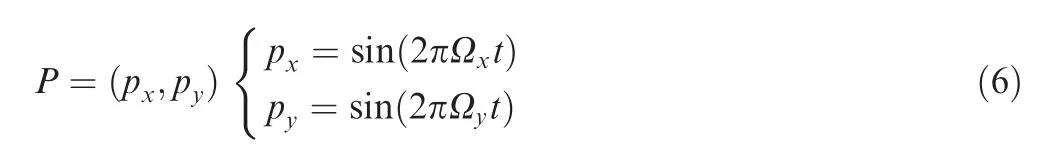
where Ωxand Ωypresent the scanning frequencies of X and Y mirrors, respectively. t is the time variable. When Ωx≠Ωy, the resultant scanning path on the testing area resembles a Lissajou’s pattern. Substituting Eqs. (1) and (6) into Eq. (5), the input voltages vxand vycan be derived to direct the laser beam continuous scanning over the square area.
In the case of an arbitrary rectangular scanning area varying in both size and shape, the corresponding scanning path Q(qx,qy), can be derived by a linear transformation between P and Q:
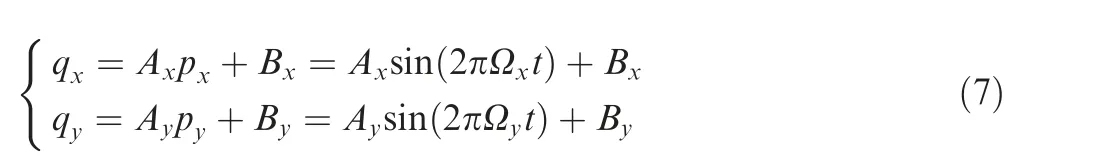
where Axand Ayare the proportional constants of the scanning amplitudes in X and Y directions, Bxand Byrepresent the constant-offsets. With the map between the normalized scanning path and the transformed scanning path, the continuous scanning path for any arbitrary rectangular area can be readily set.
If the actual scanning area is of a non-rectangular shape,the linear relationship in Eq.(7)being restricted to rectangular shapes fails to relate the anticipated scanning path with the normalized scanning path. It is thus desirable to develop a novel path-generating strategy that is capable of dealing with a wide range of scanning shapes including some having curved sides.To this end,auxiliary reference points are added into the normalized square testing area Assuch that one can map a square area onto an arbitrary curved surface Ac, as shown in Fig. 2. For any scanning point within the normalized square area As, there is only one corresponding point in the curved area Acthat matches realistic geometric features of the testing objective.
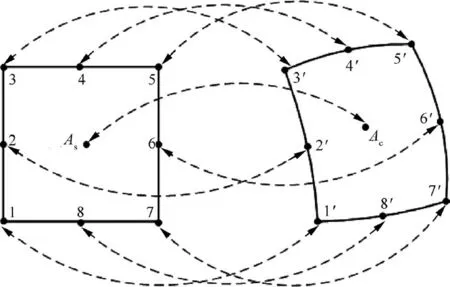
Fig. 2 Position relation of points between in As and in Ac.
The mapping between the normalized scanning path P(px,py) with auxiliary reference points and the desired scanning path Q(qx,qy) suitable for the actual testing surface can be expressed by fitted polynomials as:

where aijand bijare the coefficients, m and n are the orders of the fitted polynomials, respectively. The unknown coefficients aijand bijcan be determined by solving Eq.(8),which leads to:

where the superscript[]+represents Moore-Penrose pseudoinverse of a matrix. (px,k,py,k) are the coordinates of auxiliary reference points on Asand at the same time, (qx,k,qy,k) are the coordinates of laser spot on the actual scanning area Ac.The subscript k=1,2,···,N, denotes the number of auxiliary reference points.Polynomial coefficients aijand bijcan be fully determined by substituting the coordinates of all the reference points in both the normalized square area Asand the actual scanning area Acinto Eqs. (9) and (10).
In this method,selection principle of the reference points is dependent on the geometric shapes of the testing objective.On the one hand,the reference points will be selected at the structural edge to characterize the whole feature of the geometric shape of the object. On the other hand, some reference points in curve surface are needed to characterize the local feature of the object. More selected reference points are used to fit the polynomials, the spatial relation is built more precise by the polynomials. Furthermore, accuracy of this algorithm also highly depends on the orders of the fitted polynomials.
According to the spatial relationship described by Eq. (8),once the coefficients of polynomials are determined, the fullfield continuous scanning path Q(qx,qy) for actual curved scanning area Accan be derived by substituting the normalized continuous scanning path P(px,py) into Eq. (8).
The position of the laser spot in Ac, Q(qx,qy), is uniquely determined by the rotation angles or driving voltages of X and Y mirrors according to Eqs.(5)and(1).Therefore,Eq.(8)can be alternatively rewritten in the following form so that the driving voltages could be definitely specified to generate the required scanning path:
3.The experimental test of the curved compressor blade with the CSLDV method
Based on the above approach, the CSLDV technique can be extended to modal test of actual structures with arbitrary shapes in an efficient and an effective way.Here,a compressor blade characterized by the curved surface is selected as the test structure to demonstrate the feasibility of the technique.
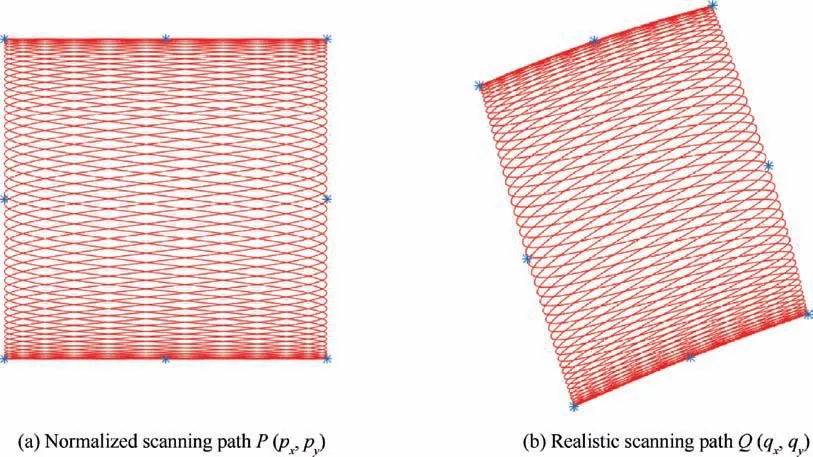
Fig. 3 Deformation of scanning path.

Fig. 4 Schematic diagram of testing setup.

Fig. 5 Compressor blade with reference points (white dots).
This curved blade is clamped in the root joint and excited by a non-contact acoustic exciter in conjunction with a power amplifier.The schematic diagram of the testing setup is shown in Fig.4.The galvanometer scanner system consists of two sets of galvanometer components produced by Cambridge Technology Inc. The compressor blade is about 70 mm wide and 150 mm high. The distance between the blade and the galvanometer scanner system is about 1500 mm. Since no drastic curvature change is observed on the blade surface as shown in Fig. 5, the number of reference points, k, distributed almost uniformly onto the ‘pressure’ surface, is selected as 15 and are marked on the blade surface with white color. The curved blade is scanned by deforming the normalized scanning path to proper scanning path for the curve surface and modal tests of the blade are carried out by employing the proposed method to extend CSLDV.
3.1.Design of the continuous scanning path for the curved blade
As the laser beam is directed to scan over the reference points one by one, the coordinates (px,py) of these points in the normalized areaAsand the driving voltages of X and Y mirrors,(vx,vy), which direct the laser spot to the corresponding positions of the reference points in actual scanning area Ac, are recorded and listed in Table 1. The polynomial coefficientsandcan be determined by substituting these data into Eq. (11). Then, the fitted polynomials can be used to deform the normalized scanning path to the driving voltages for the irregular scanning path suitable for the curved blade.
When Ωx=10 Hz and Ωy=0.3 Hz, the input voltage waves for normalized scanning path are shown in Fig. 6(a)and the realistic input voltages for scanning the actual curve surface according to Eq.(11)are shown in Fig.6(b).The scanning path can be easily derived by substituting the realistic input voltages into Eqs. (1) and (5). Fig. 7(a) shows the normalized rectangular scanning path for the square unit area Asand the actual scanning path of laser beam covered the curve surface of the blade is a deformed Lissajous pattern(the reference points denoted by ‘*’), as shown in Fig. 7(b).
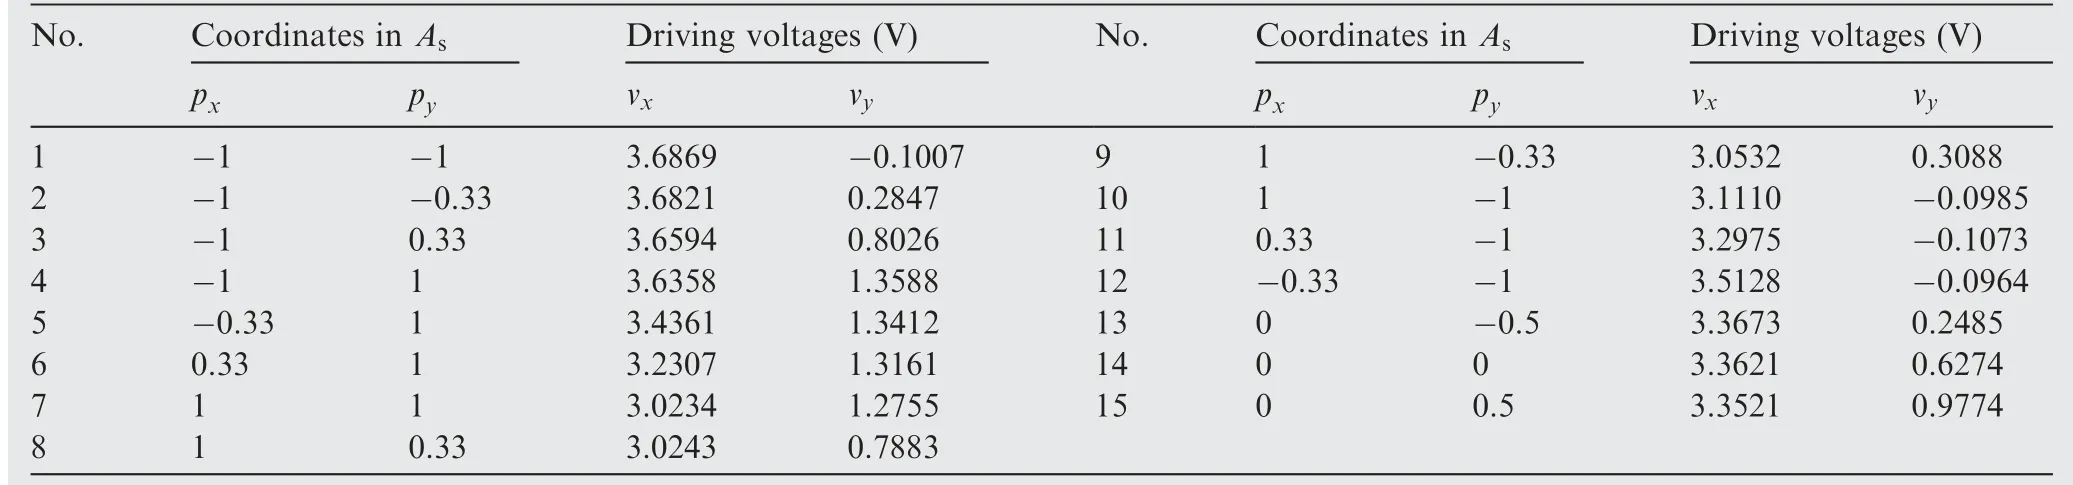
Table 1 Coordinates and corresponding driving voltages of reference points.
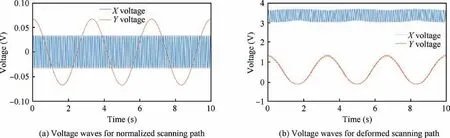
Fig. 6 Input voltage waves.
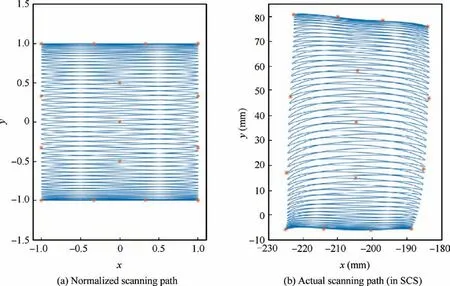
Fig. 7 Deformation from normalized scanning path to actual scanning path (the ‘*’ represent reference points;Ωx =10 Hz, Ωy =0.3 Hz).
3.2. Results of modal test
The laser spot is directed to scan continuously over the surface of the curved blade by applying the two input voltage waves(as shown in Fig. 6(b)) to the galvanometer scanner system.At the same time, the vibration response along the scanning path is collected.
For a linear structure subjected to sinusoidal excitation at frequency ω, the sinusoidal vibration velocity vzof a point,in the z-direction, can be written as:

For the square scanning path, the laser beam is applying a movement x=sin(2πΩxt) and y=sin(2πΩyt). VR(x,y) and VI(x,y) are the real and imaginary components of amplitudes at the spatial position.They can be represented as polynomials series in x and y with the polynomial coefficients obtained from the spectral amplitudes of symmetrical sidebands of the LDV output.17,19Then, the ODSs of the blade can be derived from the sideband spectrums using the method proposed by Stanbridge and Ewins.11
When the blade is excited with a sinusoidal signal at the frequency ω=ωk(k=1, 2, 3,···) (ωkare the natural frequencies of the blade), the ODS derived from the sideband spectrums is mostly dominated by the mode shape of the natural frequency ωkand therefore can be considered as the mode shape of the blade.In the tests,the blade is excited at the first 6 order of natural frequencies respectively. Each test is completed only in 15 s.The velocity output signals in time domain and the corresponding sideband spectrums in frequency domain are shown in Fig. 8.
The ODSs can be derived by the amplitudes of sideband spectrums. In general, any number of points is allowed to fit the ODSs. The more points are used, the smoother the mode shapes will be described.Here,171 points(9×19 points)were taken to fit the ODSs of the blade and the first 6 ODSs were obtained and shown in Fig.9(a). On the other hand,the same measurements based on normal SLDV method in the point-bypoint scan mode with the Polytec PSV-400 instrument were performed to verify the results from the extended CSLDV measurements.It took tens of minutes to arrange the measurement points and accomplished the test in order to obtain vibration responses of all the measurement points.
For the SLDV, the spatial resolution defining the ODS is determined by the number of measurement points. Considering the same spatial resolution of ODSs in SLDV and CSLDV,the SLDV measurement needs a larger number of data to be recorded and the time-consuming is more than ten times than that of CSLDV. Fig. 9 shows that the ODSs derived from the extended CSLDV and SLDV respectively are highly consistent.
The Modal Assurance Criterion (MAC) is hereby used to quantitatively describe the similarity between two modes.From Fig. 10 and Table 2, it is found that the modal frequencies of the extended CSLDV are in agreement with that of SLDV and the MAC values between the two are all close to unit. It demonstrates the CSLDV based on the proposed method is effective.
The ODSs are the out-of-plane vibration components of a structure surface due to the responses are all along to the measurement direction in CSLDV. The incident angle of laser beam can be neglected when the area of the measured surface is small. However, a large scanning area and a short distance between the galvanometer scanner system and the measured structure will amplify measurement error and the out-ofplane vibration may not completely agree with the corresponding measured vibration. For these cases, the more accurate three-dimensional mode shapes can be derived from three sets of data by repeating the measurement mentioned above at three positions.
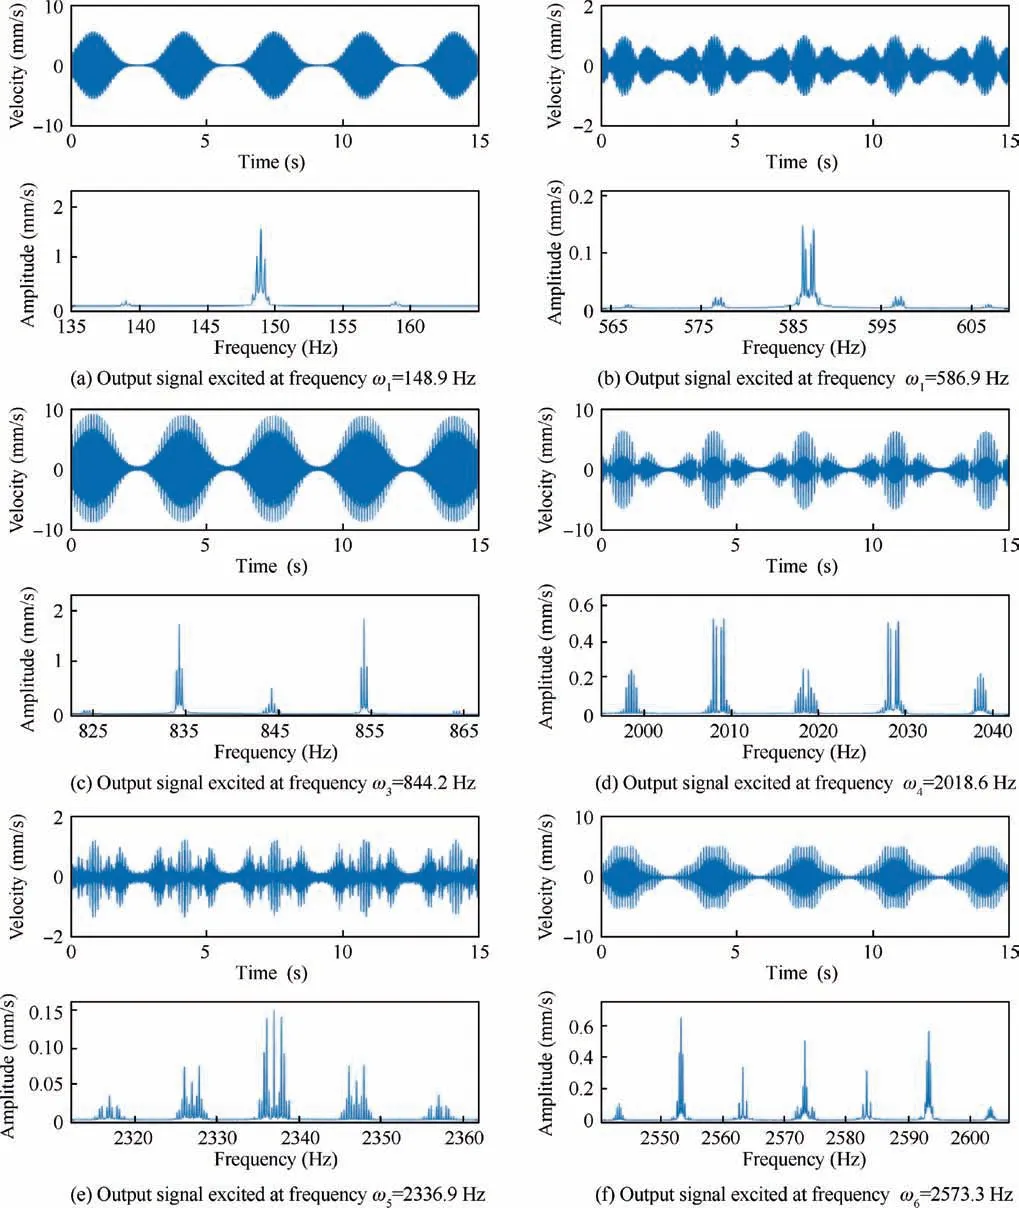
Fig. 8 Output signals in time and frequency domains at various frequency excitations.
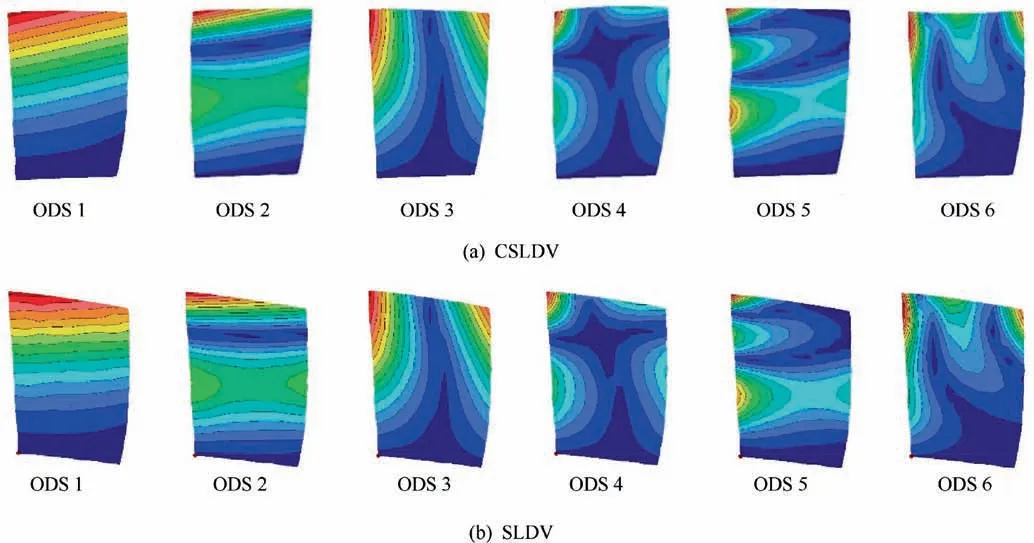
Fig. 9 Mode shapes.

Fig. 10 MAC values between SLDV and CSLDV.

Table 2 Frequencies and MAC values.
4. Conclusions
In this paper, a scanning path generating strategy suitable for testing objects featured by curved surface is put forward to obtain full-field vibration measurement with a very high spatial resolution.The mathematical model is helpful to determine the spatial relation between the laser spot and the galvanometer scanner system. The scanning path is allowed to be deformed to an arbitrary continuous scanning based on the transformation relation established by polynomial curve fitting of selected reference points. Combining the spatial relation and the arbitrary scanning path generating method, the extension of CSLDV allows to measure the complex structures with curved surface. A compressor blade was taken as an example for modal tests using the proposed method. At the same time, a validated experiment was performed in SLDV. Results show the mode shapes derived from the extended CSLDV are highly matched with that from SLDV and the MAC values between the two are almost close to unit. It effectively illustrates the feasibility of the proposed method with the advantage of significantly reducing the amount of measurement time. This approach shows great potential to industrial engineering applications.
Acknowledgements
The authors gratefully appreciate the financial support for this work provided by the National Natural Science Foundation of China and National Safety Academic Foundation of China(No. U1730129). The Cultivation Foundation of National Defense Large Projects of China (No. NP2018450). The supports from Jiangsu Province Key Laboratory of Aerospace Power System, the Key Laboratory of Aero-engine Thermal Environment and Structure, Ministry of Industry and Information Technology are also gratefully acknowledged.
杂志排行

CHINESE JOURNAL OF AERONAUTICS的其它文章
- Design and experimental study of a new flapping wing rotor micro aerial vehicle
- CFD/CSD-based flutter prediction method for experimental models in a transonic wind tunnel with porous wall
- Prediction of pilot workload in helicopter landing after one engine failure
- Study of riblet drag reduction for an infinite span wing with different sweep angles
- Modulation of driving signals in flow control over an airfoil with synthetic jet
- Strong interactions of incident shock wave with boundary layer along compression corner