An efficient regulation approach for tomographic reconstruction in combustion diagnostics based on TDLAS method
2020-02-24MingyuanXINJunlingSONGWeiRAOYanjiHONGYajingJIANG
Mingyuan XIN, Junling SONG, Wei RAO, Yanji HONG, Yajing JIANG
State Key Laboratory of Laser Propulsion & Application, Space Engineering University, Beijing 101416, China Received 21 April 2020; revised 28 June 2020; accepted 27 July 2020
KEYWORDS Absorption spectroscopy;Combustion;Number of rays;Regulation function;Tomographic reconstruction
Abstract For tomographic reconstruction in combustion diagnostics, it is usually necessary to solve a rank-deficient problem,where the number of non-linear dependent equations is smaller than the number of unknowns. In some reconstructions, there are grids without rays passing through.This produces artifacts during the reconstruction. In this paper, the weight of the regulation equation is modified with the number of the rays crossing the grid cells. The effect of the neighboring grid values as well as the number of rays crossing the grid cells is considered in the new regulation method. Numerical simulation results show that the new regulation method suppresses the reconstruction error of the no rays crossing grid and successfully restrains the corner distortion in four projection angles.The effects of the weight coefficient and the smoothing factor on the reconstruction are examined through a numerical study.Finally,a combustion experiment demonstrates that the new regulation method can significantly reduce the reconstructed error, especially for the nonray crossing condition, and the results are compared with thermocouple measurements and reconstructions without modified regulation.
1. Introduction
Laser Absorption Spectroscopy(LAS)technology is an optical measurement method that has been widely used in engine combustion diagnostics since 2000.1The detection region is in the range of a near-infrared wavelength up to the mid-infrared region of 4 m,which covers various absorption bands of combustion products such as H2O,NO,CO,and CO2.2-4Furthermore, due to its high precision, temporal resolution, and species-selectivity, LAS has been proven to be a practical and robust tool for in-situ measurements in harsh environments.5-7
Laser Absorption Tomography (LAT) that combines LAS technology and Computer Tomography (CT) is used to measure the two-dimensional distribution of parameters in a non-uniform flow field.8,9A LAT system can be divided into four modules,10including an optical measured module, data acquisition module, reconstruction module and presentation module.As the key step,the reconstruction algorithm has been quickly developed with applications in medical imaging and industrial process control.11Some algorithms have been adopted and applied to LAT for combustion diagnostics.12Because of the limitations of the measured space, it is difficult to install a sufficient number of detectors.As a result,the number of line-of-sight measurements is smaller than the number of unknowns in most cases, and the reconstruction problem is called a rank-deficient problem. However, in a discrete illposed problem, the number of line-of-sight measurements is larger than the number of unknowns. Refs.11,13-15provided detailed discussions on this topic. In engine combustion tests,many researchers have used the algebraic reconstruction technique and its modified algorithms to solve the rank-deficient problem for situations in which the line of sight is incompletely projected.16-19Ma et al.20,21proposed a hyperspectral tomography method in which simply perpendicular projections were used to reconstruct the 2D temperature and concentration distributions in 2008. Xia et al.22developed a two-step reconstruction method based on the Algebraic Reconstruction Technique (ART) to improve the reconstruction quality of the concentration. In addition to the reconstruction quality and hardware cost,the data processing time is also a consideration. In order to accelerate data processing, Busa et al.23developed a multi-tiered data analysis scheme based on principal component analysis.Yu et al.24extracted information from the previous reconstructions based on a machine learning algorithm that could rapidly predict reconstructions.
The LAT system is usually tested on a table-verification platform in the laboratory before engine testing.25,26The reliability of an optical probe and a reconstruction algorithm can then be tested. Unlike an engine test, the area of interest for reconstruction is a steady flow field for which a flat flame burner is chosen so that the test space and time are not limited.A measured probe with a moving and rotating function is used to reduce the hardware cost and test more functions. In some measurements, the reconstruction area is limited by hardware and cannot be fully covered by rays. At this time, the grids without rays passing through will not be constrained by the measurement equation. They are corrected with the reconstruction result of the grids with rays passing by regulation function. However, the effects of the regulation process to the grids with rays passing or not are mutual. It means that the non-ray grids will also change the value of the grid with rays passing at the same time, while the former’s values are independent of the measurement. The conventional regulation method is to process all the grids with equal weight. Non-ray grids have the same influence with the grids with rays. This causes the reconstruction error to be amplified by the value of the non-ray grids. An efficient regulation approach for tomographic reconstruction is proposed, which can significantly reduce the reconstructed error, especially for the nonray crossing.
Short reviews of the tomography method and the spectroscopy theory are described in Section 2. Section 3 presents the novel regulation method in detail. Section 4 provides the simulation results and the experimental results, including the influences of the parameters in the regulation equation. Section 5 summarizes this work.
2. Fundamental theory of TDLAT (Tunable Diode Laser Absorption Tomography)
As a combination of laser absorption spectroscopy theory and tomographic reconstruction, the Beer-Lambert law is expressed as a matrix:
where the area of interest is discretized into N square grid points; Aiis the integrated absorbance of the ith beam, and lijis the absorption length of the ith beam in the jth grid point;the subscript M represents the total Number of Rays (NR); fjis the function of the gas parameters in the jth grid; S(T, v) is the line strength function of temperature T and transition frequency v;Pjand χjare the local pressure and concentration in the jth grid respectively. In the tomographic reconstruction, a grid point is the smallest physical cell where the values are assumed to be constant. To solve Eq. (1), the modified ART method is used, which can be written as16,18

where δ is the smoothing factor, f(p,q)represents the function of the gas parameters in grid(p,q).The function is used to suppress the difference between the neighboring grid points. The regulation function has been changed based on the actual number of the grid points on the border of the area of interest.However, there are few or even no rays passing through the grid point near the border, which produces an artifact. There is little smoothing using these non-ray crossing grid points,which produces even more computational errors. The regulation function does not reflect the information of the rays.Therefore,we modified the regulation function that reflects the influence of the number of rays.
3. Regulation function
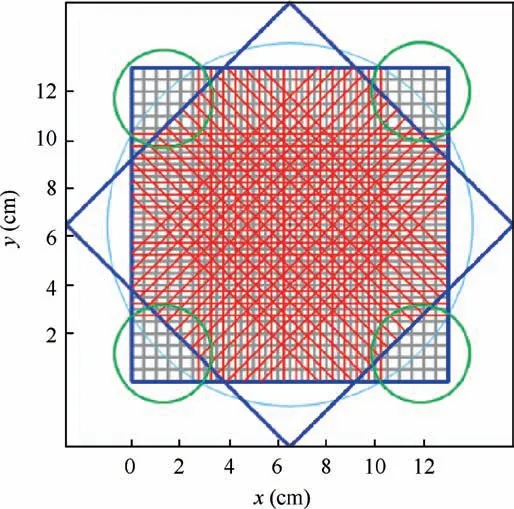
In Eq.(3),the influence of the neighboring grid points is equal to the point of interest f(p,q).We configured the system so that the laser transmitting and receiving probes were set in two parallel lines, and a controlled rotary table was fixed on the bottom of the probes. The entire measurement apparatus could rotate 360°. Fig. 1 shows the optical arrangement with four projected angles. The large circle represents the rotation path of the apparatus, and the two rectangles represent the places where the probes are set.The four small circles are the regions where few or no ray passed through.
In the ART algorithm, one projected equation is used at each step, and an iteration consists of M steps, as shown in Eq. (1). During the iteration, the values of the grid points are modified.For the single point,the computed value is close to the real value when the grid participates more frequently in the calculation.
A new regulation equation is written as

where w(x,y)is the weight of the grid point f(x,y), which is the NR crossing the grid. However, when there are no rays crossing the grid and neighboring grids, Eq. (4) cannot be applied.

Fig. 1 Optical arrangement with four projected angles.

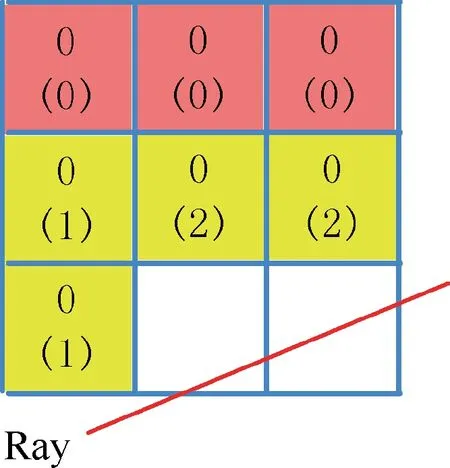
Fig. 2 Illustration of different groups of grid points.
The grids are divided into three groups. A simple example with 3×3 grid points and one ray crossing the area of interest is shown in Fig.2.The first group contains grids that have one or more crossing rays, as illustrated for the two grids in the bottom right corner in Fig. 2. The second group contains the grids and their neighboring grids that have no crossing rays,which is shown in the first row. For the grid point f(x,y), the neighboring grids are its nearest eight grids. For the outerboundary grids, which have fewer than eight neighboring grids, the denominator of Eq. (4) is replaced based on the actual number of the neighboring grids. The last group is the grids containing no crossing rays, but one or more rays cross its neighboring grids,as illustrated for four grids in the second and third rows in Fig. 2.
In Fig. 2, the first number in the grid represents the NR crossing the grid itself. The second number in brackets represents the NR crossing the neighbors. Although in the second and the last condition, the grids contain no rays passing through, the grids in the last condition are revised by the neighboring grids during the iteration, which should have a more reliable value than the grids in the second condition.Therefore, the weight of the grids for the last condition in Eq.(4)should be set higher than the weight in the second condition but smaller than the weight in the first condition.

The maximum of wrndis wmax, which is defined as

Fig. 3 Illustration of steps to calculate weight of grids without crossing rays.


Step 4.The number of grids with zero weights is calculated.
Step 5. Steps 3 and 4 are repeated until there are no grids with zero weights.
The new weights in Fig.3(b)after following the above steps are shown in Fig. 3(c).
4. Results and discussion
4.1. Effects of different projected angles
A parallel projection is used for which the distance between the first and the last probe is 17.5 cm with intervals of 5 mm. The distance between the transmitting laser and receiving probe is 32.5 cm.A circular area of interest is formed when the probe is rotated around the center.
Two temperature distributions from 300 K to 1500 K are designed to test the method. The concentration distribution is from 0.01 to 0.15.The first temperature model is a symmetric model with a Gaussian peak, and the second model is an asymmetric model with two Gaussian peaks. The concentration distribution is from 0.01 to 0.15. The original models are shown in Fig. 4.
The reconstructed results with different projection angles using regulation functions are shown in Fig. 5, where npis the number of projected angles. During the iteration, γ is 0.5 and δ is 0.005 in Eq. (4).


Fig. 4 Original temperature and concentration models.

Fig. 5 Reconstructed results with different projected angles using regulation functions.

Fig. 6 Reconstruction errors for different functions.
To quantify the reconstruction results, the relative difference between the origin and the reconstruction is defined as where superscript‘‘rec”and‘‘orig”represent the reconstructed result and the original distribution respectively. The reconstruction errors for different regulation functions are shown in Fig.6.There are large reconstruction errors at two projected angles for both methods with ~1.3 by Eq.(3)and ~1.0 by Eq.(4). The reason for the huge distortion is that the number of rays is too small compared to the number of grid points, and there are too many non-ray grid points. However, the new method of Eq.(4) does suppress the error for nearly 0.3.With the increase in the number of projected angles, the errors decrease.At four projection angles,method of Eq.(4)achieves a good suppression effect on the corner error, but the method of Eq. (3) still has a large deviation. The reconstruction error at this time is 0.143 by Eq. (3) and 0.056 by Eq. (4). When the number of projection angles reaches six,the number of grid points without rays is already very small. At this time, the reconstruction results of the two methods are similar.
4.2. Effect of weight coefficient


Fig. 7 Influence of γ on reconstruction.

Fig. 8 Effect of smoothing factor δ.

4.3. Effect of smoothing factor δ
δ determines the degree to which a single grid is affected by the surrounding grids. Fig. 8 shows the effect of δ on the reconstructed quality for the two temperature and concentration models. When δ is 0.005, a better reconstructed result is obtained. When δ is smaller than 0.005, the regulation effect is not obvious, and the influence of measurement noise is not sufficiently suppressed, which leads to an increase in reconstruction error. While δ is bigger than 0.005, the smoothing effect is too strong, and the reconstruction error is mainly caused by excessive smoothing. When δ is 0.005, the lowest reconstruction errors for model 1 and model 2 are obtained.If prior information of the flow field is known, δ can be set based on the changing gradient of the flow field.
4.4. Reconstruction of random phantoms
Based on the conclusions in Sections 4.1-4.3, different distribution phantoms are tested.In the reconstruction,four projection angles are used, smoothing factor δ is 0.005, γ is 0.5, and 100 random selections of two Gaussian peak phantoms are used to simulate the asymmetric temperature distributions.The temperature range is from 300 to 1500 K,and the concentration is uniform. The statistical results of the reconstructed errors are summarized in Table 1. The mean temperature reconstruction error significantly decreases from 0.431 to 0.037 by using the new regulation equations. The mean concentration reconstruction error is less than 0.1.
4.5. Experimental validation
Fig. 9 shows a schematic overview and photograph of the TDLAT system for the table-verification platform. A circular flat-flame burner and a rectangular flat-flame burner form the combustion region of the area of interest and H2O molecule is selected as target. An integrated prototype that we designed is used to control the laser emission,data acquisition,and storage. The fiber-coupled outputs from two Distributed FeedBack lasers (DFB) (NEL, 1391 nm and 1341 nm) are combined together into one single-mode fiber by a combiner(OZ Optics, WDM-12N-1340/1390-7/125-50), and then it is divided based on a 9:1 ratio by a fiber splitter (Thorlabs,1×2, 90:10). The first beam with a 10% intensity goes through a solid etalon with a free spectral range of 2 GHz(Light Machinery, OP-2638-83110) to calibrate the wavelength. The other beam is coupled into a fiber splitter that divides the beam into eight beams. The multiple beams are then collimated by the pitch lens and propagated across the area of interest. Another eight lenses installed in the opposite position are used to catch the free space laser beam and focus it into the multi-mode fiber.Finally,the beams are collected by an InGaAs detector array (EOS, IGA-030-E5/4 MHz) in the integrated prototype. The prototype and the computer are connected by the network cables for communication.

Table 1 Reconstruction errors and standard deviations using different regulation equations.
The laser emitters and receivers are fixed on two rectangular supports.The emitter has three angle-adjusting screws,and the transmission direction of the laser beam is adjusted by manual fastening or loosening. Additionally, the emitter has a locking mechanism that is used to fix the emitter when the laser beam has the correct direction.The rectangular supports are fixed on two electronically controlled horizontal movement tables that could be used to obtain a minimum translation distance of 5 mm. The bottoms of the movement tables are fixed on the electronically controlled rotary table,so the entire measurement apparatus could rotate 180° to perform measurements.

Fig. 9 Tunable diode laser absorption tomography system for table-verification platform.
The integrated prototype contains a laser controller module, a data acquisition and storage module, and a detector array. The integrated prototype has up to 16 laser emission ports,as well as 16 laser receiving ports.The integrated prototype has a maximum sample rate of 160 MB/s and an online storage of 256 GB with a bandwidth of 100 MB/s.The volume of the prototype is 100×150×200 mm3, the weight is less than 2.6 kg, and the power consumption is less than 25 W.27
In the experiment, the distance between the laser emitter and the receiver is 32.5 cm. Four projection angles and 144 beams are used.To contain all the projected beams,the smallest area of interest is a circular area with a diameter of 37.15 cm.The beam arrangement is the same,with four projection angles,as shown in Fig.5.The circular area is divided into 4341 square grids with lengths of 0.5 cm.
During the iteration process,γ is of 0.5,and δ is 0.005 based on the calculation results. Moreover, the maximum and minimum limits of the concentration and temperature are added.Fig. 10 shows the temperature and concentration reconstruction results without and with modified regulation. Two hightemperature regions appear in the top right corner and bottom left corner in Fig. 10(a). As is known, outside the combustion zone of the flat flame burner, the temperature drops rapidly.Therefore, the high temperature on the corner is a reconstruction artifact.Compared with Fig.10(b),the artifact in the temperature reconstruction is effectively depressed using the modified regulation.

Fig. 10 Temperature and concentration reconstruction results.

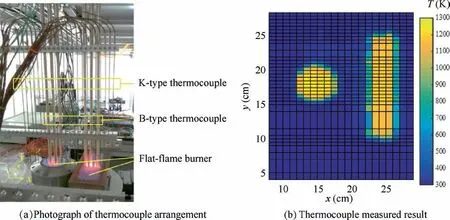
Fig. 11 Thermocouple arrangement.

Fig 12 Thermocouple measurements and reconstruction based on tunable diode laser absorption tomography.
After the TDLAT measurement, 20 K-type and 6B-type thermocouples (Omega) are used to measure the temperature of the area of interest. The photograph of the thermocouples arrangement is shown in Fig. 11(a). The thermocouples are fixed on an electronically controlled translation table that is used to move along the y axis to cover the combustion area.The interval between the two thermocouples is 5 mm. The measured distance along the y axis is not equal based on the temperature gradient change.At the edge of flat-flame burners,the measured distance is 5 mm.The sampling frequency of the thermocouples is 10 Hz, and ten points are recorded and averaged at each position. The measured result is shown in Fig. 11(b).
The interpolation results of the thermocouple and the reconstruction by the TDLAT are shown in Fig. 12. The reconstructed results are generally consistent with the thermocouple measurement results. Compared with Fig. 10 (a), the artifact is partly depressed at the upper right and bottom left corners using the new regulation approach. However, the reconstruction still contains errors on the bottom left corner.In the experiment, the optical arrangement is the same as that in Fig. 5, where the number of projected angles is four. In the simulation,the reconstruction error is suppressed in the corner with fewer rays.The possible reason is the measuring error.On the bottom left corner,some rays do not pass through the fire.One of the chosen transitions in the experiment is 7454.445 cm-1. The low energy of this transition is 1962.51 cm-1,28which has a low absorbance and low signalto-noise ratio at room temperature. Large noise is introduced into the projection (absorbance) and cannot be removed or smoothed in the iteration. It should be noted that, despite the use of the new regulation function,there is still a large deviation in the lower left corner of the reconstruction result in Fig.12.This error is generated by the reconstruction algorithm for measurement noise and lack of projection angle. In addition, the sharp change of temperature between the flame zone and the non-flame zone is also one reason of this. The reconstruction error locates in the grid with rays crossing, while the new regulation method mainly improves the zone of the grid without rays crossing,so the correction to the bottom left corner is not obvious.
5. Conclusions
A new regulation approach is proposed in this paper for tomographic reconstruction in combustion diagnostics based on TDLAS. The regulation method considers not only the effect of the neighboring grid point values but also the number of rays passing through the grid.Furthermore,grids without rays are a given weight based on the number of rays passing through the neighboring grids. The numerical study proves that the new regulation method achieves better reconstructions than the original regulation method, which can significantly reduce the reconstruction error, especially when no rays pass through the grids. The results show that the new method achieves the complete elimination of the distortion of the corner under 4 projection angles with an error of 0.056,while the original method still has contradictory deviations with an error of 0.143. The effects of the weight coefficient and smoothing factor on the reconstruction are also discussed. It shows that the weight coefficient can be set arbitrarily from 0 to 1, and the smoothing factor is recommended to be 0.005. Finally, a combustion experiment demonstrates the efficiency of the new regulation method by comparison with the results of the thermocouple measurements and the results without modified regulation reconstruction.
Declaration of Competing Interest
The authors declare that they have no known competing financial interests or personal relationships that could have appeared to influence the work reported in this paper.
Acknowledgments
This work was supported by the Beijing Natural Science Foundation (No. 1194028), National Natural Science Foundation of China (No. 61505263) and State Key Laboratory of Laser Propulsion & Application Foundation (Nos. SKLLPA-03 and SKLLPA-15).
杂志排行
CHINESE JOURNAL OF AERONAUTICS的其它文章
- Design and experimental study of a new flapping wing rotor micro aerial vehicle
- CFD/CSD-based flutter prediction method for experimental models in a transonic wind tunnel with porous wall
- Prediction of pilot workload in helicopter landing after one engine failure
- Study of riblet drag reduction for an infinite span wing with different sweep angles
- Modulation of driving signals in flow control over an airfoil with synthetic jet
- Strong interactions of incident shock wave with boundary layer along compression corner
