Evaluation of cerebral visual functions in low myopic adolescents
2020-01-08YunLiu1HuaHe1LiYanHangChuDianPengWu
Yun Liu1,2,Hua He1,Li Yan,Hang Chu,Dian-Peng Wu
Abstract
·KEYWORDS:myopia;cerebral visual functions;perceptual eye position;fixation stability;stereoacuity
INTRODUCTION
Myopia is one of the most common worldwide eye disorders,the prevalence of myopia in students is 51.9% in China[1].And researchers speculated that global prevalence of myopia will reach up to 50% by 2050[2].Such high and rapidly increased prevalence calls for attention to myopia.To make matters worse,the mechanisms of myopia,which has been focused on local retina for years,remained unclear.As a result,the treatments of myopia are merely efficient[3-6].
Studies on functional magnetic resonance imaging reported that functional connectivity density,representing the efficiency of neurons,in visual cortex of myopia was decreased[7-9].And the grey matter volume made up of neural cells,was significant decreased in myopic subjects[10].Moreover,concentrations of gamma-aminobutyric acid (which are vital to initiate the critical period plasticity during visual development[11])and its receptors in visual cortex were increased in myopic animals[12].These evidences suggested that visual cortex might also play an important role in myopia.
As it has been confirmed,optical images from the retina traveled through a hierarchy of progressive levels of visual processing,and ultimately got specialized through integration and analysis in visual cortex[13-14].In myopia,the optical defocus limited the resolution of visual inputs,thus,causing blurriness of image received by the retina.Hence,we raised the hypothesis that blur or unbalanced visual inputs received between eyes might slow down the process of decoding visual inputs within visual cortex in myopia[15-17].Under such circumstances,the ability for visual cortex to analyze and integrate visual inputs,which can be defined as cerebral visual functions may further get damaged.
Researches had proved that stereoacuity was affected in high myopia.But in mild and low myopia,it was hardly reported.And up to now,limited articles had fully evaluated other cerebral visual functions in myopia,let alone low myopia.Since a paucity of research existed to investigate whether low myopic subjects had defects on cerebral visual functions.We designed this study aiming to explore the effects of low myopia (especially early myopia)have on cerebral visual functions by comparing the cerebral visual functions between low myopic and normal subjects.
Plenty studies about diseases with defects in visual cortex,such as amblyopia and strabismus,had used perceptual eye position (PEP),fixation stability and stereo tests to sensitively evaluate cerebral visual functions[18-21].Therefore,in our study,same examinations were used to better evaluate the cerebral visual functions.
SUBJECTS AND METHODS
SubjectsA total of 120 adolescents (six to fifteen years old)from ophthalmology department of Tongji Hospital were enrolled in this experiment.Low myopic subjects without anisometropia were assigned to non-anisometropia group (n=60),while low myopic subjects with anisometropia were allocated to anisometropia group (n=30)and normal sighted subjects were distributed to control group (n=30).All subjects with low myopia had no history of wearing spectacles or contact lens,nor did they have a history of myopia more than one year.They both received same and full examinations performed by the same ophthalmologist.
Inclusion criterion for non-anisometropia and anisometropia group included:1)refractive error range from -0.5 diopter (D)to -3.00 D of spherical correction and up to -1.50 D of cylindrical correction in both eyes;2)best corrected visual acuity equal to or better than 20/20;3)the interocular difference of spherical equivalent (SE)<1.00 D for non-anisometropia group,while for the anisometropia group,the interocular difference of SE ≥1.00 D.
Inclusion criteria for control group included that visual acuity is within normal limits taken their ages into account.
Additional criteria for all groups included:1)accommodation and convergence were within normal limits;2)apparent eye position within normal limits[22](near phoria between -8△to +2△and far phoria range from -3△to +1△).
Exclusion criteria for all groups consisted of:1)family history of high myopia;2)any other ocular condition or causes for reduced visual acuity other than simple myopia and astigmatism;3)previous ocular surgery;4)presence of any myopia-related ocular complications;5)an altered cognitive or emotional state that might potentially impair the subject’s ability to perform tasks;6)other situations including pregnancy,diabetes mellitus.
ProceduresofCerebralVisualFunctionExaminationsIn our study,cerebral visual functions were evaluated by perceptual eye position (PEP),fixation stability and stereoacuity.
The devices used to measure cerebral visual functions included:Windows XP system PC host,LG2342p polarized 3-dimension (3D)monitor with a resolution power of 1920×1080 and refresh frequency of 120 Hz,and 3D polarized glass.A cerebral visual functions evaluation system invented by the National Engineering Research Center for Healthcare Devices was used.The stimulating template was generated by MATLAB.Subjects were asked to wear a 3D glass under their best corrected visual acuity.The tested room was in natural light.And subjects’ eyes were in same height with the middle of the screen (Figure 1).
PerceptualEyePositionPerceptual eye position(PEP)is measured under dichoptic vision and it reflects the deviation of the perceptual position (what we felt)from actual position.In the meantime,PEP is the reflection of the visual cortex’s separation control on the eye position under dichoptic vision.The larger deviation of PEP,the worse the ability of the visual cortex to control the eye position[23-24].

Figure 1 Picture above showed one non-anisometropia subject examining the cerebral visual functions on polarized monitor with polarized glass (under the best corrected visual acuity).
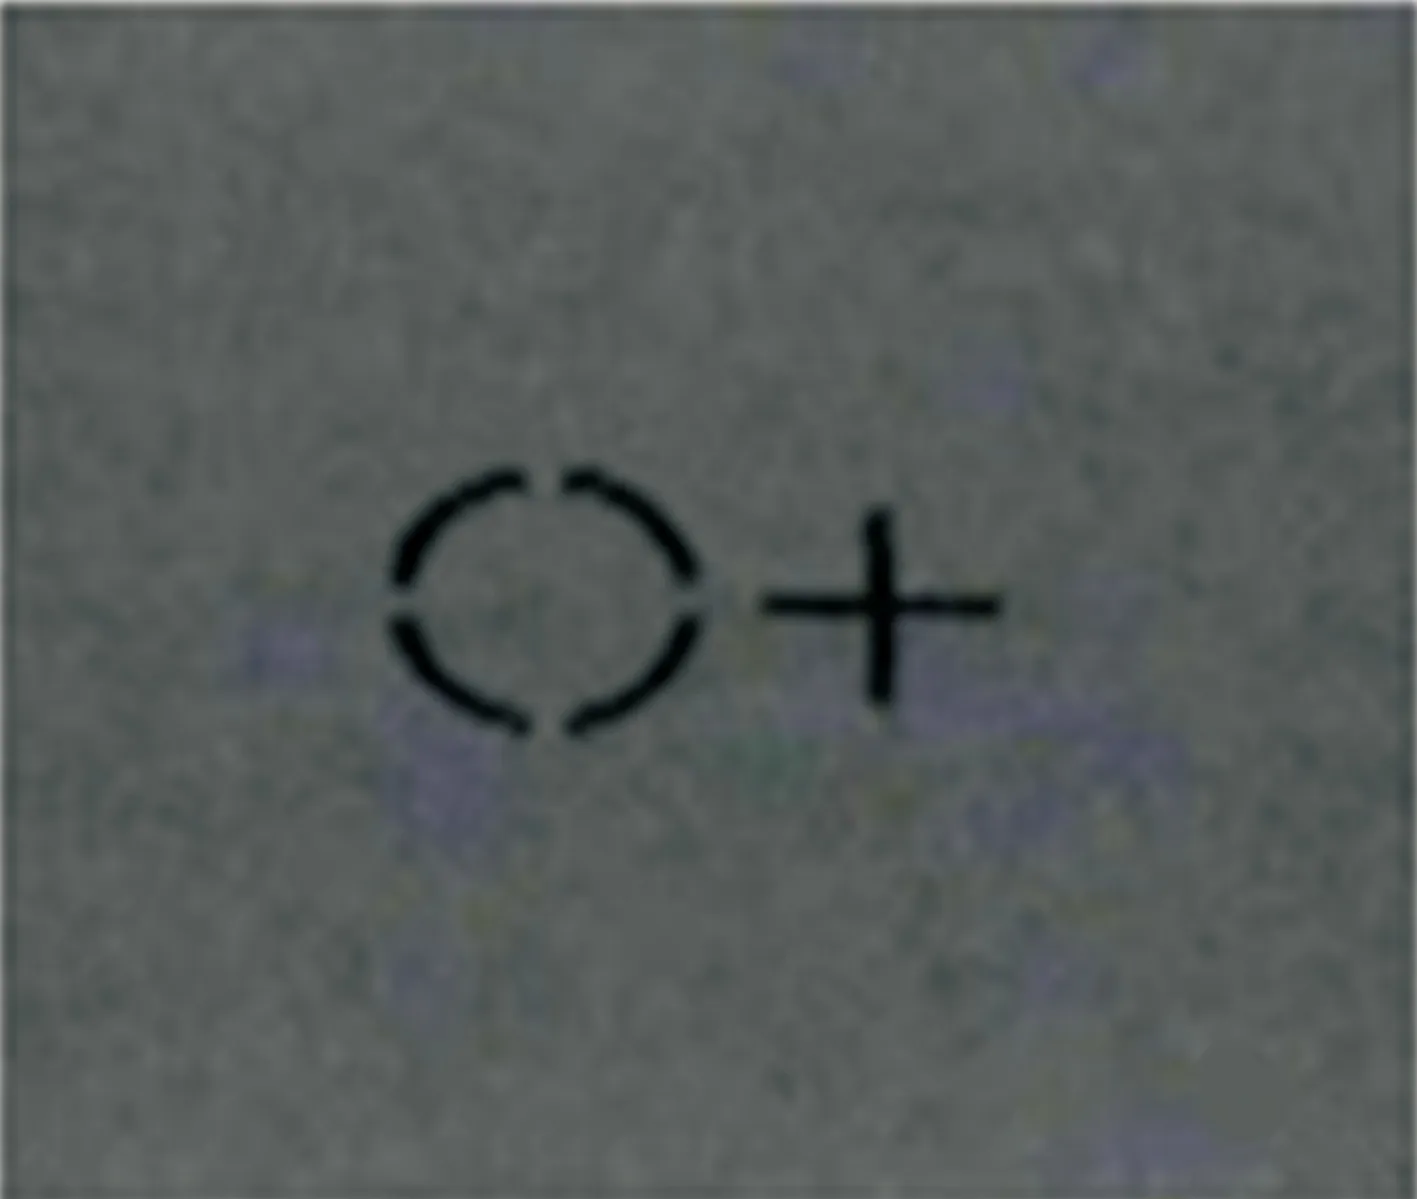
Figure 2 Picture above showed example of the PEP test Subjects were able to see a cross with their left eye and a circle in right eye.
In the test of PEP,subjects were seated 80 cm away from the polarized monitor.As it’s shown in Figure 2,subjects would see a circle in left eye,which was fixed at the middle of the screen,while the right eye was given a “cross”,which could be moved freely by computer mouse.Then,subjects were asked to put the “cross” into the middle of the circle.The stimulating templates were as follows:The average light source of 80 cd/m2in white,attenuating to 50 cd/m2when wearing 3D polarized glasses,and 30 cd/m2in black,attenuating to 3 cd/m2when wearing 3D polarized glasses.The stimulating template was 51×29 cm in size and 38×18° in visual angle.The size of the circle was 0.4°×0.4°,whereas the size of the cross was 0.33°×0.33°.This test was repeated twice and then computer would automatically calculate the mean horizontal and vertical bias pixels to reveal the deviation of horizontal and vertical PEP (1 pixel equals to 0.04△[23]).
FixationStabilityFixation stability is the ability that both eyes obtain a steady fixation direction.And it is the reflection of fixation eye movements,which are mainly consist of saccade and mircossaccade eye movements[25].Most researches about fixation stability used the eye tracker to track the objective eye movements for further analysis[26-27].Fixation stability involved in our study was tested under perceptual state,which is more suitable and easier in assessing cerebral visual functions when compared to eye trackers.

Figure 3 Picture above showed example of zero-order test (in the view without 3D polarized glass)With 3D polarized glass and monitor,normal subjects would observe a stereo “E” with different orientations.
Identical program and viewing distance used in PEP test were used for fixation stability test.At the beginning,the cross would be moved into the middle of the circle by the operator,then,subjects must describe and depict the state of the circle and cross in their views.
StereoTestsOne hand,stereo tests can be divided into near and far stereo tests according to the viewing distance.Researches had confirmed that the damage of far stereoacuity was much more sensitive in subjects with strabismus[21,28-30].On the other hand,stereoacuity can be divided into three orders of depth (including zero-order depth,first-order depth and second-order depth)[22].As it has been proved,zero-order depth is related to the position in depth of an object[31].And the damage of zero-order depth is much more serious and sensitive than the other orders of depth in subjects with amblyopia or strabismus[21,28-30].
So,in our study,stereoacuity was tested by classical stereo tests and 3D random-dot tests for zero-order (hereinafter to be referred as zero-order test).Classical stereo tests include Titmus and synoptophore stereo tests.Zero-order tests were tested respectively at 0.8 m and 1.5 m viewing distances.Both 0.8 m zero-order test and Titmus stereo acuity test represented the near stereoacuity,while the 1.5 m zero-order test and synoptophore stereo test were behalf of the far stereoacuity.
Zero-order test was showed in Figure 3.Among trails,subjects would observe an “E” with different directions in the center of the grey background compromised by random and stationary dots.
Stimulating templates of this test were as follows:grey background (average light source was 54 cd/m2)extended 5°×5°,visual stimulus presented in the middle of the grey background was an “E”,which was 4°×4° in visual angle.The random dots in the background were non-zero parallax.And the visual stimulus in each trail were respectively 400s of arc,300s of arc,200s of arc and 100s of arc.
Each subject was asked to discriminate the directions of the “E” in each trail.When subjects failed to recognize the indicated one,the higher seconds of arc should be recorded.
StatisticalAnalysesSPSS of version 23.0 was used to analyze the data.We chose One-Way ANOVA to analyze PEP bias pixels.The rates of normal individuals in fixation stability and stereoacuity tests were analyzed byχ2test.The correlation between fixation stability and stereoacuity was evaluated by
Table1Summarydemographicsofpatientsinthestudy

ParametersNon-anisometropiaAnisometropiaControlPNumbersofpatients603030Gender(M∶F)27∶3313∶1715∶150.69aAverageages9.7±2.210.7±2.19.0±3.60.055b
aUsingχ2test;bANOVA:One-Way analysis of variance.
Table2Resultsofcerebralvisualfunctionsineachgroup
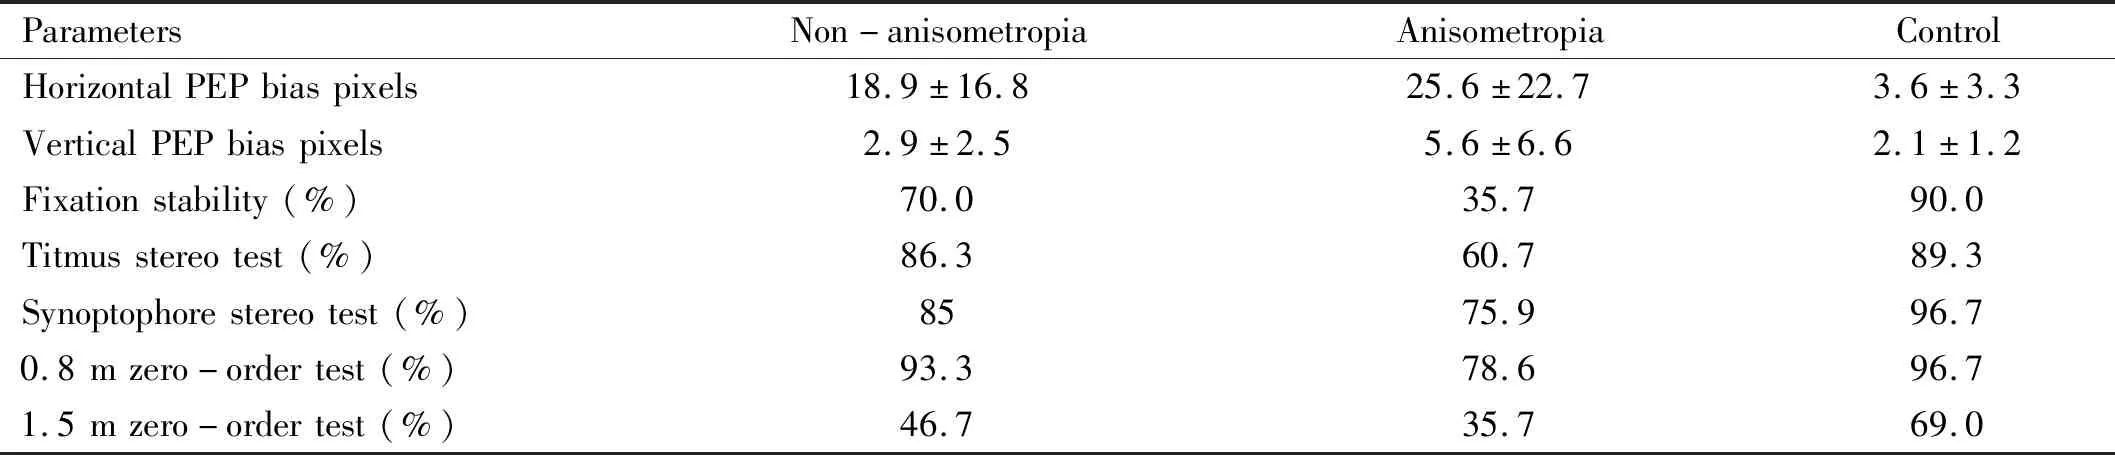
ParametersNon-anisometropiaAnisometropiaControlHorizontalPEPbiaspixels18.9±16.825.6±22.73.6±3.3VerticalPEPbiaspixels2.9±2.55.6±6.62.1±1.2Fixationstability(%)70.035.790.0Titmusstereotest(%)86.360.789.3Synoptophorestereotest(%)8575.996.70.8mzero-ordertest(%)93.378.696.71.5mzero-ordertest(%)46.735.769.0
Spearman rank-order correlation (P<0.05 was considered statistically significant).
Written informed consents were obtained from all subjects’ parents or legal guardians after the experimental procedures had been fully explained to them.Our study was performed according to tenets of the Declaration of Helsinki for medical research involving human subjects.
RESULTS
The summary demographics of patients in our study were showed in Table 1.And Table 2 showed the results of cerebral visual functions in each group.The non-anisometropia group comprised 60 subjects (33 females and 27 males)with a mean age of 9.72±2.22 years old.The anisometropia group was made up of 30 subjects (17 females and 13 males),whose average age was 10.68±2.10 years old.Thirty normal sighted subjects (15 females and 15 males)whose mean age was 9.00±3.61 years old was included in the control group.Mean interocular difference of spherical equivalent (spherical value plus half of the cylindrical value)among groups were as follows:non-anisometropia group was 0.3±0.2 diopters,anisometropia group was 1.6±0.9 diopters and control group was 0.1±0.2 diopters.
PerceptualEyePositionThe normal reference bias pixels for horizontal PEP is no more than eight,and for vertical PEP,it is less than four.
The examples of PEP test in normal and abnormal subjects were showed in Figure 4.And results of horizontal and vertical PEP bias pixels were showed in Figure 5.The results between non-anisometropia group and control group,anisometropia group and control group were statistically different (P<0.05).And the difference between non-anisometropia and anisometropia group was not sufficiently significant (P=0.530).
The vertical PEP bias pixels showed that there was significant difference between anisometropia and control group (P=0.033).The differences between non-anisometropia and anisometropia group (P=0.121),non-anisometropia and control group (P=0.236)were not statistically significant.

Figure 4 A:The results of normal subjects in PEP test.Subjects with normal PEP were able to move the cross into the middle of the circle;B:The result of one subject with abnormal PEP.Subjects with abnormal PEP would fail to move the cross into the middle of the circle while they thought they did.

Figure 5 Bar graph showed the average horizontal and vertical bias pixels of each groups.Error bars showed the standard deviation (SD).
FixationStabilityAs it was in subjects with stable fixation,the cross and the circle would stay static.If subjects replied that the cross or circle were not static,they were thought to have instable fixation.In our study,some subjects replied that the cross was slowly drifting or shaking along horizontal or vertical directions in certain areas (Figure 6).
The results of fixation stabilitytest (Figure 7)among three groups showed that anisometropia group and control group (χ2=18.478,P=0.000),non-anisometropia group and control group (χ2=4.472,P=0.034),as well as the difference between non-anisometropia group and anisometropia group (χ2=9.284,P=0.002)were significant different.

Figure 6 Picture above depicted the moving trace (cross)of one subject with instable fixation The green dots represented the center of the cross,and the red lines depicted the moving trace of the cross.

Figure 7 Bar graph showed the percentages of subject with stable fixation.
TitmusStereoTestAs it universally acknowledged,the normal result of Titmus stereo test should be less than 60s of arc.The results of Titmus stereo test revealed that anisometropia and control group (χ2=6.095,P=0.029),non-anisometropia and anisometropia group (χ2=6.712,P=0.013)had significant difference.Difference between non-anisometropia and control group was not significant (χ2=0.148,P=1.000).
0.8mZero-orderTestWhen tested at 0.8 m,normal results should be 100s of arc.Others would be abnormal results.The results of anisometropia and control group had significant difference in 0.8 m zero-order test (χ2=4.469,P=0.048),while differences between non-anisometropia and control group (χ2=0.424,P=0.661),non-anisometropia and anisometropia group (χ2=4.130,P=0.068)were not significant.
SynoptophoreStereoTestThe results of non-anisometropia and anisometropia group (χ2=1.107,P=0.378),non-anisometropia and control group (χ2=2.756,P=0.155)in synoptophore stereo test were not significantly different.Only difference between anisometropia and control group was significant (χ2=5.445,P=0.026).

1.5mZero-orderTestWhen tested at 1.5 m,100 or 200s of arc are normal results.The results of non-anisometropia and control group (χ2=4.390,P=0.045),anisometropia and control group(χ2=6.318,P=0.017)wereFigure8Bargraphshowedthepercentageofnormalsubjectsinnearandfarstereoacuitytestswithingroups.

Figure 9 Correlation between fixation stability and near stereoacuity was showed above When the subjects showed instable fixation,subjects tend to show abnormal results in near stereoacuity tests (Titmus and 0.8 m zero-order test).
significantly different in 1.5 m zero-order test,while non-anisometropia and anisometropia group had no statistical difference (χ2=0.933,P=0.364).The results in each stereoacuity test were showed in Figure 8.
CorrelationBetweenFixationStabilityandNearStereoacuityThe correlation between fixation stability and Titmus stereoacuity was weak and positive (r=0.300,P=0.002).And the results for fixation stability and 0.8 m zero-order test were in consistent (r=0.265,P=0.003).Both Titmus and 0.8 m zero-order test were near stereo tests,suggesting that there was a weak and positive relationship between fixation stability and near stereoacuity (Figure 9).
DISCUSSION
This study set out with the aim of evaluating the cerebral visual functions between low myopic and normal individuals.So as to further explore whether there is a defect of cerebral visual functions in low myopia.When compared to normal individuals,low myopic adolescents exhibited larger vertical perceptual eye position,fixation instability as well as worse stereoacuity.And such defects of cerebral visual functions were much more obvious in anisometropia group.
ThePerceptualEyePositionAll 120 subjects involved in our study,including control group,all had normal apparent eye position.However,few subjects in control group still showed larger horizontal bias pixels.Thus,we infer that PEP is not entirely equal to apparent eye position and PEP maybe more sensitive than apparent eye position.This might because that PEP,on one hand,is the eye position under perceptual state,which is different from apparent eye position.So individuals with normal apparent eye position could show some defects in PEP.On the other hand,in terms of units of measurements,PEP test is more accurate than apparent eye position (1 pixel equals to 0.04△).
Results from our study demonstrated that average horizontal PEP was larger in low myopia (with or without anisometropia)than that in normal subjects,indicating that low myopia exhibit defects in horizontal PEP.In accordance with our result,previous studies[24,32]have demonstrated that PEP was more sensitive than apparent eye position in low myopia as well as certain diseases that affected visual cortex (such as amblyopia and anisometropia).
FixationStabilityThe present study proved that low myopic subjects had more trouble in maintaining their fixation stability.This result corroborated the findings of a great deal of the previous work,in which,the abnormal concentration of GABA[12],lower ocular rigidity[26,33]and blur visual input[27]would affect fixation stability through saccade and mircosaccade eye movements[25].
StereoacuityStereoacuity,which was deteriorated in certain diseases (such as strabismus,amblyopia,anisometropia and even myopia),was also proved to play an important role in evaluating one’s cerebral visual functions[21].
InfluenceofViewingDistanceonStereoacuityOur results from near stereoacuity (Titmus and synoptophore stereo test)were in consistent,which all demonstrated that the near stereoacuity of anisometropia were damaged.The greater interocular disparity caused by anisometropia were responsible for worse near stereoacuity.
Contrary to near stereoacuity,the results of far stereoacuity (synoptophore stereo test and zero-order test at 1.5 m)were slightly different.In synoptophore stereo test,only anisometropia showed defects.Surprisingly,in zero-order test at 1.5 m,both anisometropia and non-anisometropia groups had higher seconds of arc.We assumed that synoptophore stereo test might have monocular clues,resulting higher false positive rate.Zero-order test at 1.5 m,however,avoids such possibility by using random dots.So,compared to synoptophore stereo test,zero-order test at 1.5 m has higher accuracy in evaluating far stereoacuity.And the most obvious finding to emerge from the analysis is that far stereoacuity of low myopia is more or less damaged.
Consistent with the literature[21,28-30],the observed difference between near and far stereoacuity in our study proved that far stereoacuity deteriorated much earlier than near stereoacuity.The reasonable explanations might include that the accommodative convergence varies with the distance and the control of their brains are decreased while distance increased[34].Moreover,stereoacuity would improve while the viewing distance increased[31].
The relationship between stereoacuity and fixation stability according to the data in our study,we can infer that there was weak and positive correlation between near stereoacuity and fixation stability.Our result slightly differed from the previous study[35],in which the correlation was strong and positive.Different kinds of participants were likely to be responsible for it.Despite such difference,there are similarities between the attitudes expressed in our study and those described in previous study.Both studies came to same conclusion that individuals with unstable fixation tend to have worse stereoacuity.The reason for such relatively correlation is not certain.It is a widely held view that fixation stability can contribute to the ability of detail recognition and preventing the image fade on retinal.Factors mentioned above are responsible for further shaping stereoacuity[36].Hence,it could conceivably be hypothesized that individuals with unstable fixation tend to have worse stereoacuity,which supports our result.
Besides,there are three likely causes which corroborate our findings for the worse far stereoacuity in low myopia.First,the increased inter noise within low myopia may have a significant key role in limiting their stereoacuity[37].Secondly,stereoacuity would deteriorate with the decrease of contrast sensitivity[31,38],which is proved to be decreased in myopia[39-40].Last but not the least,as recent case reported[35],fixation instability demonstrated in our study would in return preclude the form of stereoacuity in low myopia.
We examined and compared the cerebral visual functions among low myopic subjects (with or without anisometropia)and normal individuals in this research.In view of the findings emerging from our study,which indicates that early,low myopic adolescents have certain defects in cerebral visual functions even after corrected to their best visual acuity,we may try to find a way to restore it.
Examinations used in our study were proved to be useful in assessing cerebral visual functions.Thus,they were expected to provide effective indicators in follow-up evaluation and solid foundation for further specific treatments in treating defects of cerebral visual functions.
So far,local retinal environment has been the focus of the development in myopia.Take our results into account,it could conceivably be hypothesized that visual cortex might be an important factor in the development of myopia.Hence,researchers might pay more attention on it in the near future.
This study was a cross-sectional study that focused on the evaluation of cerebral visual functions in low myopia.We didn’t conduct this experiment with specific classification on the onset time and the degree of myopia.
Myopic individuals,including moderate and high myopia,with different onset times should be tested in the next steps,in order to fully investigate the correlation between myopia and cerebral visual functions.
