Evaluation and Simulation Verification of Thermal Insulation Property of Fiber Fabric Materials in Space Environment
2019-12-16LUOCaiYunYANGLiPingTAOYeZHONGQiuLIHuiDong
LUO Cai-Yun, YANG Li-Ping, TAO Ye, ZHONG Qiu, LI Hui-Dong
Evaluation and Simulation Verification of Thermal Insulation Property of Fiber Fabric Materials in Space Environment
LUO Cai-Yun, YANG Li-Ping, TAO Ye, ZHONG Qiu, LI Hui-Dong
(Analysis and Testing Center for Inorganic Materials, Shanghai Institute of Ceramics, Chinese Academy of Sciences, Shanghai 201899, China)
Equivalent experimental conditions to those in space were used to characterize the effective thermal conductivity of the fiber fabric insulation used in the multilayer insulation system of the material preparation furnace loaded on Tiangong-2 Space Station. By evaluating the material following variations in the on-orbit temperature and on-track pressure, the microscopic heat transfer mechanism was studied. The furnace internal temperature field under different working conditions was also simulated according to the characterization results, and the data reliability was verified. The results showed that the effective thermal conductivity of the fiber fabric increases non-linearly with rising temperature; moreover, with lower pressures, the growth trends are gentler. With a pressure drop, the results present the trend of a decaying exponential function with a critical pressure value. Radiation and gas phase heat conduction are the main factors affecting the heat transfer of the fiber fabric under the microgravity environment. Simulation results of the temperature field demonstrate that the temperature field distribution trend matches well with that of the measured results. The maximum calculation error of the furnace center is 1.3% of the measured temperature. This method can be used to evaluate the thermal insulation performance of the multilayer fiber material close to the practical working conditions more reasonably, and also to improve the accuracy of thermal simulation prediction models.
space microgravity environment; fiber fabric insulation material; effective thermal conductivity; steady-state heat flow meter method; temperature field simulation
In microgravity environments, the adverse factors such as floatation, convection, precipitation, and static pressure changes which affect the growth and quality of materials are inhibited at the ground level. Therefore, the space environment has ideal conditions for growing high-performance crystals and ceramics[1-5]. The space material furnace discussed herein is a comprehensive experimental device for material preparation that is operated under conditions of microgravity. The multilayer insulation system of the furnace adopts a composite structure comprising a metal reflective layer and glass fiber insulation layer that can maintain its integrity when subjected to the characteristic conditions of a high vacuum, large temperature gradient, and strong radiation. To meet the requirements for preparing high-quality materials, it is necessary to simulate the temperature field distribution, temperature field stability, and influence of the sample itself on the temperature field under different working conditions, and thus optimize the thermal environment inside the furnace and match the practical working conditions of space as much as possible. In this process, the thermal conductivity of the fiber insulation material next to the heating factor of the test furnace is the key calculation parameter, and its accuracy directly affects the consistency of the temperature field simulations, which in turn affects the scientific validity of the simulation calculations for the whole insulation system.
Numerous studies have already been conducted on the thermal insulation properties of fiber materials in aerospace multilayer insulation systems, including test methods as well as analysis of the heat transfer property with the microstructure modeling theory[6-9]. However, due to the structural complexity of the fiber materials, various internal heat transfer methods coexist. Consequently, the factors affecting the thermal insulation performance of the materials are also complex and diverse[10-11], especially in aerospace applications where the thermal conductivity of fiber materials changes with pressure. Moreover, the different volume densities in different assembly modes can cause differences in the thermal insulation performance[12]. Therefore, in the application of space engineering simulations, the use of theoretical data or thermal conductivity values under general conditions often leads to a large deviation of the calculated data from the actual situation, thus making it difficult to obtain an accurate simulation model.
For more accurate simulation of the thermal performance of the material preparation furnace loaded on Tiangong-2 Space Station under various working conditions, this study examined different pressures and temperatures similar to those of space trajectories under equivalent experimental conditions and used the steady-state heat flow method to measure the effective thermal conductivity of the multilayer fiber fabric in the furnace insulation system. The measurement results were analyzed from the perspective of the microscopic heat transfer mechanism. Subsequently, simulations of the furnace temperature field were conducted, and the results were compared with the measured temperature. It was found that the simulated data fitted the measured data well.
1 Materials and methods
1.1 Test material
The test material was high silica glass fiber cloth. The scanning electron microscopy (SEM) image of the morphological structure of the fiber fabric is shown in Fig. 1. The material had a plain weave with an areal density of 240 g/m2and a single layer thickness of ~0.26 mm. Fig. 2 illustrates the usage of the fiber cloth in the furnace. The fiber cloth was stacked in multiple layers and filled into a cylindrical shape next to the innermost layer of the furnace lining. The inner diameter of the filling space was 50 mm, outer diameter, 74 mm, and overall bulk density of the fiber fabric after filling, ~0.9 g/cm3. In order to match the volume density of the actual working conditions as much as possible, the test sample was pressurized to a thickness of 20 mm for 84 layers, with an approximate volume density of 0.93 g/cm3.
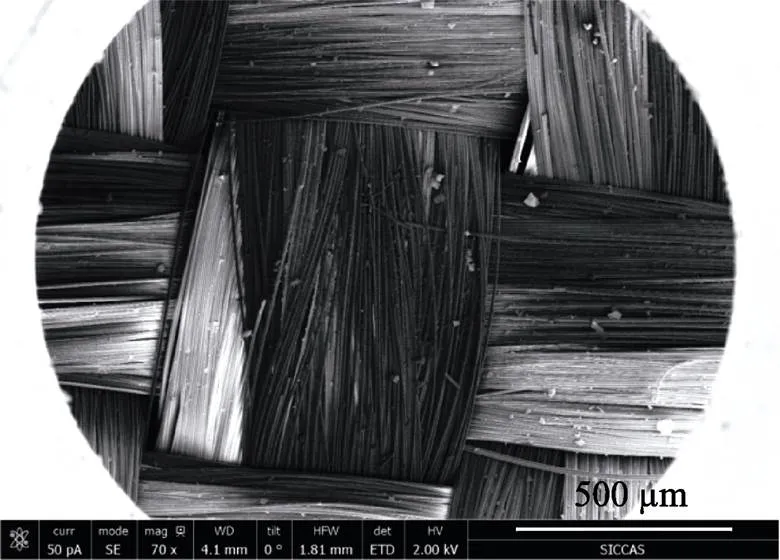
Fig. 1 SEM image showing the surface morphology of the fiber fabric
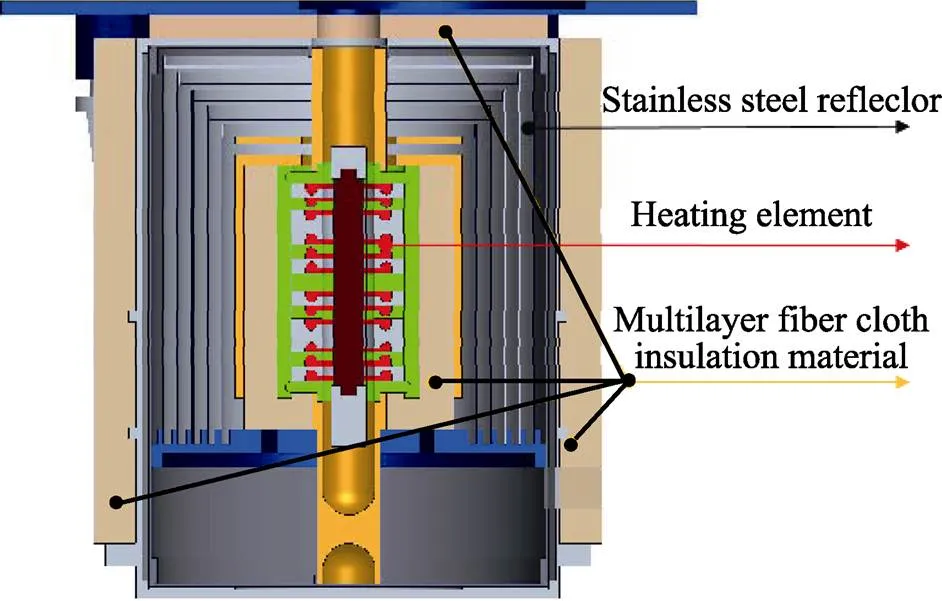
Fig. 2 Application of fiber fabric in the space material furnace
1.2 Test principle and test device
Considering the anisotropy of the thermal conductivity of fiber fabrics, the one-dimensional steady-state heat flow meter test method based on Fourier’s law[13]was employed to measure the effective thermal conductivity of the fabric in the thickness direction.
One-dimensional stable heat passes through an infinite plate sample from the top to bottom (Fig. 3). After reaching thermal equilibrium, the thermal conductivity along the thickness direction of the sample can be calculated as Eq. (1):
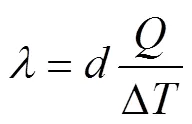
The test device employed in this study (Fig. 4) was a typical heat flow test device designed in accordance with GB/T10295-2008[14]. To meet the needs of space environment measurements, some improvements to the structure were made relative to a general-purpose device. Specifically, a sample vacuum chamber was added, in which the pressure could be controlled from 10 Pa to atmospheric pressure. Additionally, the heating plate underwent partition heating instead of the conventional integral heating. A silicon carbide heat-uniform plate was also added between the heating plate and the sample. Information on the heat flux was collected by a thin film heat flow meter (thickness<1 mm). These improvements ensured that the sample was always in the one-dimensional stable temperature field during testing, and the measurement uncertainty of the entire device was ±5%[15].

Fig. 3 Principle of steady-state heat flow meter test
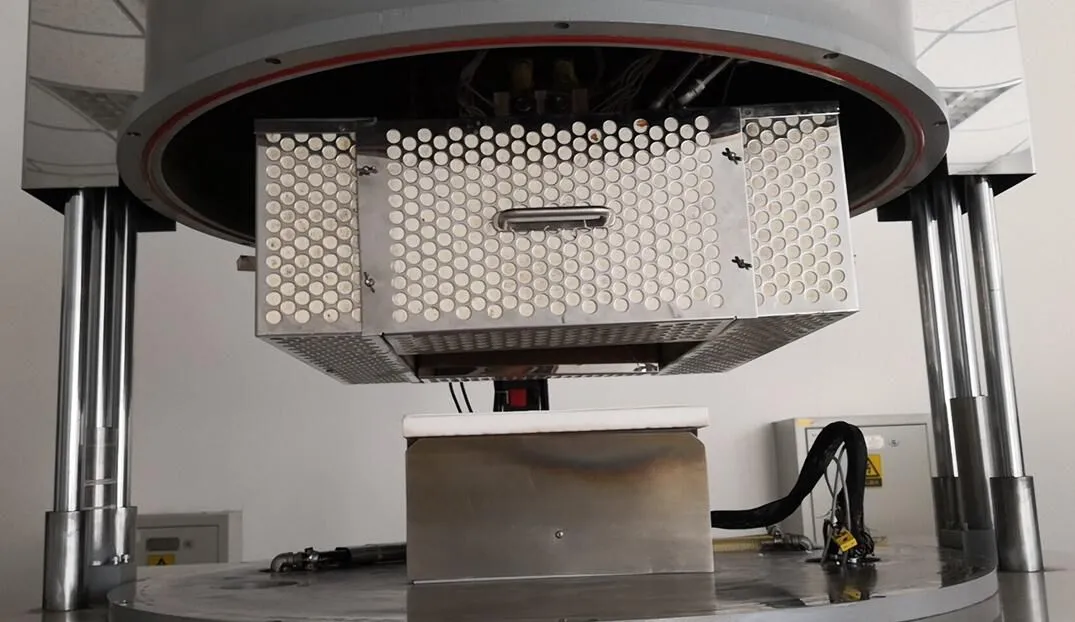
Fig. 4 Vacuum heat flow meter with the high-temperature thermal conductivity instrument
1.3 Equivalent environmental test conditions
According to the realistic pressures and temperatures experienced by the furnace on different trajectories in space, the thermal conductivity was measured at temperatures from 373 K to 873 K in 100 K increments, and under pressures that gradually decreased from atmospheric pressure to 0.02 kPa. First, the thermal conductivity of each temperature point was tested under atmospheric pressure.Subsequently, the sample chamber was vacuumized to the next target pressure, following which the testing steps for thermal conductivity were repeated at each temperature point, until the entire target pressure interval was tested.
2 Results and discussion
2.1 Effective thermal conductivity changes with temperature
Fig. 5 shows that with increasing temperature, the effective thermal conductivity of the fiber cloth increased non-linearly, and the growth rate increased. The increase for the former varied from 34% to 83% with different pressures. At different temperatures, the decrease in thermal conductivity with pressure concentrated between 74% and 79%. At lower pressures, the effective thermal conductivity was smaller, and the trend with increasing temperature was also slower. The effective thermal conductivity was maximum at atmospheric pressure and minimum at 0.02 kPa, with increase rates of 47% and 83%, respectively, with increasing temperature. Thus, the thermal conductivity of the fiber fabric was more sensitive to the change in the vacuum than the temperature.

Fig. 5 Effective thermal conductivity changes with different temperatures
2.2 Effective thermal conductivity changes with pressure
Fig. 6 shows that the thermal conductivity decreased with decreasing pressure from the atmospheric pressure
to 50 kPa.However, the decrease was not obvious: in the 10–50 kPa interval, the thermal conductivity showed a significant decrease of 12%–17% with decreasing pressure. As the pressure was further reduced from 10 kPa, the thermal conductivity began to decrease sharply, and by 0.02 kPa, the drop was 68%–77%. Thus, in practical applications, the pressure needs to be <10 kPa to realize more effective insulation effects of the fabrics. Furthermore for >473 K, with decreasing temperature, the thermal conductivity decreased at a higher rate than that for <473 K, because of the more obvious radiation effects on the effective thermal conductivity in the high-temperature section.
2.3 Microscopic heat transfer mechanism analysis
Multilayer fiber insulation materials have complex internal heat transfer mechanisms, which mainly involves conduction, radiation and convection. The convection heat transfer contribution is small enough to be negligible when the density of the fiber fabric is greater than 20 kg/m3[16-17]. At room temperature ((25±5) ℃) and atmospheric pressure, the heat transfer of the fiber fabric mainly involves solid-phase and gas-phase heat conduction. Solid-phase heat conduction occurs through contact of the fiber filaments, and gas-phase heat conduction occursthe free movement of gas molecules in the fiber space as well as through collisions with each other.
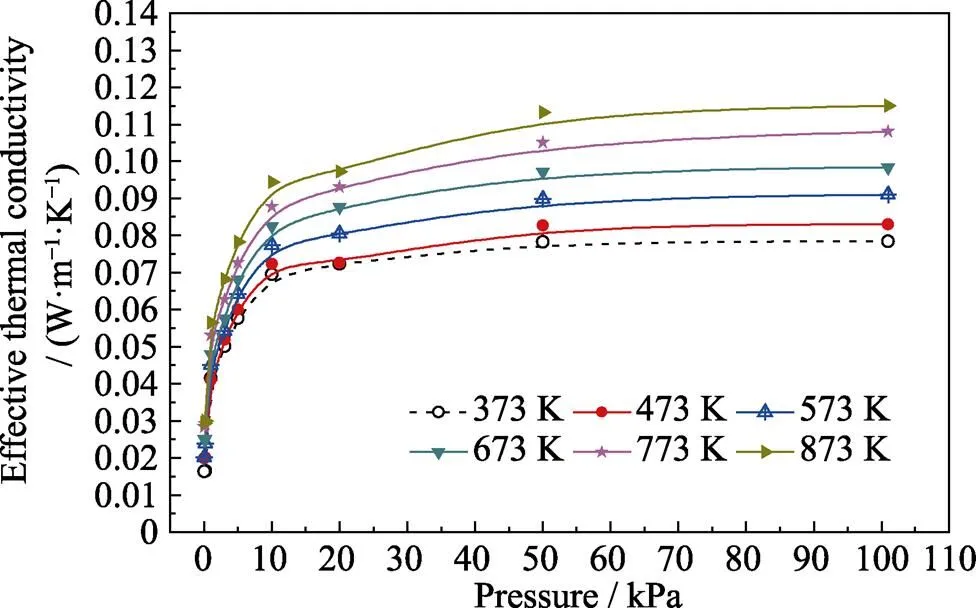
Fig. 6 Effective thermal conductivity changes with different pressures
As the temperature increased in this study, the thermal conductivity of the quartz fiber and the internal gas phase began to increase. The SEM image (Fig. 7) of the fiber filament shows that the fiber has a microscale diameter, and the contact area between the filaments is small. Moreover, the fiber consists of 97% fused quartz, which has a low thermal conductivity. Thus, the effect of solid heat conduction was much smaller than that of the gas. As the temperature increased further, the radiation began to increase in proportion to the fourth power of the temperature. It then propagated through the interstitial spaces of the fibers and through the fibers themselves, which radiated again after absorption. The radiation effect was more obvious at higher temperatures. Therefore, the total effective thermal conductivity in Fig. 5 showed a trend of rapid increase with increasing temperature.
When the pressure decreases, the density of gas molecules in fiber voids is reduced and intermolecular collisions become slower, the free path of molecular motion also starts to lengthen, which reduces the gas-phase heat conduction. Therefore, with lower pressures, the coupling effective thermal conductivity becomes smaller; consequently, the growth rate is lower with increasing temperatures. In conclusion, the results of this study showed that the changes in the temperature and pressure not only affected the thermal conductivity of each heat transfer factor, but also changed their proportion during heat transfer.
Fig. 6 shows a critical pressure of 10 kPa, which relates to the temperature, pressure, and Knudsen number (ratio of the free path of gas molecules to the characteristic size of fiber void)[18-19]. When the pressure was lower than the critical point, the thermal conductivity of the residual gas rapidly reduced to a negligible value, and the effective thermal conductivity of the fiber fabric also decreased dramatically until only solid heat conduction and radiation remained. Subsequently, the total effective thermal conductivity approached a constant minimum value.

Fig. 7 SEM image showing the fiber filament morphology
3 Simulation verification of matching tests
3.1 Modeling calculations
To further verify the reliability of the characterization, FLUENT simulation software was used to calculate the temperature field in the furnace under two typical working conditions of atmospheric pressure and 3 kPa, and the results were compared with the ground-matched experimental data.
The calculation model for the furnace side profile is shown in Fig. 8, in which S1–S4 and K1–K14 represent the temperature measurement points at 18 different positions in the furnace. The internal heat transfer calculations considered the material heat conduction, radiation heat transfer, and interface thermal resistance between different materials and air flow, while the external calculations considered the influence of the external surface radiation and natural convection.
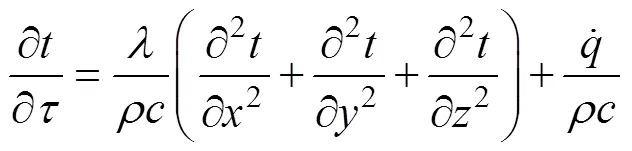
The heat conduction equation and the boundary and initial conditions were as Eq. (2)-(5):
External surface heat flux: (3)

The key calculation parameters are shown in Table 1. The thermal conductivity of the fiber cloth under the two working conditions was taken from the measured data in Table 1, and the external surface temperature was taken as the actual ambient temperature. For comparison, other calculation parameters were kept the same.
3.2 Simulation calculation results
Fig. 9 show the calculated values and measured values of each temperature measurement point after heating for 6 h at a constant power of 97 W at 101 kPa and 3 kPa on the ground.
As shown in Fig. 9, under atmospheric pressure, the difference between the calculated and measured temperature at K11, K12, and K13 was 10–20 K, and the others were controlled within 10 K. The maximum calculation error of the entire temperature field was 4.3% of the measured value, and that of the central position of the furnace was only 1.1%. At 3 kPa on the ground, the calculation deviation was within 50 K, and for the four temperature measurement points S1, S2, S3, and S4 in the furnace center, the deviation was controlled within 12 K. The maximum error of the entire temperature field was 9.7% of the experimental value, and that of the center position was only 1.3%. In summary, the simulation results for the temperature field distribution obtained using the above characterization results matched well with the measured data. In addition, at points closer to the central position of the furnace, the calculated values were close to the experimental values.

Table 1 Key parameters for the simulation calculations

Fig. 9 Comparison of the calculated data for the temperature field with the test data
(a) 101 kPa-ground; (b) 3 kPa-ground
The above deviations can be mainly attributed to the fact that the narrow hot channel formed by the thermocouple and the heating wire trace in practical applications cannot be fully considered. Therefore, errors caused by simplifying the calculation model are inevitable. Errors may occur during fiber cloth assembly, due to the temperature measurement point position, or variation in the heat shield radiance with temperature. Therefore, the measured and calculated values cannot be completely and accurately matched.
4 Conclusion
This study investigated the variation in the effective thermal conductivity of fiber fabric insulation material in the material preparation furnace loaded on Tiangong-2 Space Station with changing in-orbit temperature and pressure conditions, using the heat flow meter test method and environmental test conditions equivalent to those in space. The obtained results were utilized for calculating the temperature field in the furnace with a model. The following conclusions were drawn:
1) The effective thermal conductivity of the fiber fabric increased non-linearly with the temperature. The lower the pressure, the lower the rate of increase. With a pressure reduction, the thermal conductivity exhibited a single exponential decay function. When the pressure was less than 10 kPa, the effective thermal conductivity reduced sharply until a constant minimum was reached. The effective thermal conductivity of the fiber fabric was more sensitive to pressure changes than to temperature changes.
2) The maximum error in the calculated values was 4.3% and 9.7% of the measured temperature under atmospheric pressure conditions and at 3 kPa, respectively. The main reasons for the difference between the two values were unavoidable factors such as the use of a simplified model. Nevertheless, the entire temperature field distribution matched well with the experimental data, and positions closer to the center of the furnace showed better matches.
3) The equivalent environmental characterization method was thus shown to be capable of reflecting the thermal performance of fiber fabric materials more closely under different working conditions, which theoretically could enable improvements in the performance of multilayer insulation systems and provide more accurate thermal simulation models. Furthermore, this method can be referenced for developing other thermal designs used in aerospace engineering.
[1] CHEN YAN, BAO YEFENG, LI XIAOYA,Space growth of bismuth telluride based thermoelectric semiconductive crystals., 2016, 36(4): 413–419.
[2] FENG SHAOBO, LUO XINGHONG. Dendrite growth of SRR99 nickel-base single crystal superalloy under microgravity condition formed by long drop tube., 2012, 36(3): 341–346.
[3] ZOU XIA, LI GUORONG, TAN YUANQIANG,Discrete element method modeling of the influence of gravity during functional ceramics material compaction process., 2010, 25(10): 1071–1075.
[4] ZHOU YANFEI, TANG LIANAN, AI FEI,. Crystal growth of bismuth silicon oxide(BSO) in space.2003, 18(1): 211–214.
[5] PEREZ-GRANDE I, RIVAS D, DE PABLO V. A global thermal analysis of multizone resistance furnaces with specular and diffuse samples., 2002, 246(1): 37–54.
[6] WANG G H, ZHANG F, SUN X K,Optimized design of multilayer thermal insulations for hypersonic vehicles., 2016, 697: 449–452.
[7] JI T, ZHANG R, SUNDEN B,Investigation on thermal performance of high temperature multilayer insulations for hypersonic vehicles under aerodynamic heating condition., 2014, 70(1): 957–965.
[8] KAMRAN DARYABEIGI. Effective Thermal Conductivity of High Temperature Insulations for Reusable Launch Vehicles. NASA/TM-1999-208972, 1999: 1–30.
[9] MACHADO, ARAUJO H. Modeling heat transfer with micro- scale natural convection in fibrous insulation., 2014, 36(4): 847–857.
[10] KWON J S, JANG C H, JUNG H,Effective thermal conductivity of various filling materials for vacuum insulation panels., 2009, 52(23/24): 5525–5532.
[11] HUANG C, ZHANG Y. Calculation of high-temperature insulation parameters and heat transfer behaviors of multilayer insulation by inverse problems method., 2014, 27(4): 791–796.
[12] GRINCHUK P S. Contact heat conductivity under conditions of high-temperature heat transfer in fibrous heat-insulating materials., 2014, 87(2): 481–488.
[13] XI TONG-GENG. Thermophysical of Inorganic Materials. Shanghai: Shanghai Scientific & Technical Publishers. 1981: 123–156.
[14] Thermal insulation-determination of steady-state thermal resistance and related properties-heat flow meter apparatus. GB/T 10295- 2008.
[15] XIN CHUNSUO, HE XIAOWA. Research of improving surface temperature uniformity of low thermal conductance materials., 2013, 33(06): 31–35.
[16] CUNNINGTON G R, MILLER S D, DARYABEIGI K. Heat transfer in high-temperature multilayer insulation., 2006, 631(631): 43.
[17] SPINNLERM, WINTER E R F, VISKANTA R. Studies on high- temperature multilayer thermal insulations., 2004, 47(6): 1305–1312.
[18] HUAI XIULAN, WANG WEIWEI, LI ZHIGANG. Analysis of the effective thermal conductivity of fractal porous media., 2007, 27(17/18): 2815–2821.
[19] KAN ANKANG, ZHANG TINGTING, LOU HAIJUN. Fractal study of effective thermal conductivity of fiber glass materials., 2013, 33(7): 654–660.
空间环境下纤维织物绝热材料隔热性能评价与仿真验证
雒彩云, 杨莉萍, 陶冶, 钟秋, 李会东
(中国科学院 上海硅酸盐研究所,无机材料分析测试中心, 上海 201899)
本文以天宫二号空间材料炉多层隔热系统中纤维织物绝热材料为研究对象, 采用空间环境等效试验条件表征研究了织物有效导热系数随在轨温度和压强的变化, 结合微观传热机理对结果进行了分析, 根据表征结果对不同工况下炉内温度场进行了模拟。结果表明: 纤维织物有效导热系数随温度升高非线性增大, 压强越低, 增长越平缓; 随压强降低以指数函数趋势衰减且存在临界压强; 辐射与气相导热是影响空间环境下纤维织物传热性能的主要因素; 炉内温场计算值与匹配实验实测温度整体趋势吻合良好, 炉中心温度最大计算误差为实测温度的 1.3%。该方法更合理地评价了多层纤维材料在使用工况下的绝热性能, 从而有助于建立准确度更高的热仿真模型。
空间微重力环境; 纤维织物绝热材料; 有效导热系数; 稳态热流计法; 温场仿真
O482
A
date:2019-03-14;
Modified date: 2019-05-15
China’s Manned Space Station Project (TGJZ800-2-RW024); National Natural Science Foundation of China (51606209); Shanghai Technical Platform for Testing and Characterization on Inorganic Materials (14DZ2292900)
LUO Cai-Yun(1983–), female, engineer. E-mail:lcyun1010@163.com
Corresponding author:YANG Li-Ping, professor. E-mail: lpyang@mail.sic.ac.cn
1000-324X(2019)11-1238-07
10.15541/jim20190110
猜你喜欢
杂志排行

无机材料学报的其它文章
- Platinum Decorated Titanium Dioxide Nanosheets for Efficient Photoelectrocatalytic Hydrogen Evolution Reaction
- MoS2 Quantum Dots Decorated NH2-MIL-125 Heterojunction: Preparation and Visible Light Photocatalytic Performance
- 仿生超疏水表面的发展及其应用研究进展
- Synthesis of SiC@SiO2 Nanocables via a Catalyst-free Carbothermal Reduction Method
- Deposition Temperature and Heat Treatment on Silicon Nitride Coating Deposited by LPCVD
- 单基质白光LED荧光粉研究进展