Analytical Model of Temperature Field in Unsteady Stage of Friction Plug Welding
2019-12-03YANChongjingZHENGYongle
YAN Chongjing,ZHENG Yongle
1. College of Mechanical and Electrical Engineering,Nanjing University of Aeronautics and Astronautics,Nanjing 210016,P. R. China;
2. Shanghai Aircraft Design and Research Institute,Shanghai 201206,P. R. China
(Received 31 August 2018;revised 23 July 2019;accepted 25 September 2019)
Abstract: The temperature field in unsteady phase greatly affects the quality of friction plug welding(FPW). An analytical model is put forward to correlate the process parameters and the temperature field in unsteady phase of FPW. Applying the von Mises criterion for plastic deformation and linearizing the heat flux,the model is achieved by Laplace transformation. The predicated peak temperature and peak time agree with the experiment data,with errors of about 4% and 8%,of AA7075-T6 FPW.
Key words: friction plug welding(FPW); unsteady stage; temperature field; analytical model
0 Introduction
Friction welding utilizes the relative motion between the contact surfaces of the workpieces being welded to generate frictional heat and plastic deformation on the friction surface,and increases the temperature around the welding surface to 0.6—0.9Tm(melting point). Due to the high pressure and the plastic deformation at the interface, joint is achieved through atomic diffusion and recrystallization[1]. Friction plug welding(FPW),as a variation of friction welding,is a process of filling pre-drilled hole with a tapered plug. It can be used in defects removing of aluminum alloys and magnesium alloys.Thus it finds a wide application in aerospace manufacturing[2-4].
It is believed that the formation of welded joints mainly depends on the steady stage and the upset stage. At the same time,scholars focus on heat production and temperature field of the steady stage,which are independent with the friction time.Sellars and Tegart[5]proposed, and modified by Sheppard and Wright[6]subsequently,the constitutive equation of inverse hyperbolic sine function to model the plastic behavior in friction welding. To simplify the coupling of the temperature and the large strain rate in friction welding,methods[7-9]are proposed to get reliable constants. The equation is widely used to calculate the thickness of plastic region, average temperature and temperature profile[10-14].
However,experiments implying upset stage is not necessarily required for friction welding. Kimura et al.[15]even suggested that friction welding of carbon steel could be successfully conducted without a steady stage. In this point of view,the friction heat production in unsteady stage is critical to friction welding.
More complicated than the steady stage,the unsteady stage only accounts for 10%[16]of the total heat generation. Therefore,it is usually be simplified by Coulomb friction with a constant coefficient of friction[17-20]. Considering the sliding - sticking mechanism of the interface, a state variable δ,which denotes the extent of sticking,is introduced to solve the interfacial heat generation problem[21].However,the evolution of the variable δ is unknown,which results in the difficulty of calculating the temperature field.
This paper establishes a simple analytical model that can clearly reveal the relationship between the temperature field and the process parameters,and accurately describes the distribution of temperature during unsteady stage FPW. With the linearized heat flux and Laplace transformation,the established model can predicate the temperature field of the unsteady stage of FPW covering the process parameters including the rotational speed and the friction pressure. The model is evaluated by systematically comparing the calculated results with the experimental data of 7075-T6 aluminum alloy FPW.
1 Peak Temperature
The end of the unsteady stage is the moment when the material at interface is completely plasticized. After that the mechanism of the heat generation fundamentally changed from friction heat to plastic dissipation. Therefore,it is necessary to analyze the physical mechanism of the interface friction mechanism.
Referring to the plastic forming,plastic deformation occurs only when the equivalent stress of material exceeds the yield strength of material. Its expression is as follows

where σeand σs(T)are the effective stress and yield strength of the material at temperature T,respectively. As shown in Fig.1,the effective stress σecan be expressed as follows


Fig.1 Interface of FPW
where τ and P are the friction shear stress and the normal pressure at the interface,respectively. P =F/ [ π(-) ],in which F is the axial force.
Sliding dominates the heat generation before the material yields. Consequently,the friction shear stress is calculated as

Substituting Eq.(3)into Eq.(2),the effective stress σebecomes

Derived from the trilogy,the coefficient of friction in unsteady stage of friction welding can be expressed as[22]

where a,b,c and d are constants to be determined by regression,and vf= ω(Ru+Rb)/2 is friction velocity,here ω is the angular speed of the plug.
Hence the peak temperature is obtained by solving the combination of Eqs.(1),(4)and(5).
2 Analytical Model of Temperature Field
2. 1 Hypotheses
The analytical model is developed to simplify the mathematical description based on the following assumptions.
(1)During the FPW process,the rotational speed and the welding pressure(i.e. axial pressure)are considered to be a constant.
(2)Temperature gradient,stress,strain and width of the plastic region are uniform along the sheet thickness due to small thickness and taper angle.
(3)The weld region in the steady stage nearby the contact interface is divided into the plastic region and the elastic region,illustrated in Fig.2.
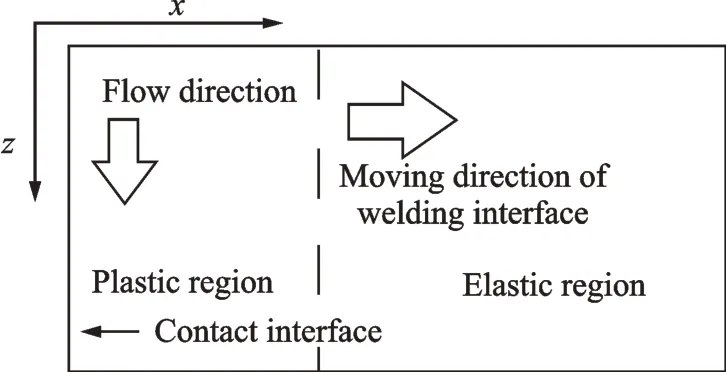
Fig.2 Weld regions
(4)Stress,strain rate,velocity of plastic flow are symmetric with respect to the interface because of the identical material and heat distribution on both sides.
(5)Convection and radiation are ignored.
(6)The visco-plastic material flow in the steady stage is considered as a non-Newtonian,incompressible laminar flow.
(7)Material properties are constant.
2. 2 Linearization of heat input power
Based on the first and the second hypotheses,it can be seen that the FPW process,whether the steady-state or the unsteady phase can be simplified as a 1D model problem.
In the Cartesian coordinate system,as shown in Fig.3,the contact interface,the plastic-elastic region interface,and the sheet end are set at x = 0,x = B and x = L,respectively. Figs.3(a,b)schematically illustrate the temperature and flow velocity profile,respectively.

Fig.3 Schematic illustration of temperature profil and flow velocity profile
The continuity equation for incompressible single-phase flow is given by[11]

where u is the velocity of plastic flow,i =1,representing the x direction in Fig. 3. The steady single phase momentum conservation equation is given by[11-12]

where j=2 or 3,representing y and z directions in Fig.3;ρ is the density,μ the non-Newtonian viscosity,vMthe moving velocity of welding interface,and p the pressure exerted on the plastic flow parallel to the flow direction.
During the FPW process,the moving velocity of welding interface vMis usually much less than the linear velocity of the rotating plug. Hence,vM,ux,and uyin Eq.(7)can be neglected[14]. So the equation is simplified to the following form

where u is uz. Using the Perzyna visco-plastic model[15],μ can be expressed as

where ε˙is the effective strain rate.
The effective strain rate is given by

Substituting Eqs.(9)and(10)into Eq.(8)and integrating Eq.(8) and combining with the boundary condition σe= τ(TB)at x=B,σecan be written as

For the material enduring high temperature and high strain rate,Sheppard and Wright[6]proposed a constitutive equation

where A,α and n are the material parameters,and Z is the Zener-Hollomon parameter,which is given by

where G is the universal gas constant,ΔH the activation energy,and T the Kelvin temperature.
An equation for u can be derived from Eq.(11),and taking Eqs.(12) and(13) into account,it is expressed as
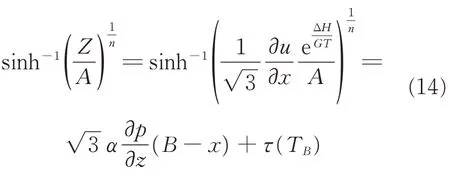
In order to solve the velocity u,Aukrust et al.[13]proposed a simplified method that the function sinh-1x is approximately equal to the logarithm function ln2x when x is larger than 1. Xiong,Qian et al.[10,12]stated that the requirement(Z/A)1/n≫1 is met during the plastic flow of friction stir welding(FSW)and continuous drive friction welding(CDFW). Thus it is reasonable to assume that the plastic flow region of FPW also satisfies the condition.Hence,Eq.(14)can be simplified as

Although the temperature gradient is large,the plastic flow region is narrow(<1 mm),resulting in a small temperature difference across the region,about ten to dozens degrees[10]. Thus it is reasonable to substitute the T with the average temperature of the flow region Ta,and TBcan be estimated as TB=Tmax-20. After substituting Eq.(15)into Eq.(14),the expression for u can be obtained by integrating Eq.(14)with the boundary condition u=0 at x=0(Fig.3(b)),and it is described as

Differentiating Eq.(16)and substituting it into Eq.(10),the effective strain rate is acquired as

As shown in Eqs.(16)and(17),the effective strain rate and the velocity rapidly decrease with x increasing from 0 to b. While it decreases slowly when x increases from b to L. Thus the location x=b can be defined as the plastic flow/deform interface,i.e. the variable b can represent the thickness of the plastic region B

Based on the definition of B in Eq.(18) and considering Eq.(11),the flow stress σecan be expressed as

Substituting Eq.(18)into Eq.(17),the effective strain rate in FPW can be expressed as

The material velocity at position x=B/2 can be assume to be ν/2[10],and ν is half of the rotation speed. Then according to Eqs.(16)and(18),νx=B/2yields

and

The heat generation rate for plastic deformation of material within a unit volume is given by

where η is the efficiency of conversion of plastic strain energy into heat energy. Thus,the heat production of the plastic zone of volume V can be expressed as

Considering η = 1,the heat generation of the entire plastic region is equal to the welding power Pw. Therefore

where PB1and PB2are the heat generation of the plastic region in substrate and that in plug,respectively.
Since the thickness of plastic region in both sides of the interface is equal,PB1= PB2

where R =(Ru+ Rb)/2.
In the study of friction plug welding,the friction torque profile of unsteady stage increases approximately linearly. That is,the heat power increases linearly from 0 to peak value. Li[23]proposed the linear hypothesis for heat flux of the unsteady stage of rotary friction welding. The hypothesis is supported by Luo[24]. Therefore,the linear hypothesis for heat intensity can be applied to the unsteady stage of FPW,and accordingly the heat flux can be written as

where tpis the elapsed time to peak torque,as well as the duration of unsteady stage,S the area of the welding interface,and C the constant

2. 3 Temperature field
Calculating the unsteady stage temperature field of FPW is a typical transient heat conduction problem,without internal heat source. Thus,the governing equation of transient temperature field T(x,t)is given by

where T is the temperature(K)that changes with time t and position x,and κ the thermal diffusion coefficient(m2·s-1).
According to the Fourier law of heat conduction and the heat flux linearization hypothesis proposed in section 2.2, Eq.(29a) with Neumman boundary condition is given by

When steady stage is considered,Eq.(29a)should also satisfy Dirichlet boundary condition and be written as

where T0is the ambient temperature. It is also the initial temperature for FPW.
Performing Laplace transform on t,Eqs.(29a)—(29c)yield


The Laplace transformation of the temperature distribution can be obtained by integrating Eq.(30a)with the boundary conditions and yields

Giving f(t)and g(x,t)as the inverse Laplace transform of F(s)and G(x,s),and let f(t)= C/λ ·t,g(x,t)is given by

Based on the convolution theorem,Eq.(31)can be written as

With variable substitution and integration

It yields

3 Experimental and Analytical Solution
3. 1 Experiment
The FPW of AA7075 - T6 was carried out to systematically evaluate the analytical solution. The chemical composition of AA7075 - T6 is shown in Table 1 and the specific values of the parameters involved are given in Table 2.
Tools used for experiment is a self - made set-up,with rotation speed of 0—5 000 r/min,feed rate of 0—4 mm/s,clamp diameter of 0—20 mm.Specimen is fixed on a supporting plate,of 45 steel,by a universal fixture. The end of the plug has the same shape and dimension as the hole. Thermocouples are buried in the pre -drilled holes,centered at the sheet section,and adjacent to the contact surface with 1 mm distance. Temperature of these points are taken as that of the contact surface due to the small distance and high thermal conductivity of aluminum alloy.

Table 1 Chemical composition of A7075-T6

Table 2 Structural and material properties and welding parameters
Since the friction pressure P and rotational speed n are both important welding parameters,two sets of experiments were set up. The experiment uses a simple exposed thermocouple to quickly acquire the evolution of the temperature field. In the first set of experiments,P was increasing from 14 MPa to 22 MPa with a constant n of 3 500 r/min. The second set of experiments was conducted by changing n from 3 000 r/min to 4 000 r/min with a constant P of 20 MPa.
With the data,in Table 3,acquired from FPW experiment,the friction coefficient of 7075-T6 is regressed as follows

Scope of application:7075 - T6 Al alloy,P=14—31 MPa, T=372—720 K, vf=1.869—2.605 m/s.
As shown in Fig.4,the yield strength of 7075-T6 aluminum alloy varies significantly with temperature[27]. The relation between yield strength and temperature(T ≥373 K)is fitted as the following formula


Table 3 Experiment data for regression of friction coefficient of A7075-T6
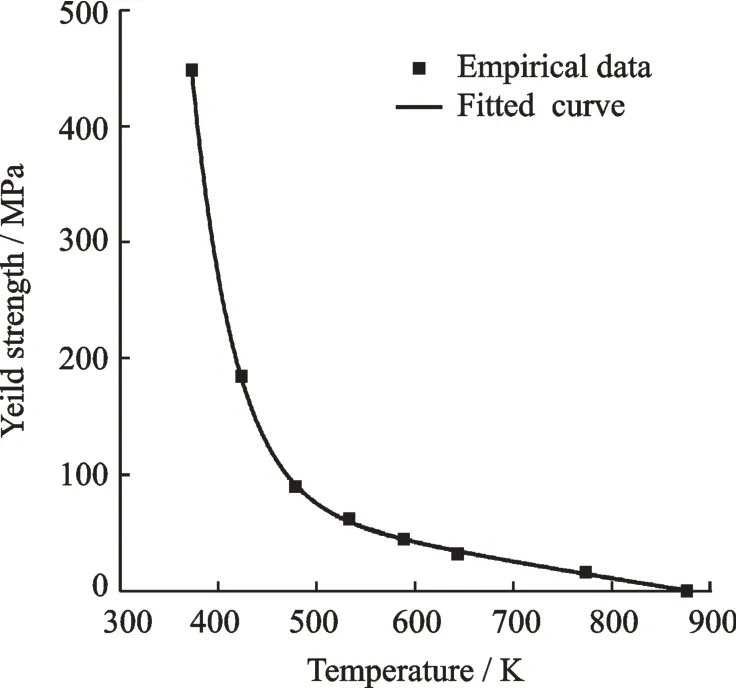
Fig.4 Variable yield stress of 7075-T6 alloy
3. 2 Peak temperature
The peak temperature Tmaxof FPW process has a great effect on the micro -structure of the joint. It can be calculated from Eqs.(1),(2),(6)and(7).
Comparison of the calculated result and experimental data is shown in Fig. 5. It can be seen that the calculated result is around 20 K higher than the experimental data. The error amounts 4% of the experimental data. Causes for the error may refer to heat sink of the backing plate,which is ignored during the modeling. In addition,temperature gradient between the contact surface and the measuring point should be related[12]. However,it should be noted that the trend of the calculated curve and the experiment curve are the same. The temperature rises with pressure increases,while falls when rotation speed increases.
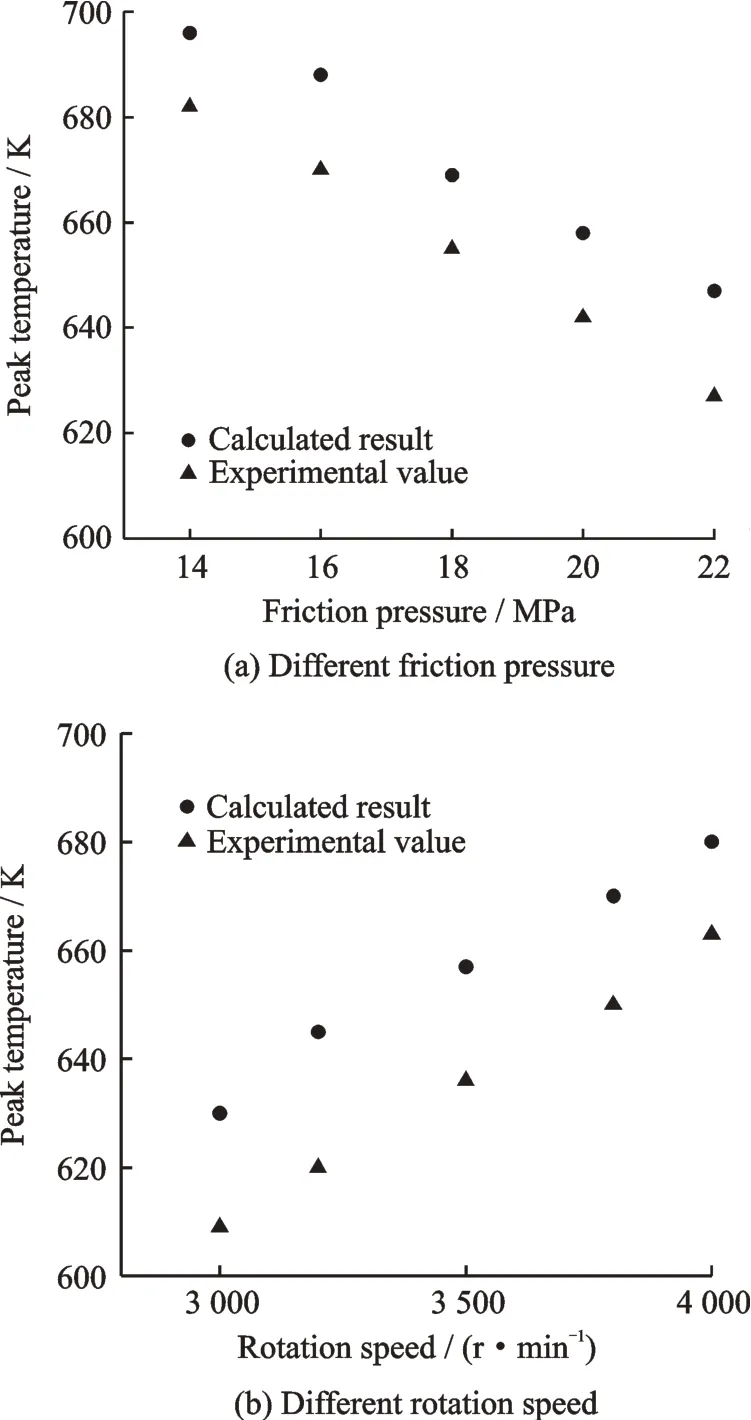
Fig.5 The peak temperature with different friction pressure and different rotation speed
3. 3 Elapsed time to peak torque
The elapsed time to peak torque partly determines the welding cycle. Considering the boundary condition T = Tmaxat x = 0 and t = tp,the elapsed time to peak torque can be obtained from Eq.(35)and be written as

Although there are errors around 0.05 s,amounting 8%,the trend of two curves are the same in Fig. 6. One of the causes for the error is a constant area of contact surface,which varies during the practical welding. Besides that materials property is also a cause. The last one is the measuring error.
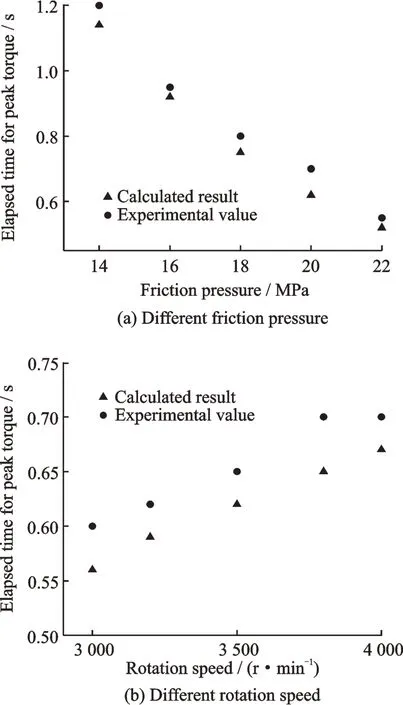
Fig. 6 Elapsed time for peak torque with different friction pressure and different rotation speed
3. 4 Temperature profile of unsteady stage of FPW
Temperature at the contact interface is chosen to evaluate the analytical model. Derived from Eq.(35),the temperature profile T(x=0,t)can be described as

It can be seen in Fig.7 that the calculated results are slightly higher than the experimental data in the initial period. This is due to the fact that the real contact area is smaller than that applied to computation. Energy of friction is consumed for the destroying of oxide layer until the fresh surface exposed completely. So there is a flatness of experimental data curve in the initial period. After that friction heat accumulates and temperature rises sharply. As temperature goes up,the slope of the curve decreases,because of the softening of the material. In addition, analytical model neglected the softening in high temperature by applying constant value of material properties and friction coefficient. Despite some differences,the general trend of analytical curve and experiment curve is the same.
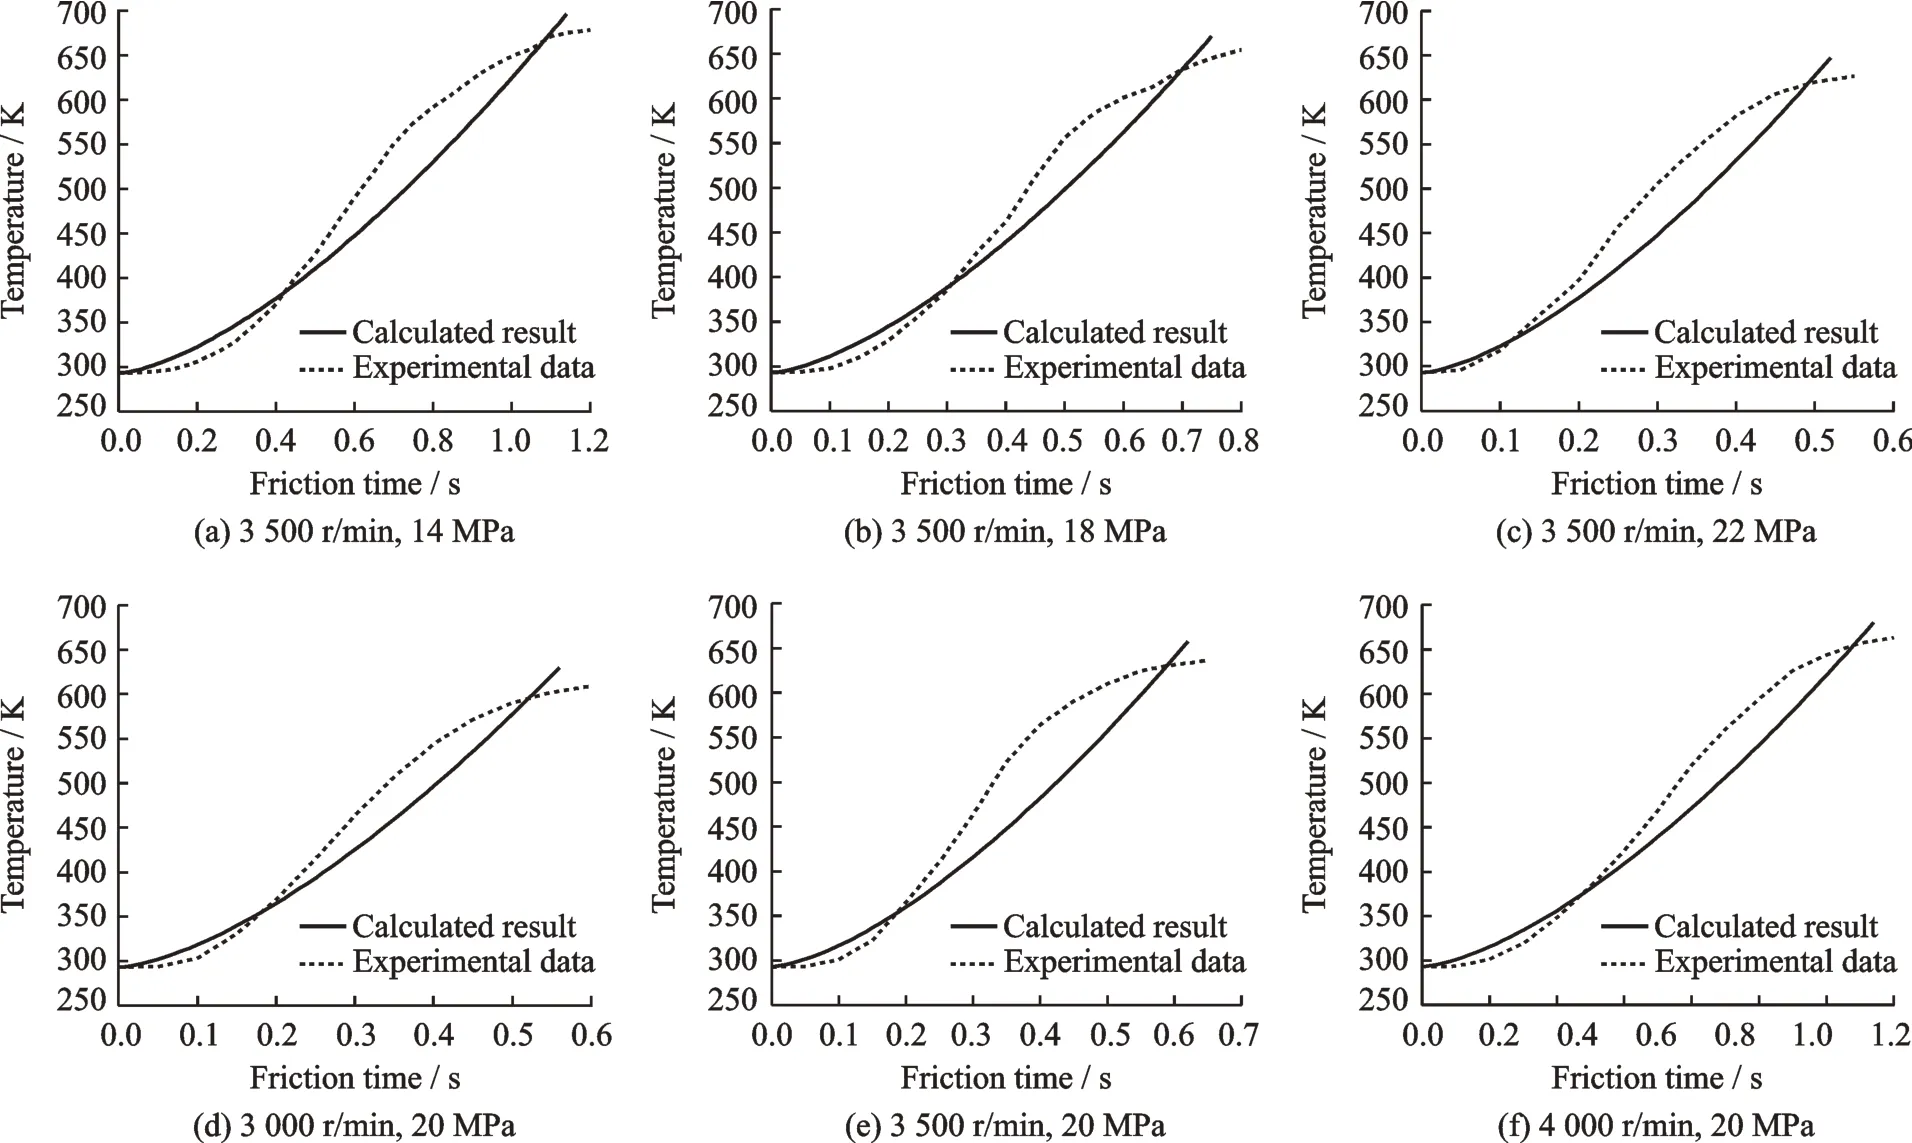
Fig. 7 Temperature profile with different rotation speeds and friction pressures during the 1st stage of FPW process
4 Conclusions
(1) An analytical thermal model is proposed for the unsteady stage of A7075 - T6 FPW. In this model,the coefficient of friction is regressed and the elapsed time for peak torque is derived from the temperature field.
(2)Linear heat flux is a reasonable assupmtion for the unsteady stage of FPW,though errors become larger when the temperature approaches the peak value.
杂志排行
Transactions of Nanjing University of Aeronautics and Astronautics的其它文章
- Thrust Characteristics Analysis of Long Primary Double Sided Linear Induction Machine with Plate and Novel Shuttle Secondary Structure
- A Nonlinear Control Strategy for Vienna Rectifier Under Unbalanced Input Voltage
- Interleaved-Connected Split Planar Resonant Inductor Design in 1 kV SiC LLC Converters
- A Modified Cohesive Zone Model for Simulation of Delamination Behavior in Laminated Composites
- Effect of Particle Size Distribution on Radiative Heat Transfer in High-Temperature Homogeneous Gas-Particle Mixtures
- Analysis and Calibration of Internal Flow Force of Ejector-Powered Engine Simulator System in Wind Tunnels
