Semantics Analytics of Origin-Destination Flows from Crowd Sensed Big Data
2019-11-07NingCaoShengfangLiKeyongShenShengBinGengxinSunDongjieZhuXiuliHanGuangshengCaoandAbrahamCampbell
Ning Cao,Shengfang LiKeyong ShenSheng Bin,Gengxin Sun,,Dongjie Zhu,Xiuli Han,Guangsheng Cao and Abraham Campbell
Abstract:Monitoring,understanding and predicting Origin-destination(OD)flows in a city is an important problem for city planning and human activity.Taxi-GPS traces,acted as one kind of typical crowd sensed data,it can be used to mine the semantics of OD flows.In this paper,we firstly construct and analyze a complex network of OD flows based on large-scale GPS taxi traces of a city in China.The spatiotemporal analysis for the OD flows complex network showed that there were distinctive patterns in OD flows.Then based on a novel complex network model,a semantics mining method of OD flows is proposed through compounding Points of Interests(POI)network and public transport network to the OD flows network.The propose method would offer a novel way to predict the location characteristic and future traffic conditions accurately.
Keywords:Origin-destination(OD)flows,semantics analytics,complex network,big data analysis.
1 Introduction
In recent years,with the development of up-to-date technology in wireless network communication,such as 5G and Global Position System,a dramatic rise of crowd sensed data collecting and processing had been seen.Analytics of sensing data has been widely used to enable a broad spectrum of applications,ranging from city planning[Horner and O"Kelly(2001)]or traffic[Kitamura,Chen,Pendyala et al.(2000);Lakhina,Mark,Christophe et al.(2005)]to epidemic disease monitoring[Colizza,Barrat,Barthelemy et al.(2007);Hufnagel,Brockmann and Geisel(2004)]or real-time reporting from disaster situations[Li,Li,Chen et al.(2018)].
In the field of mobile crowd sensing,for example,cellphones,vehicular sensors,or people themselves collected information.Hence,the obtained data through using crowd sensing methods is a new trend for big data acquisition[Sun and Bin(2017)].Position information would become a type of core data for constructing smart vehicles[Pan,Xu,Wu et al.(2011);Wu,Wu,Cheng et al.(2007)].These core data can form position-based social networks[Song,Hu,Leng et al.(2015)].
The most important position-based social networks which stand for behavior of crowds in a town are origin-destination flows.It describes a journey by its departure point(Origin)and arrival point(Destination)[Sun and Bin(2018)].OD flows not only can reflect people'behavior but also traffic jam.However,a major challenge for broader adoption of these patterns under OD flows is that the sensed data is not always reliable[Han,Dai,Paritosh et al.(2016)].Taxi is acted as the most frequently used means of transportation,its tracks can be accurately recorded with the help of GPS.So it is a very appropriate data for gathering and evaluating OD flows.
We firstly build a taxi flow complex network by GPS tracks and detect some distinctive and implicit patterns through detecting community structure[Bin and Sun(2011)].Then we use a novel complex network model to build a complex network[Shao and Sui(2014)]through compounding POI network and public transport network to OD flows network.Based on the composited complex network,spatiotemporal analysis is done to those patterns and discovers that there are close relationships between the semantics of OD flows and those patterns.At last,we design a new method to analyze semantics of OD flows through multiple relationships,and the new method is verified on actual dataset.
Our contribution lies on the following two aspects:Firstly,a novel method to evaluate the OD flows between geographical positions is proposed.We use multi-subnet composited complex network model to express multiple kinds of actual impact factors for OD flows in a city.Secondly,through topological analytics of the composited complex network,we discover that there are distinctive patterns which have tight relations with semantics of OD flows.Through spatiotemporal analysis,geographical location of boarding and disembarking can be discovered.Combined with POIs and public transport lines,we can get more accurate semantics of OD flows.
2 Related work
Research on taxi trajectory for understanding people behavior in location-based social networks is a very active research field at present.There had been many related research results.
Yuan et al.[Yuan,Zheng,Xie et al.(2012)]presented a decision model for statistical analysis of the dataset of taxi trajectory,the model can predict the passenger flow of taxis.Ying et al.[Ying,Kuo,Tseng et al.(2014)]proposed a new algorithm that depends on historical data to compute the shortest path for a given departure position and arrival position.Zhang et al.[Zhang,Sun,Li et al.(2015)]proposed a data mining algorithm to find abnormal driving behavior based on taxi's tracks,it can be used to automatically detect dangerous driving behavior or traffic jam.Chang et al.[Chang,Tai and Hsu(2009)]proposed a taxi passenger flow forecasting model based on multiple demand factors.Based on historical data,the model can successfully predict passenger demand in different time periods.
Human travel behavior had tight relationship with social data.Li et al.[Li,Wu,Xu et al.(2014)]studied taxi users' social network information,and they found the intrinsic relationship between taxi trajectory and users' sharing of social network information.The most major function of taxi tracks research is detecting urban areas of different roles in a town.Zhong et al.[Zhong,Huang,Stefan et al.(2014)]investigated the relation between the location of users getting on and getting off and the function of urban areas.Zheng et al.[Zheng,Capra,Wolfson et al.(2014)]designed a method which maybe detect various functional areas of a town through using points of interests.
3 Preliminaries
This section introduces compounding mapping operation and subnet compounding operation of multi-subnet composited complex network model.
Definitions 1(Compounding mapping):Given subnet networkGa=(Va,Ea,Ra,Fa),Gb=(Vb,Eb,Rb,Fb),R′is called as set of compounding interrelations,r′∈R′,Ψ:V1×V2→r′is called as compounding mapping betweenG1andG2according tor′,which is called as compounding relation.R′is called as set of compounding relations.
Definitions 2(Subnet compounding):Given subnet networkGa=(Va,Ea,Ra,Fa),Gb=compounding mapping Ψ:V1×V2→r′,r′∈R′,compounding subnetG1toG2would generate a new composited one networkG=(V,E,R,F),

An example of subnet compounding is illustrated in Fig.1.

Figure 1:Subnet compounding of multiple network(G1,G2,G3,G4)
4 Dataset description
Firstly,the taxi trace dataset provided by Transportation Committee of Qingdao city is introduced.The dataset with about 20 million taxi-GPS records consists of 5872 taxi and covers 371 days.State of taxi is defined in a predetermined time interval of one minute,the state includes some fields as follows:
●ID:the identification of data record;
●GPS LONGITUDE:longitude of a record;
●GPS LATITUDE:latitude of a record;
●LADEN/UNLADEN STATE:whether a taxi is laden at sampled time,1 represents it is laden and 0 represents it is unladen;
●TIME:the sampled time.
An example of state explanation is show in Tab.1.
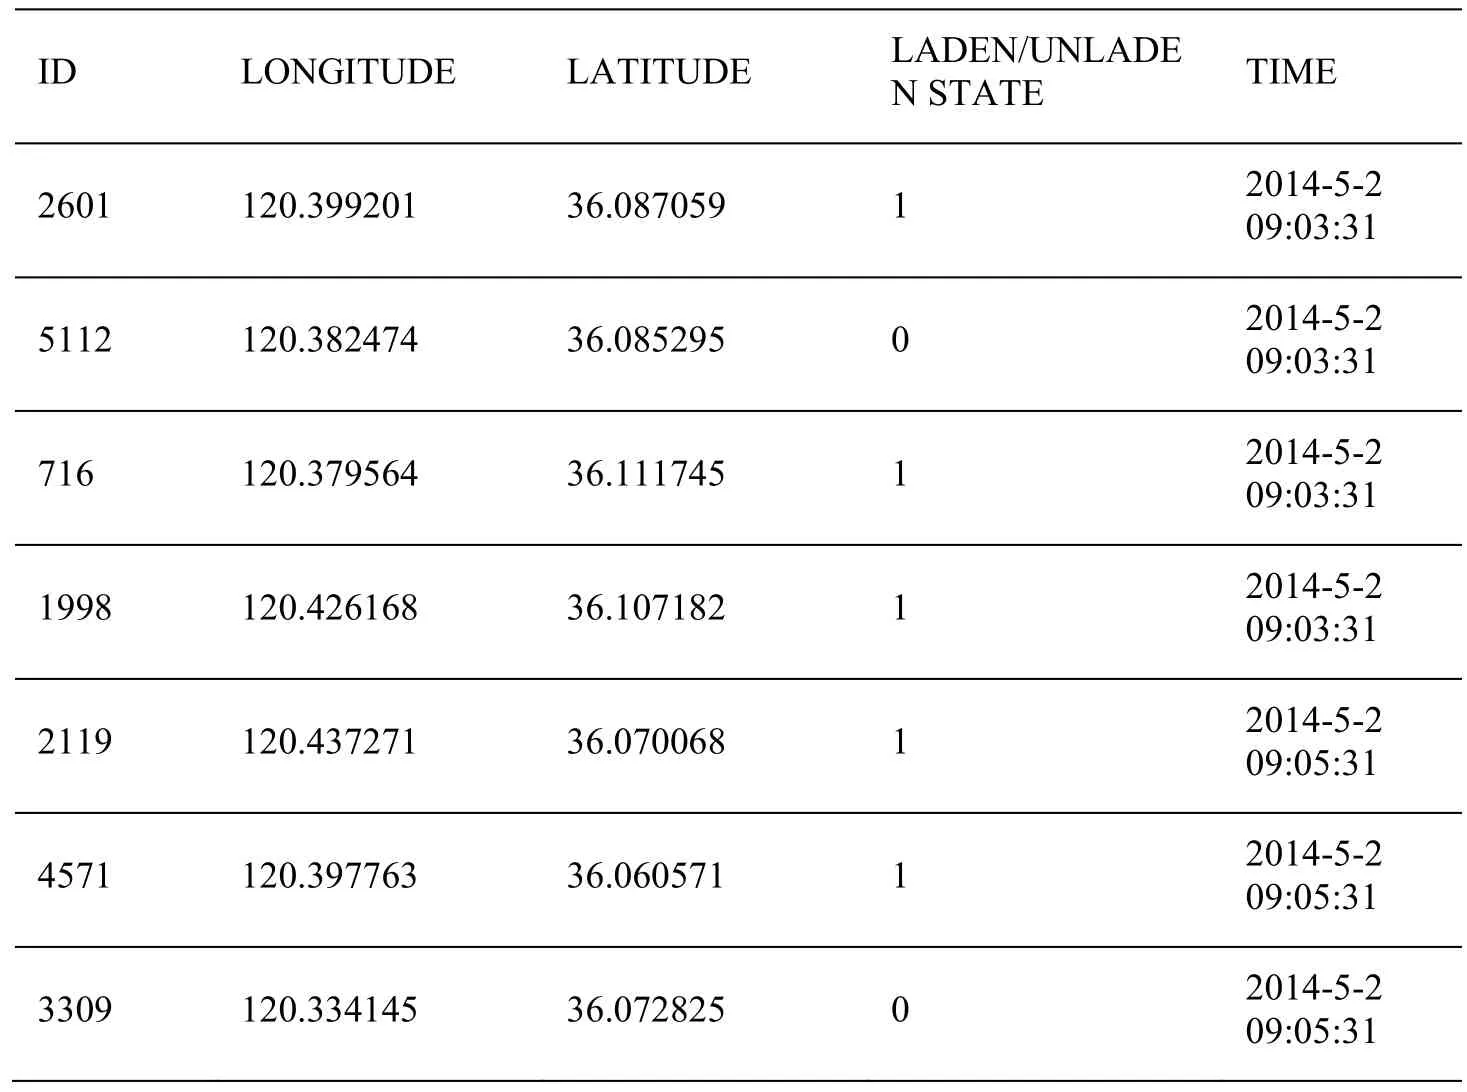
Table 1:An example of state explanation
Abnormal data cleaning process is a necessary step in big data analysis.We remove taxi traces whose length is less than 500 m and more than 30 km or travel time less than 2 mins.
5 Spatiotemporal study and pattern analysis
For the purpose of analysis,Qingdao urban map is divided into cells of 0.5×0.5 km2.To estimate the OD flows,we count the quantity of taxi traces from position Lito position Lj.The quantity of taxi traces cijcan be approximated as OD flow between position Liand position Lj.Through statistical analysis,we found that cijis rather uneven.Statistical analysis indicates that most of human behavioral activities by taxi can be reflected by OD flows.The quantity of OD flows whose cijvalue is more than1000 per month is 237,and the quantity of grids bound up with those 237 OD flows is 75.We think that they can represent typical human behavior by taxi.
We use the 75 location grids as nodes and those 237 OD flows as edges to build a complex network,which is shown as Fig.2.

Figure 2:The complex network of OD flows
For the complex network,we use Mapping Vertex into Vector algorithm to detect community structure.Nodes of the complex network are divided into three communities(green grids,red grids,orange grids)as shown in Fig.3.
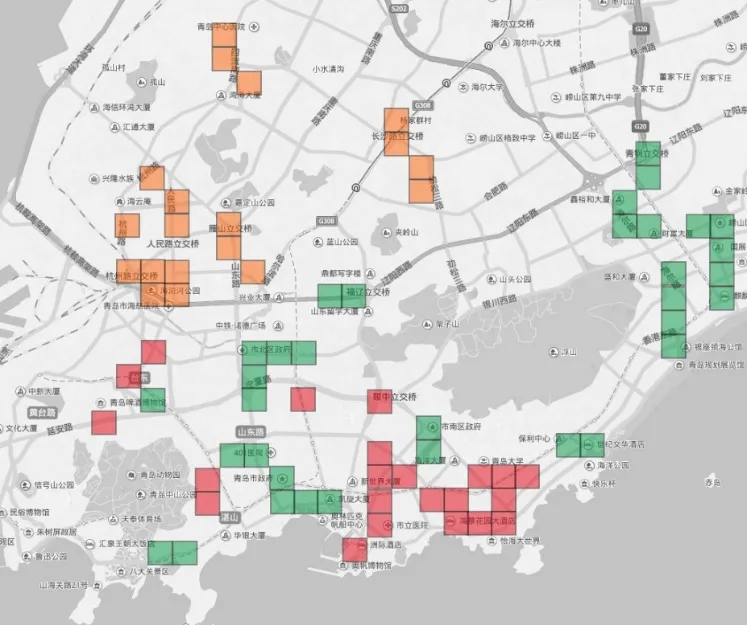
Figure 3:Distribution of grids belonged to three communities in Qingdao urban map
For better understanding OD flows and identifying emerging patterns,then we explore spatial and temporal distribution of OD flows.
According to the LADEN/UNLADEN STATE and TIME in source dataset,we can get taxi demands variation trend varying time.The taxi demands with hours in a day is shown in Fig.4.
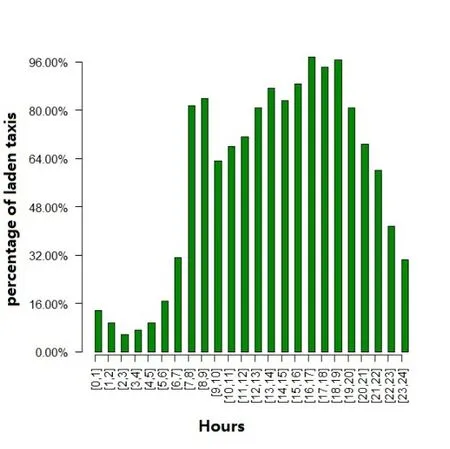
Figure 4:Percentage of laden taxis according to the hours of day
As expected,the percentage of laden taxis varies with working hours.It begins to increase sharply from 7:00,it will gradually reach peak value between17:00 and 19:00,then it will slowly fall back at night.
Percentage of taxi traces over time of the day and over weekday and weekend are individually shown in Fig.5 and Fig.6.
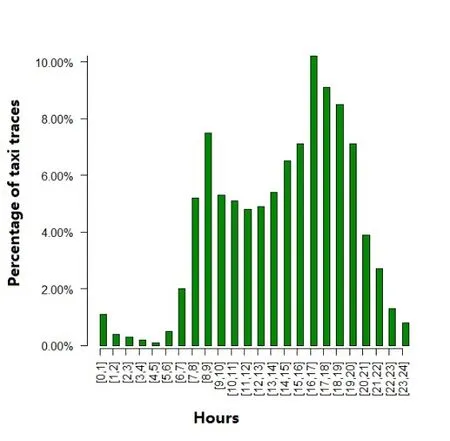
Figure 5:Percentage of taxi traces over time of the day
From Fig.5 we can see that the percentage of taxi traces over time of the day also follows the business hours,time interval from 7 a.m.to 8 a.m.,and from 4 p.m.to 5 p.m.form two peaks.The result is basically consistent with laden taxis variation.
From Fig.6 we can see that there are more taxis carrying passengers on weekdays than on weekends.
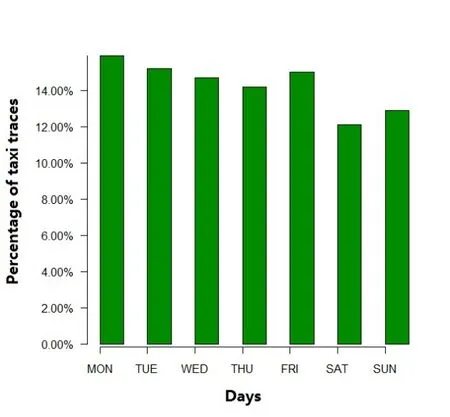
Figure 6:Percentage of taxi traces over time of weekday and weekend
We use vertex in-degree and out-degree of complex networks[Barabási and Albert(1999)]to identify some major locations.The top-10 largest in-degree and out-degree of grid locations is shown in Fig.7 and Fig.8.
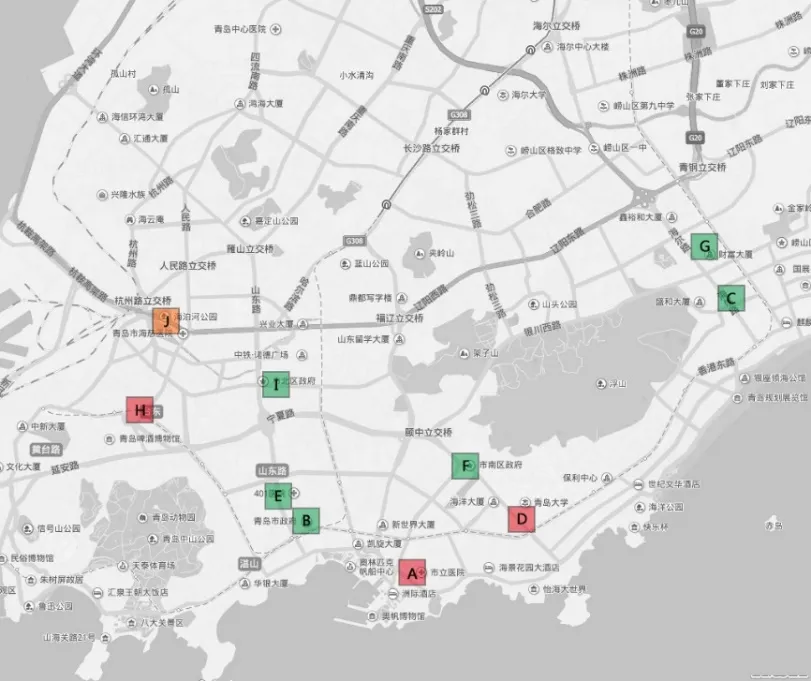
Figure 7:The top-10 largest in-degree of grid locations
Fig.7 presents the major locations of taxi drop-offs distribution in Qingdao,these locations mainly includes downtown(C,G,H),hospitals(A,E,J),governments(B,F,I)and university(D).
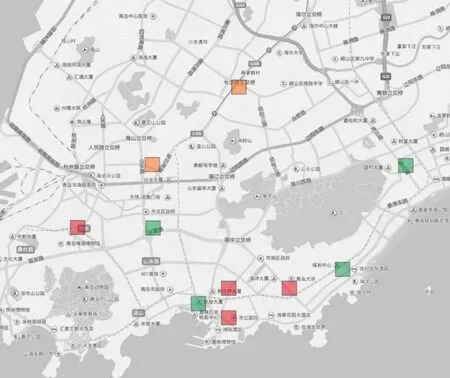
Figure 8:The top-10 largest out-degree of grid locations
Fig.8 presents the major locations of taxi pick-ups distribution in Qingdao,these locations mainly include Central Business Districts and large residential districts.
The related stopping grid positions are shown as Fig.9,where the thickness of links stands for intensity between two grid positions.
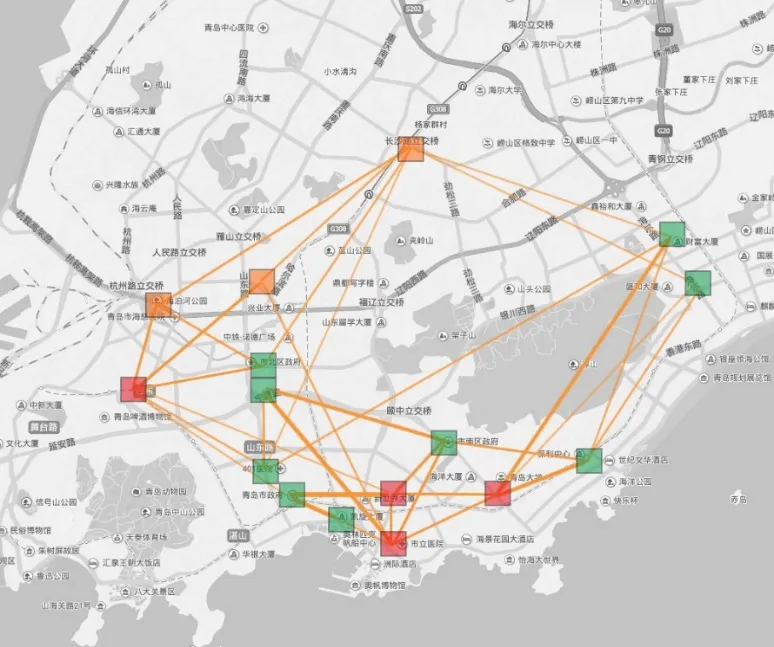
Figure 9:The related taxi stopping positions
6 OD flows semantics mining method
POIs are grouped into seven categories including downtown,education,health facilities,public transport hub,central business districts,governments and residential district.
Percentage of POIs Categories is shown as Fig.10.

Figure 10:Percentage of POIs Categories
Fig.11 shows the POI distribution for distinguishing the main POI on each position grid.
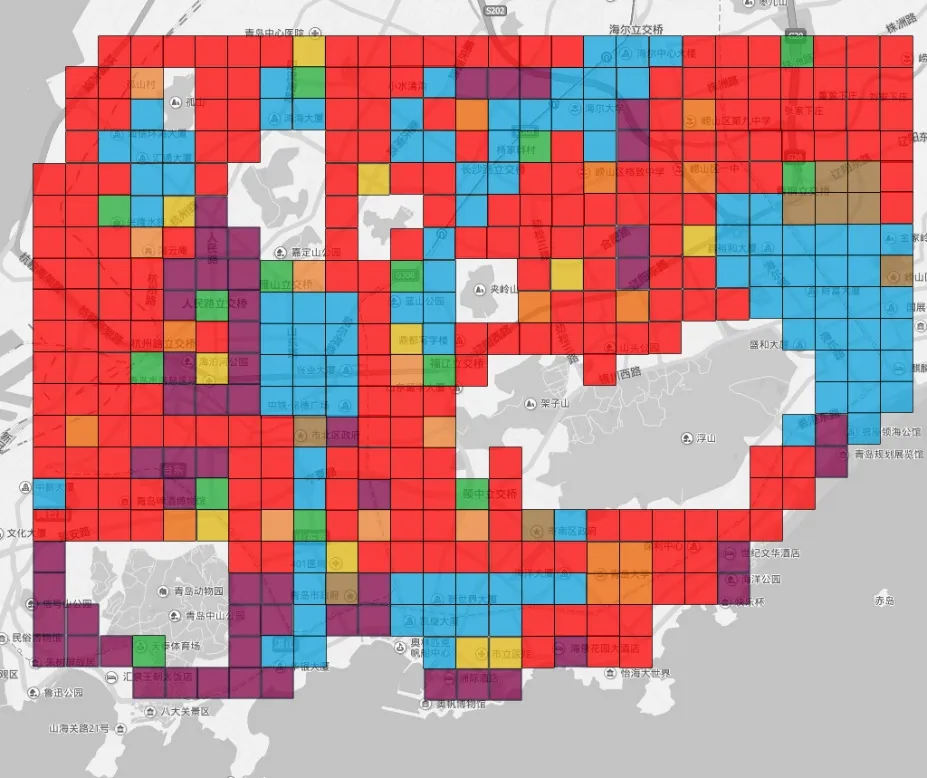
Figure 11:Predominant POI category on each location grid
We use multi-subnet composited complex network model to compound OD flows network and POI network.Then the semantics of OD flow is defined by the semantics of its starting position grid and ending position grid,such as residential district to public transport hub or central business districts to governments.Through topological analytics of the composited complex network,the quantity of OD flows with each kind of semantics is shown in Tab.2.

Table 2:Quantity of each semantics
We select 3 representative semantics to explore their relations with behavioral patterns.

Figure 12:Percentage of OD flow from residential district to central business districts and OD flow from central business districts to residential district
From Fig.12 we can see that the OD flow from residential district to central business districts has a peak from 8:00 a.m.to 9:00 a.m.and the OD flow from central business districts to residential district has a peak value from 16:00 to 17:00.The two patterns are in accordance with daily behavior experience which people go to work in the morning and return home in the evening.
From Fig.13 we can see that residential district to health facilities OD flow is flat distributed in day-time.It means that there are no peaks for some OD flows.Based on the analysis mentioned above,the percentage of OD flows with hours distribution can be acted as their feature to identify these OD flows.So,we could explain each OD flow by using a feature vectorSd.
So,in like manner,we could explain each OD flow with another feature vectorWd.
We have divided the primary 75 location grids into three communities,there are dense OD flows in the same community,and there are sparse OD flows between two communities.To analyze the empirical observation,we use multi-subnet composited complex network again to compound public transportation network to the former composited network.The public transport network consists of 873 bus station nodes and 1522 lines between bus stations,its topology is shown as Fig.14.
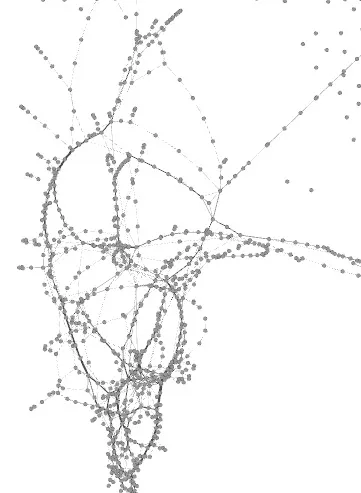
Figure 14:The complex network of Qingdao public transport
We found that the more there are public transport lines between two grid locations,the less there are OD flows between them.Distance is not the most important factor of OD flows.An example is shown in Fig.15.

Figure 15:Relationship between OD flow and public transport line
From Fig.15 we can see that the distance of grid A-grid B and he distance of grid A-grid C are almost the same,but there are much more OD flows between grid A and grid B than them between grid A and grid C.It is because that there are public transport stations nearby grid A and grid C.So taking public transport into consideration,it will mine better the semantics of OD flows.
We use an improved Support Vector Machine[Fung and Mangasarian(2005)]to classify above defined feature vectors.Our experimental dataset is actual taxi trajectory data of Qingdao.The actual dataset is stochastically divided into three subsets,train set accounts for 70%,validation accounts for 20% and test set accounts for 10%.The results are limited to several semantic types shown in Tab.2.The classification process is run 100 times and the accurate rate is shown in Tab.3.
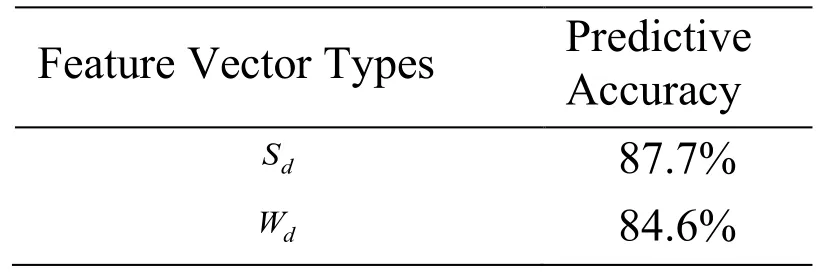
Table 3:The predictive accuracy for each type of feature vectors
7 Conclusion
In this paper,our research pays close attention to the OD flows from taxi-GPS traces and understands crowd movement.Through data gathered in Qingdao,China,the distinctive human behavioral patterns which closely related with OD flows are found.Then,a semantics mining method of OD flows is proposed through compounding Points Of Interests(POI)network and public transport network to OD flows network.Experimental results show that we can mine more accurate unknown rules based on the method.
Future work includes being able to accurately predict taxi flow,comparing pattern of OD flow under different conditions,and suggesting for urban traffic planning.
Acknowledgement:This work is supported by Shandong Provincial Natural Science Foundation,China under Grant No.ZR2017MG011.This work is also supported by Key Research and Development Program in Shandong Provincial(2017GGX90103).
杂志排行
Computers Materials&Continua的其它文章
- A Heterogeneous Virtual Machines Resource Allocation Scheme in Slices Architecture of 5G Edge Datacenter
- Multiple Kernel Clustering Based on Self-Weighted Local Kernel Alignment
- A Physical Layer Algorithm for Estimation of Number of Tags in UHF RFID Anti-Collision Design
- A Compensation Controller Based on a Nonlinear Wavelet Neural Network for Continuous Material Processing Operations
- A Robust Zero-Watermarking Based on SIFT-DCT for Medical Images in the Encrypted Domain
- Bus Priority Control for Dynamic Exclusive Bus Lane
