Multi objective prediction and optimization of control parameters in the milling of aluminium hybrid metal matrix composites using ANN and Taguchi-grey relational analysis
2019-10-31AjithArulDanielPugazhenthiKumarVijayananth
S.Ajith Arul Daniel,R.Pugazhenthi,R.Kumar,S.Vijayananth
Department of Mechanical Engineering,Vels Institute of Science,Technology and Advanced Studies,Chennai,Tamilnadu,600117,India
Keywords:Silicon carbide Temperature Surface roughness Cutting forces Artificial neural network Grey relational analysis
A B S T R A C T This study aims to optimize the input parameters such as mass fraction and particle size of SiC along with depth of cut,feed and cutting speed in the milling of Al5059/SiC/MoS2.The hybrid metal matrix composites are generally fabricated by reinforcing of different sizes(10,20,40 μm)of SiC with aluminium at a different levels(5%,10%&15%)whereas the MoS2 addition is fixed as 2%.The effect of each control factor on response variables are analyzed through Taguchi S/N ratio method.Also,the most significant method for prediction of response parameters is satisfied by ANN model than the regression model.Analysis of variance(ANOVA)results envisage that mass fraction of SiC,feed rate is the most domineering factor on response variable.
1. Introduction
Aluminium Metal Matrix Composites(AMMC)plays a vital role in the recent trend of production technology.Generally,ceramic particulates are added with aluminium alloys to fabricate the AMMCs in order to attain the superior mechanical strength,wear resistant and corrosion properties[1].It had reached a great trend of usage and importance attributable to their distinctive mechanical and physical characteristic.These AMMCs largely replaced the conventional ferrous material in automobile,marine and aerospace industries owing to its higher in wear resistance and strength to weight ratio.In general,every material should undergo some machining operations towards achieving precise shape and size to become a final product[2].But the presence of hard reinforcements in these materials makes the machining process(milling,turning and drilling)quite difficult.Consequences of reinforcements during machining are higher tool wear,poor surface quality and machine vibration[3—5].So,the machinability aspect finds importance in the successful implementation of these advanced materials in potential applications.
Apart from the analysis of process parameters effect over response variables,prediction of the response variable and process parameter optimization is the two major practices generally carried while analyzing a newer material during machining.Prediction of response parameters based on the experimental data in machining is important and very useful which is commonly done by developing regression equations.But,Muthukrishnan and Davim[6]results show that ANN is the most effectual method when compared to the regression equation to forecast the relationship flanked by surface roughness and input process parameters during AMMC machining. Temel et al. [7], said that Artificial Neural Network is an effective method for prediction of an output variable with less error than any other method to identify the mechanical and physical characteristics of Al2024-B4C MMCs.During CO2laser cutting the best solution to predict the surface roughness of mild steel with good accuracy is fulfilled by ANN model[8].So the ANN model can be utilized to predict the response variable during milling.The surface quality of the components plays a vital role in escalating the customer satisfaction,which can be altered by controlling the cutting parameters.Bhattacharyya and Manna[9]carried out an experimental study on milling of Al/SiC MMC and found that feed rate has a substantial effect on surface roughness.The experimental data were analyzed through ANOVA,it reveals that the depth of cut is the maximum contributing parameter on material removal rate and surface roughness in milling AA6082 T6 alloy[10].On the other hand,by optimizing the surface roughness of the composites there is a probability of an increase in cutting forces.At the same time,higher Material Removal Rate(MRR)is essential in industries for increased productivity and it can be achieved by selecting proper input machining process parameters like feed,speed,and depth of cut but mostly it has an adverse effect on the cutting tool which affects the quality of product[11].To attain higher MRR,the depth of cut and feed rate are increased along with the selection of the proper cutting tool.However,Babu et al.[12],found that the cutting force increases in tangential direction when the depth of cut increases during milling of Al/SiC MMC.Emel Kuram et al.[13],results expose that the feed force increases with increase in spindle speed,feed rate and depth of cut while the radial force is also increased with increase in depth of cut during milling.Conversely,an increase in cutting force leads to machine vibration and tool chattering which diminishes the quality of the machined surface.Sivasakthivel et al.[14],reported that increase in spindle speed results in increased temperature during end milling of Al 6063 alloy and also states that formation of builtup edge occurs due to temperature increment which result in a minimal surface finish.Also,increase in temperature leads to deformation in the workpiece that leads to poor machining accuracy[15].The aforementioned facts confirms that MRR and other response parameters have opposite effect while changing the input parameter and it is necessary to identify the neutral machining parameter combination that gives reduced temperature.GRA and ANOVA results reveal that feed rate is the most influencing parameters which determine MRR and surface roughness while machining of Al6063 T6 alloy[16].Tomadi et al.[17],studied the cutting process parameters in end milling of AlSi/AlN composites by Taguchi and GRA method.The result reveals that uncoated carbide tool with feed rate 0.4 mm/tooth,depth of cut 0.3 mm,cutting speed 240 mm/min and 15%weight percentage of AlN is the optimal combination to achieve minimum surface roughness,tool wear,and higher MRR.Machining of AMMC reinforced with the different weight percentage of B4C has been studied and the influence of machining parameters on thrust force, the surface roughness is reported.The weight percentage of B4C is the most influencing factor for surface roughness.10%of B4C and 2000 rpm of spindle speed and 0.1 mm/rev feed rate are the optimum combinations identified through GRA on cutting force and surface roughness[18].Tsao[19]performed the multi-objective optimization on end mill parameters while milling Al 6061P-T651 alloy through GRA.The grey relational optimal combination effectively decreased the surface roughness from 0.44 μm to 0.24 μm.Further,GRA is a simple tool which does not require any complex formulations for multi-objective optimization;hence the results can be obtained in a short time.So the GRA technique can be used for solving this multi-objective problem.Sudhagar et al.[20],studied the comparison on the effect of welding parameters on tensile strength,hardness and impact strength.The optimum combination of parameters was analyzed using GRA technique.The result reveals that the GRA method is most satisfied than other technique for optimizing the response parameters.
It is a remarkable fact to state here that particle size and the weight percentage of the reinforcement also has a greater effect on machining characteristics[21].But,most of the studies only discussed the effect of the weight percentage of reinforcements whereas there is only a limited number of studies were carried out to find the effect reinforcement particle size over the response variables.Further,from the literature survey,it was evident that many researchers have studied the machining characteristics of various metal matrix composites and alloys by considering merely one or two response variables.But to the best of author's knowledge,investigation of machining process using six response parameters are yet to report.To overcome these research gaps,along with machining parameters and reinforcement percentage,the effect of reinforcement size on responses variables were analyzed and totally six response parameters namely surface roughness,temperature,material removal rate,feed force,radial force,and tangential force are considered in this study.The effect of each input parameters on every response variables has been analyzed and the optimal input conditions are identified.Further,for prediction of response parameters,regression model and ANN model are formed and their performance is compared.The optimum parameter combination that gives better multi-objective performance is identified through GRA.
2. Experimental details
2.1. Specimen preparation
Al 5059 armor aluminium is used as the base material and its chemical composition is shown in Table 1.Silicon carbide ceramic particles and Molybdenum disulphide solid lubricant was selected as reinforcements.SiC particles of three various sizes(10,20,and 40 μm)were reinforced at three different weight%(5,10&15)and weight fraction of MoS2is kept constant as 2%[30].The compositions of developed aluminium alloy are shown in Table 2.
2.2. Milling experiments
Aluminium hybrid MMC workpiece with the dimensions of 100 mm×65 mm×15 mm is used for the experiments.The SIEMENS802D BMV 40 320D control system based three-axis Computer Numerical Controlled(CNC)machining center is used for this experimental work and the Kistler 9257B dynamometer is used for measuring cutting force of the CNC machines.The experimental setup for milling is shown in Fig.1 and machined workpiece is shown in Fig.2.
2.3. Process parameters
Table 3 shows which include feed,speed,and depth of cut with material parameters such as size and percentage of SiC,each at three levels are the input process parameters selected for the experimental study.
3. Experimental design and optimization
3.1. Taguchi S/N ratio analysis
To analyse the input parameters,the experimental design was done using the Taguchi orthogonal array method to minimize the number of experiments[22].Based on the Taguchi design,L27orthogonal array was selected.The‘smaller is better’criteria is selected and calculated using the formula.

Table 1 Weight percentage Composition of Al 5059.

Table 2 Hardness composition of Aluminium Metal Matrix Composites.
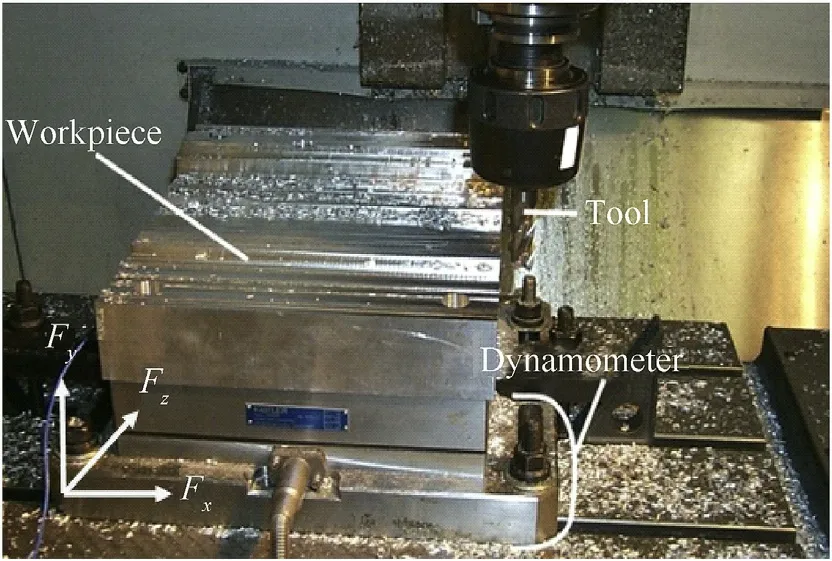
Fig.1.Experimental setup.
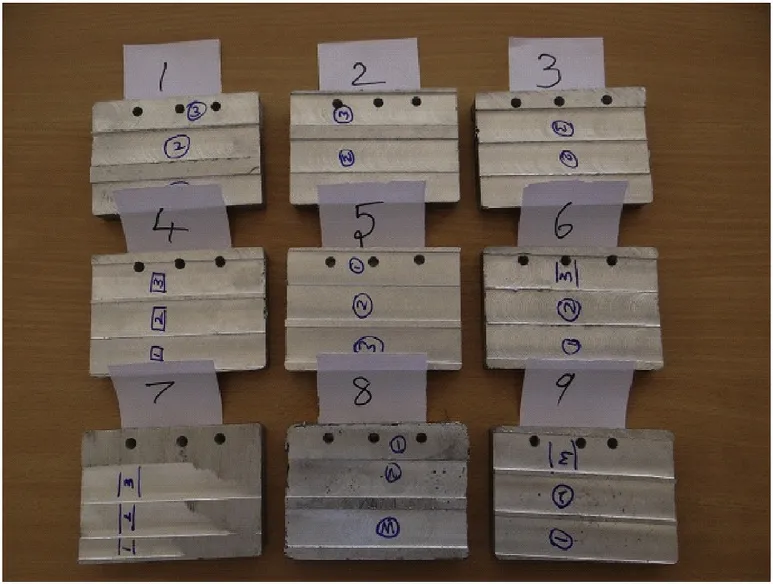
Fig.2.After milled specimens.

Table 3 Control parameters and corresponding levels.

To determine the S/N ratio for the metal removal rate which has to be improved,the‘larger is better’criteria are selected and the equation is

Where‘i’is an entire number of experiments,‘yi’is the experimental outcome of ithexperiments.
3.2. Artificial Neural Network model
Artificial Neural Network[23] is an information-processing model enthused the brain processes in order.It consists of a large number of interconnected processing elements named neuron working in parallel to solve a particular problem.
Fig.3 shows the structure of a three-layer Artificial Neural Network(ANN).The input neurons are the mass fraction of SiC,the particle size of SiC,speed,feed,and depth of cut likewise the output neurons are surface roughness,temperature,MRR,Fx,Fy,and Fz.The input and output values are trained using back propagation algorithm and 27 experimental data are trained and validated.
3.3. Grey relational analysis
Grey relational analysis with Taguchi design is the better solution to know the combined response parameters[24].There are three main steps involved in GRA for analysis.The first stage is to normalize the measured output function individually.Since the aim,is to minimize surface roughness,temperature and cutting force,‘smaller is better'normalization equation is selected and it can be expressed as

In case of metal removal rate,the criteria chosen is larger is better,so the equation is

Where Zijis the value obtained from the experiment data,min(Zij)is the minimum value from the experiment.Similarly,max(Zij)is the maximum data obtained from L27Tagughi design.
The normalized data is calculated using the following equation.

The higher grey relational grade implies the ultimate combination of eminence characteristics of milling.The GRG grade is determined using the equation below.

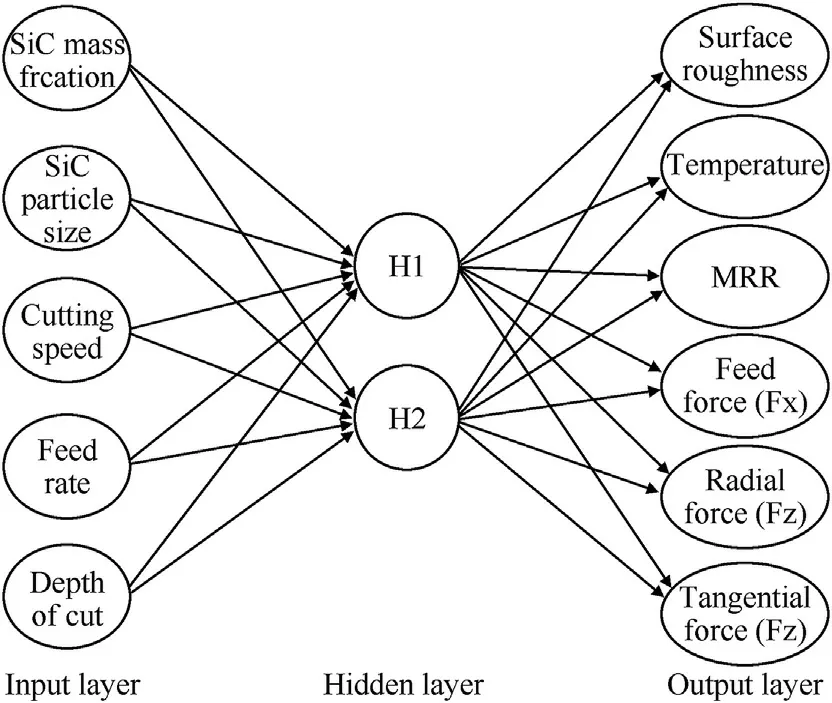
Fig.3.Architecture of Artificial neural network.
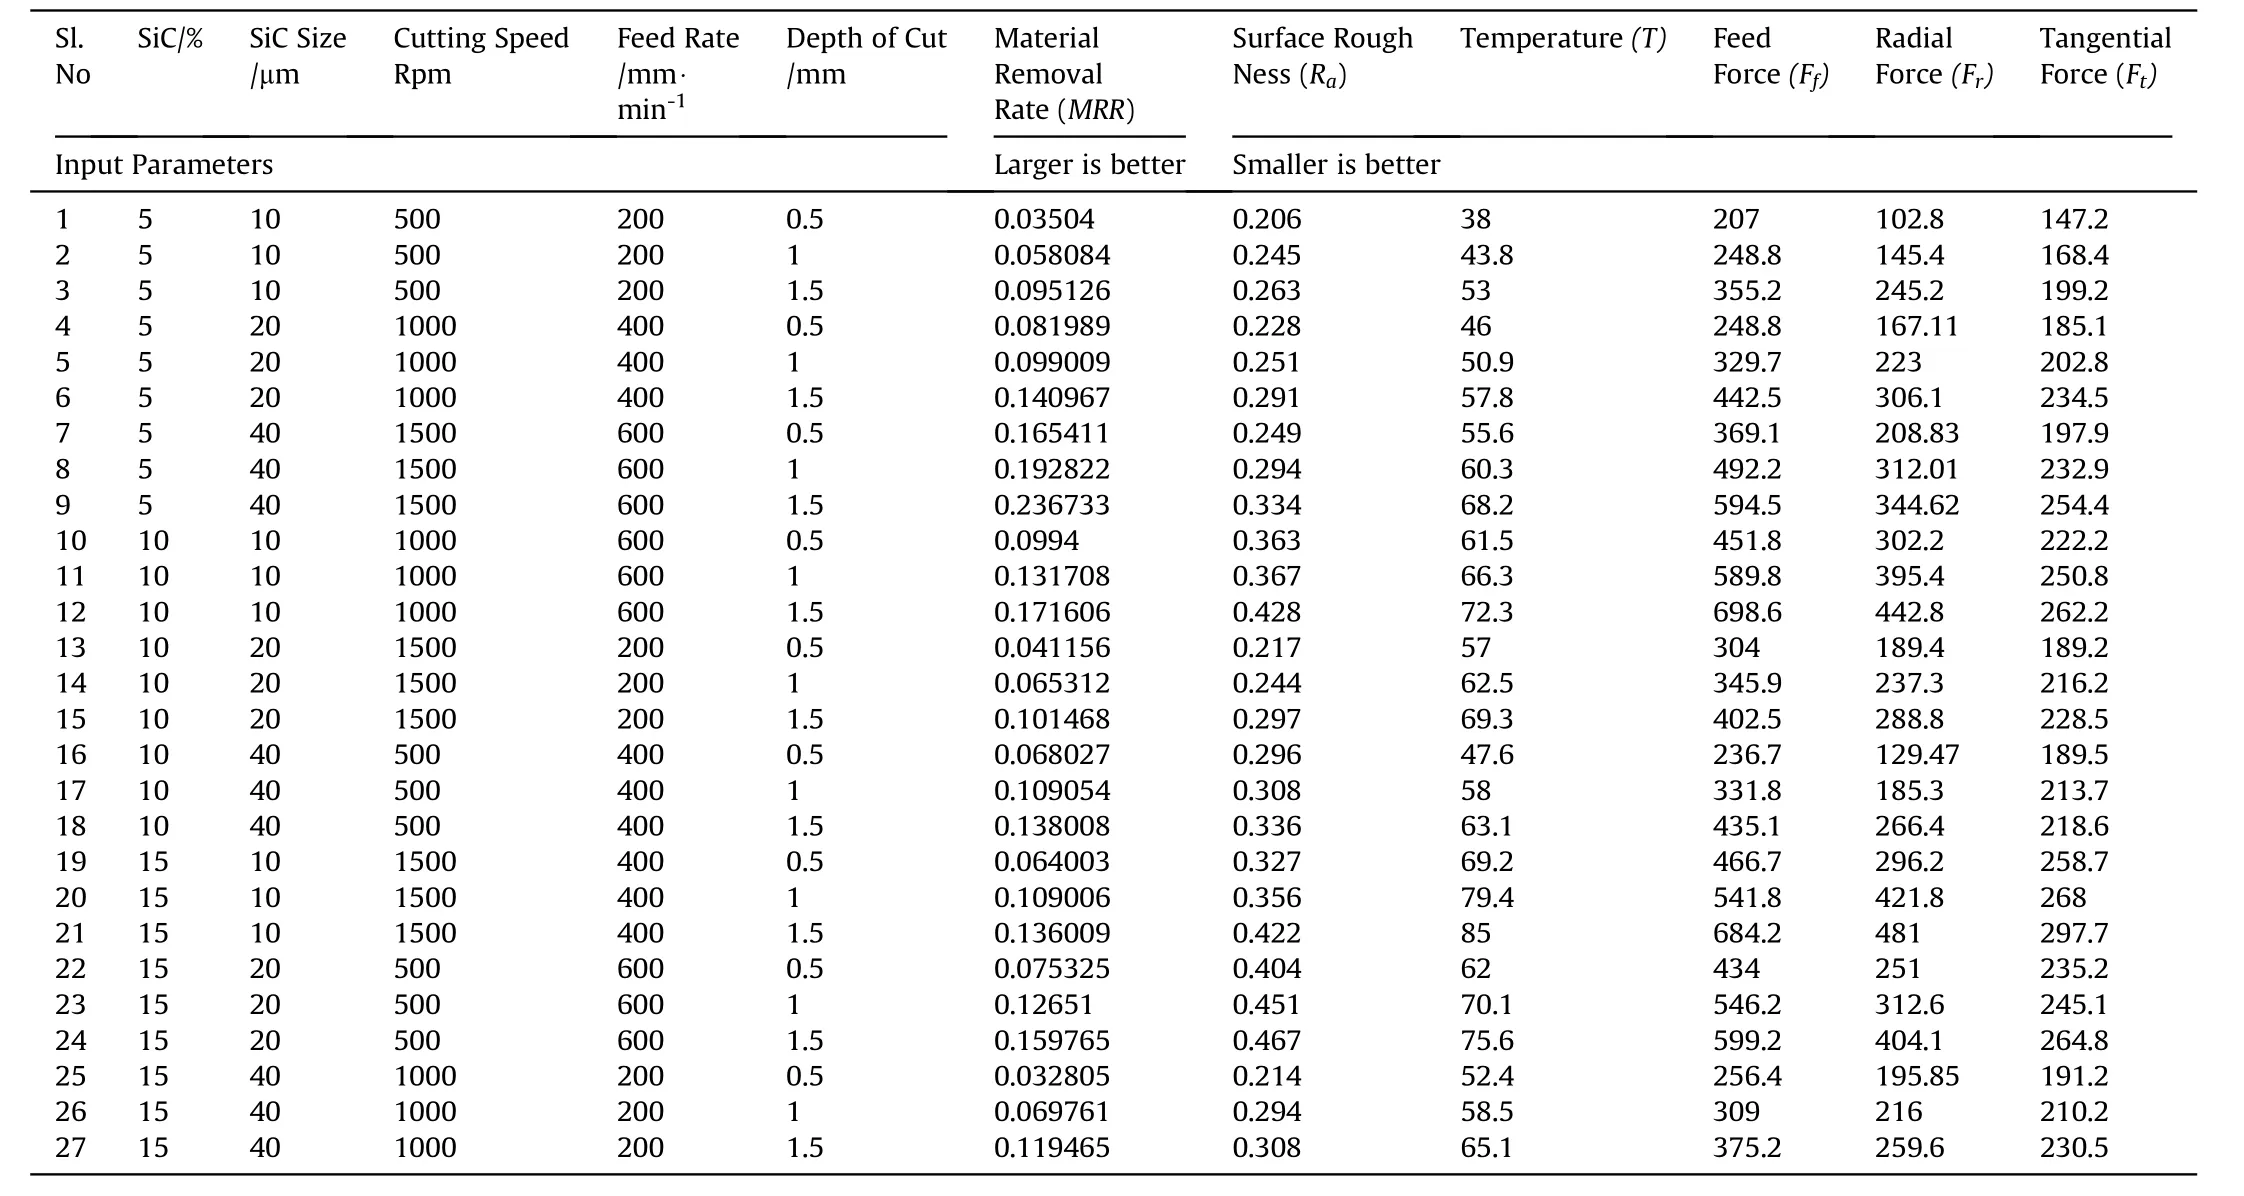
Table 4 L27 orthogonal array and results.
4. Results and discussion
4.1. Signal-to-noise ratio analysis
Table 4 shows the L27orthogonal array and experimental results corresponding to the input parameters.
Fig.4 shows the optimal combination of parameters for lower surface roughness i.e.A1B3C2D1E1.Minimum percentage of SiC(5%)with 40 μm particle size,1000 rpm cutting speed,200 mm/min feed and 0.5 mm depth of cut resulted in the good surface finish.Also from the figure,it can be observed that the surface roughness is high at higher feed rate.The increase in feed rate increases the surface roughness of the MMC.When the feed rate has increased the distance between the two successive tool paths increases and feed marks can be clearly identified[25]and leads to increased roughness.At the higher depth of cut,the development of high normal pressure on the rake face of the tool results in the formation of built-up edge that resulted in poor surface finish[26].On the other hand,the roughness of the machined surface decreases with increase in speed.Since the formation of built-up-edge(BUE)and chip fracture is high at lower speeds the surface roughness increases and with the increase in cutting speed the BUE become extinct and decrement in chips fracture results in better surface finish[27].
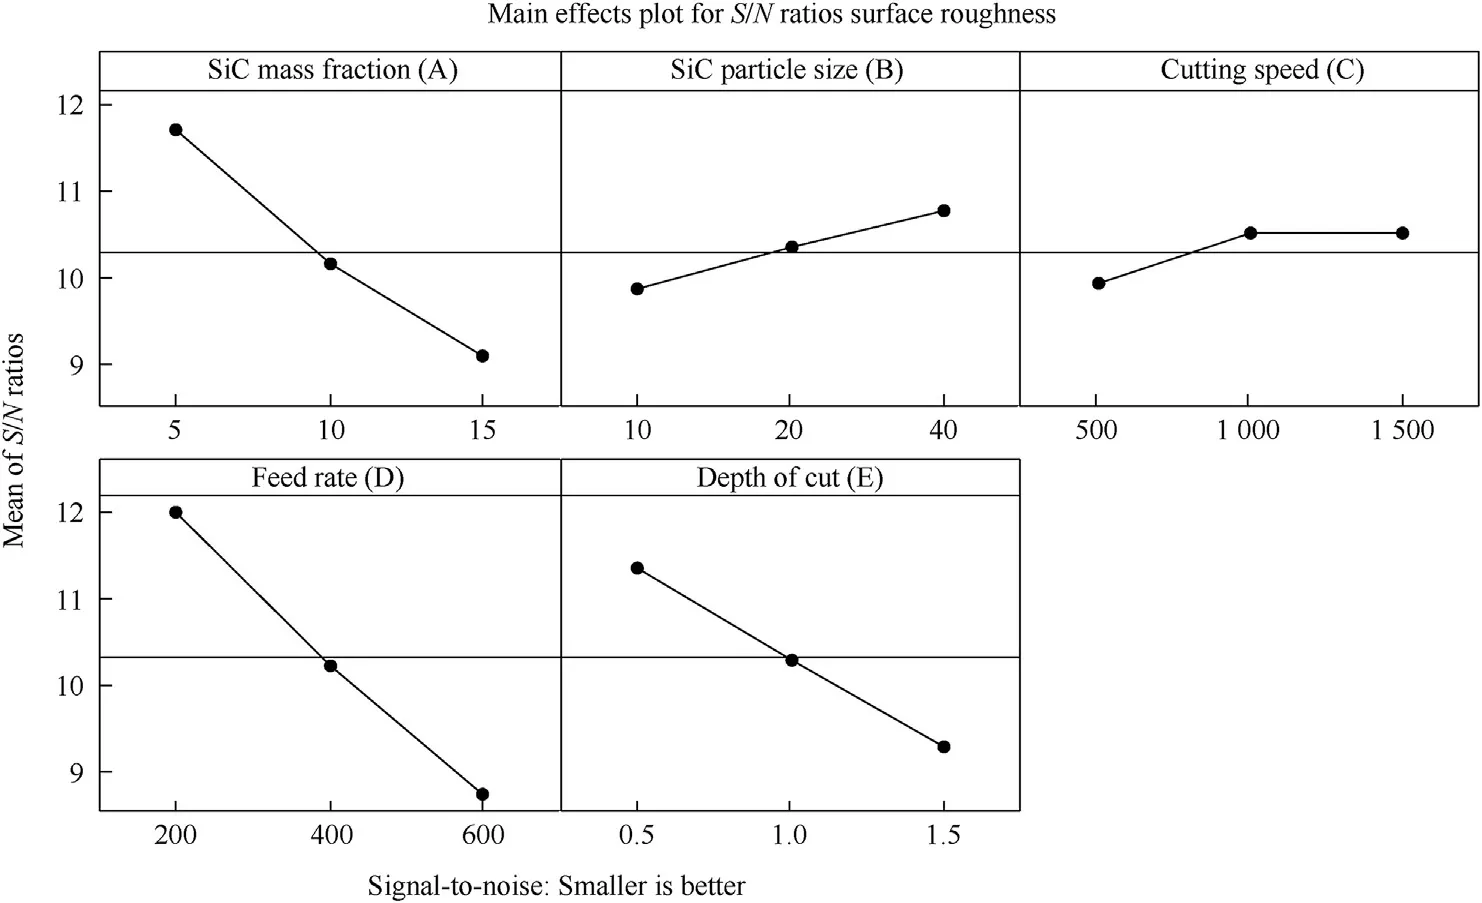
Fig.4.Mean S/N ratio graph for surface roughness.
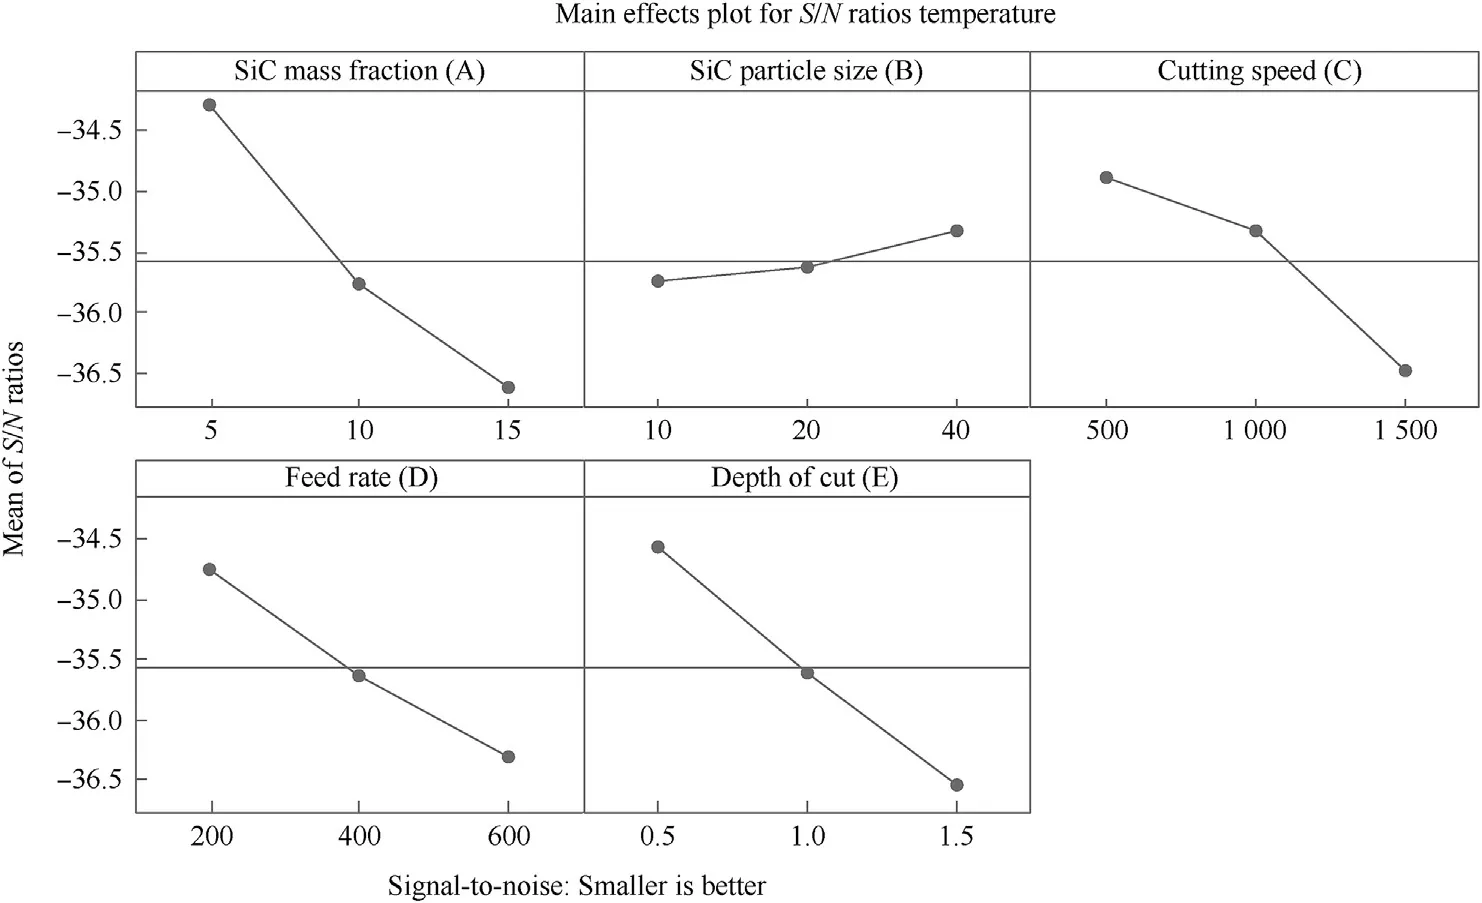
Fig.5.Mean S/N ratio graph for temperature.
Fig.5 describes the optimal parameters to maintain the minimum temperature during the experiment and is A1B3C1D1E1.Increase in weight percentage of SiC is the main aspect which influences the rise in temperature during the milling process.Increase in weight fraction of SiC leads to higher hardness value,and harder composites are difficult for machining,resulting in an increase in the temperature.Increase in DOC increases the contact between the tool and work and a large number of chips are removed from the workpiece[28].A large amount of heat is generated within a very small moment and shorter contact time between the tool and workpiece results rise in temperature[29].
Fig.6 shows the optimum input parameters combination for higher MRR as A1B3C3D3E3.The 40 μm size SiC at 5%,600 mm/min of feed rate,1500 rpm of cutting speed and 1.5 mm of the depth of cut are the optimum parameters for higher MRR.The MMC with 40 μm size SiC particles reinforced at 5%exhibits the lower hardness and it is familiar that the lower hardness composites can be machined easily;hence the material removal rate is very high for the MMC with lower weight percentage reinforcement[30].Increase in weight percentage and decrement in size of the reinforcement increases the hardness of the MMC, so the MRR decreases with increase in reinforcement content and reduction in reinforcement particle size[31].
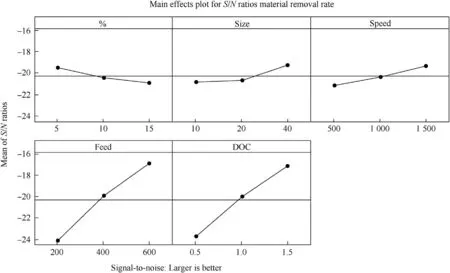
Fig.6.Mean S/N ratio graph for MRR.
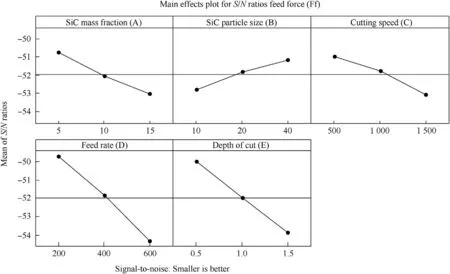
Fig.7.Mean S/N ratio graph for feed force.
During the machining process,cutting force is an important factor to be measured.When cutting force increases it results in tool wear,breakage of the tool and poor surface quality[32].The cutting force is divided into three components namely feed force,radial force and tangential force and from Fig.7,it can be noted that A1B3C1D1E1 is the optimal parameters for minimum feed force.As a result of more energy is required for machining operation which tends to increase in feed force[33].Increase in the percentage of reinforcement shows the high feed force due to an increase in the hardness of the material[30].
From Fig.8,the optimum combination for minimal radial cutting force(Fr)can be noted as A1B3C1D1E1.The increase in DOC increases the radial cutting force predominantly because the contact between the tool and the workpiece increases the rotation direction[34].The cause for the increase in cutting force with higher feed rate is due to the increase in chip load per tooth at maximum feed rate[35].At maximum speed,the cutting force increases due to unevenness of chip formation which causes considerable changes in chip thickness which leads to an increase in cutting force[36].
From Fig.9 it can be noted that the optimum combination for tangential cutting force is A1B3C1D1E1.Due to the increase in feed rate more material is removed from the workpiece also built up edge is formed which creates difficulty in machining and it tends to increase the cutting force.The hardness is increased at the addition of a high percentage of ceramic particles in the matrix which results in an increased cutting force.Also with the increase in depth of cut and cutting speed,the point of contact of flute length of the tool is increased which leads to tool chattering and hence tangential cutting force increases[37].Also at a high feed rate,there is a greater impact on tool and work material;at this case,the cutting force are faintly increased[38].
4.2. Regression model analysis
The regression models are used to the made correlation between among the unknown parameters, independent and dependent variables. Equations of 7—12 shows the regression models generated from the general linear model.
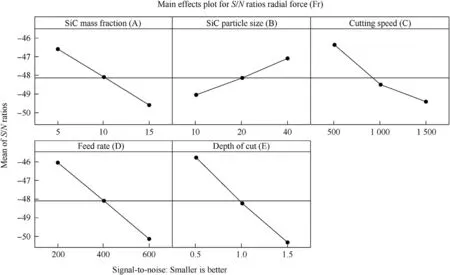
Fig.8.Mean S/N ratio graph for radial force.
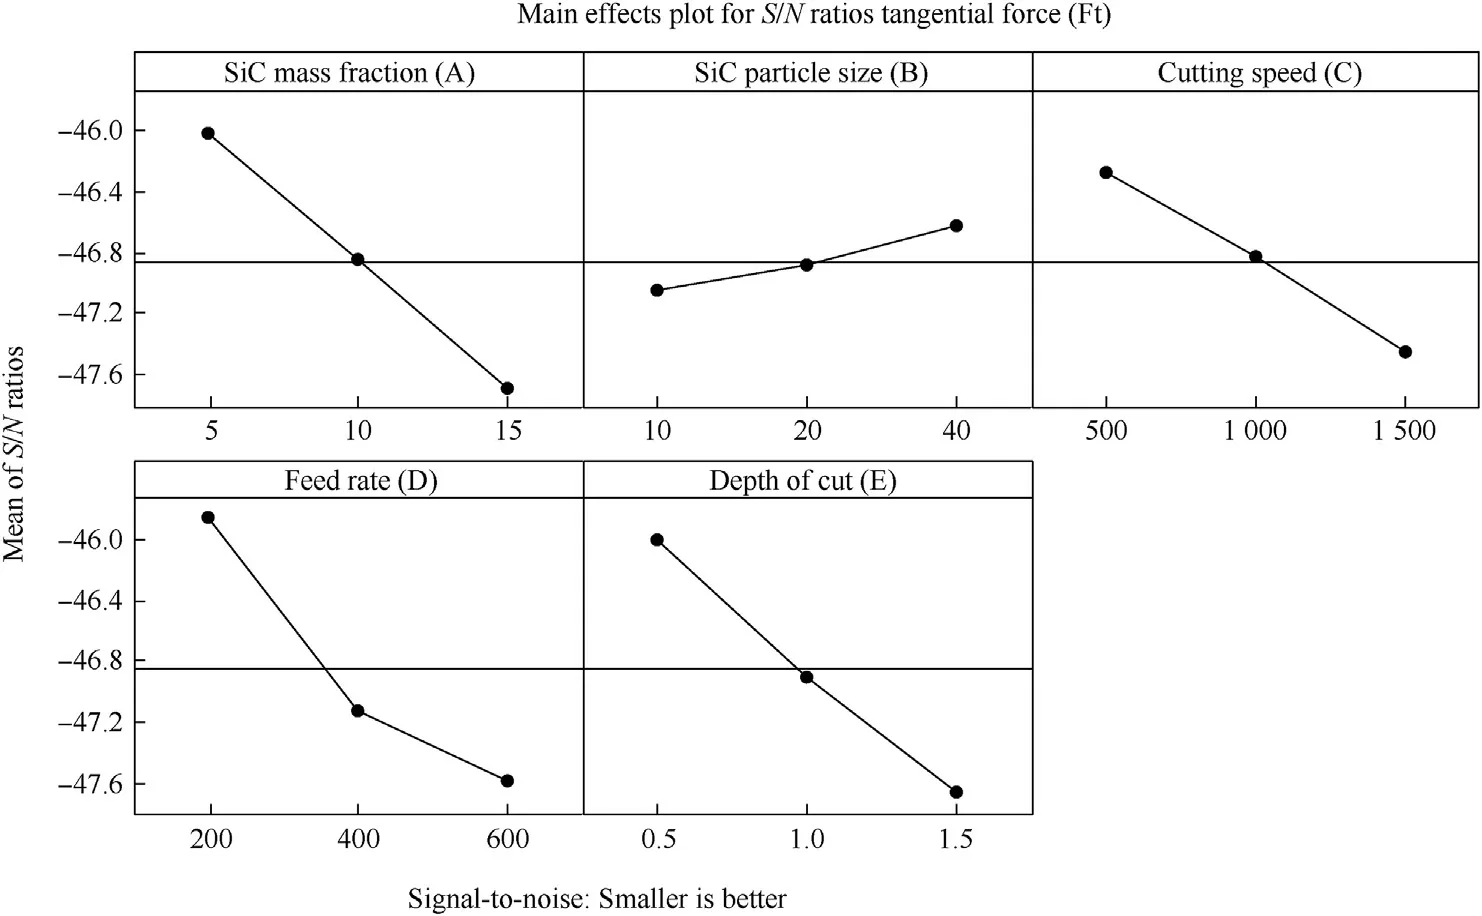
Fig.9.Mean S/N ratio graph for tangential force.
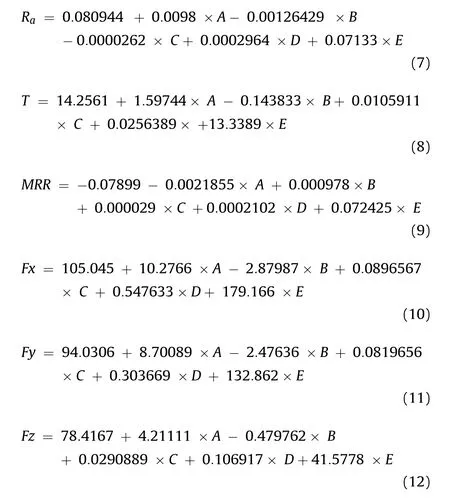
Where,A-Wt%of SiC,B-Particle Size of SiC(μm),C-Cutting Speed(rpm),D-Feed(mm/min),E-Depth of cut(mm).In this study,the predicted experimental results by regression equation are further compared with the ANN model.
4.3. Artificial Neural Network analysis
The connectionism systems/Artificial Neural Networks(ANN)are the most efficient computational algorithm,to the finding of an optimal solution in any situation the best solution can obtain based on the expert of training of the system.All the 27 experimental results were used for training the ANN model.The predicted response values through ANN are compared with mathematical model and Taguchi results and that are represented graphically from Fig.10 to Fig.15.The efficiency of each model is assessed by using the R2value of model[39]i.e.higher the R2value in the model performs better than other models.The residual plot of models for surface roughness is given in Fig.8.From the plot,the R2value of ANN,regression and Taguchi model are 98.18%,96.14%,and 97.73%.It is clear that the ANN model performs well for surface roughness prediction when compared with others.Similarly,the residual plot of models for temperature has been represented in Fig.9.
From Fig.10 it is incurred that,ANN model predict temperature with less error than the regression model.The R2value of the regression model for temperature during the milling process is 96.02%whereas the R2value of the ANN model is 98.63%.Likewise,the ANN model for material removal rate and three cutting forces can estimate with less error when compared other model which are explained in Figs.11—15.It is understood that the ANN model seems to be good for estimating the surface roughness,MRR,temperature and cutting force.
4.3.1. Cross-validation
In order to predict the accuracy of the model 5 fold Crossvalidation has been adopted as shown in Fig.16,also known as rotation estimation,if the objective is the prediction,then it is important to know how a model will generalize to variable data while learning.Thus it helps to understand the accuracy of the predicting model during trial runs.The initial stage of the crossvalidation involves the partition of data's into many subsets which includes an equal number of samples.One subset will be analyzed called training set while validating the other subset called training set.This is a continuous process where different subsets will be analyzed in order to reduce variability.And the average of all the subsets has been determined and verified and which is shown in the Table 5.The average of each response variables justifies the predicted outcome of the training and testing model is obtained by the formula given below
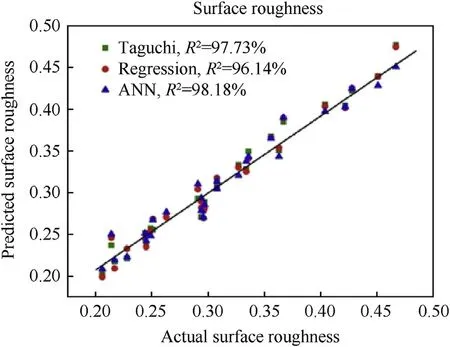
Fig.10.Predicted value of experimental vs regression vs ANN model on Surface roughness.
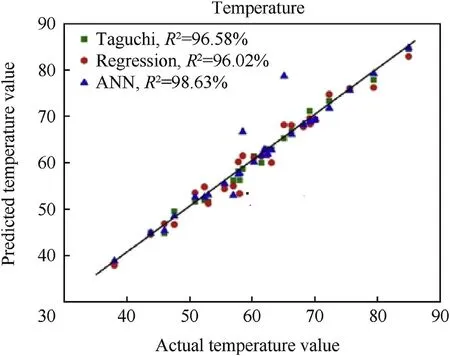
Fig.11.Predicted value of experimental vs regression vs ANN model on Temperature.
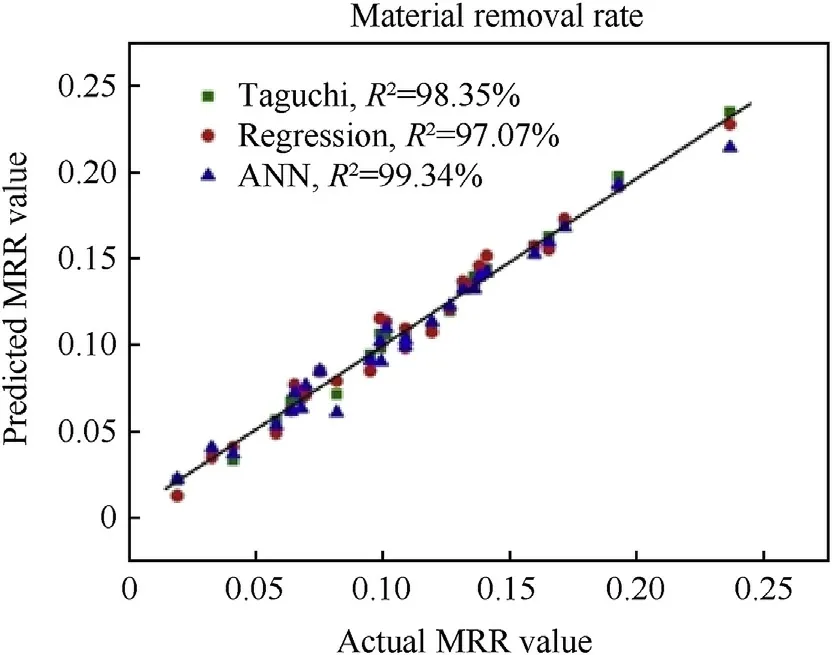
Fig.12.Predicted value of experimental vs regression vs ANN model on MRR.

4.4. Grey relational analysis
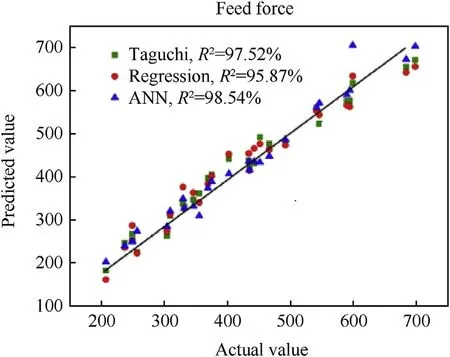
Fig.13.Predicted value of experimental vs regression vs ANN model on Feed Force(Ff).
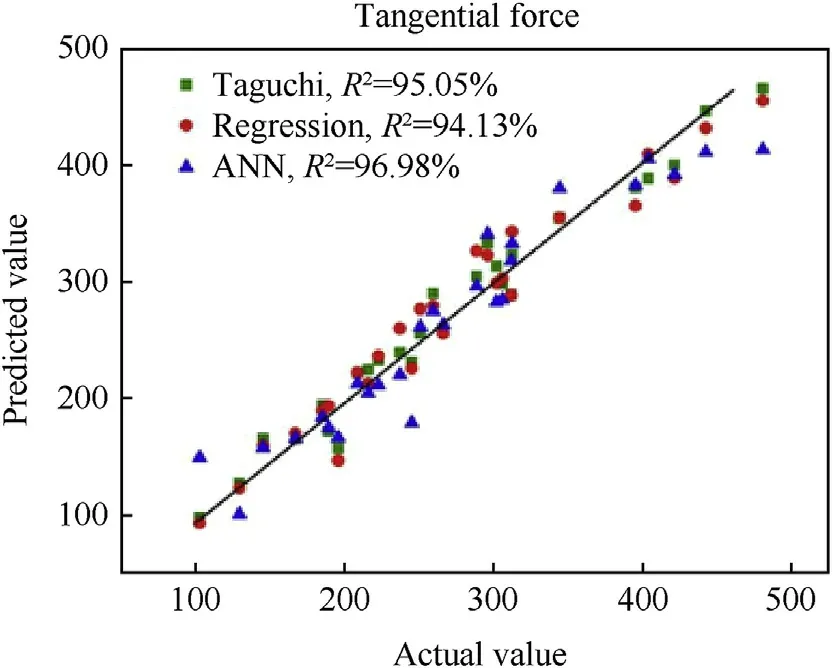
Fig.14.Predicted value of experimental vs regression vs ANN model on Radial Force(Fr).
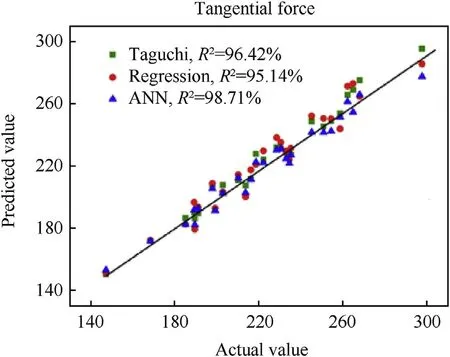
Fig.15.Predicted value of experimental vs regression vs ANN model on Tangential Force.
The Taguchi method is a robust statistical method to identify and capable to solving a single objective optimization problem.In order to find the optimum combination for multiple response functions,GRA is pursued.Table A1 shows the normalized value for output variables.
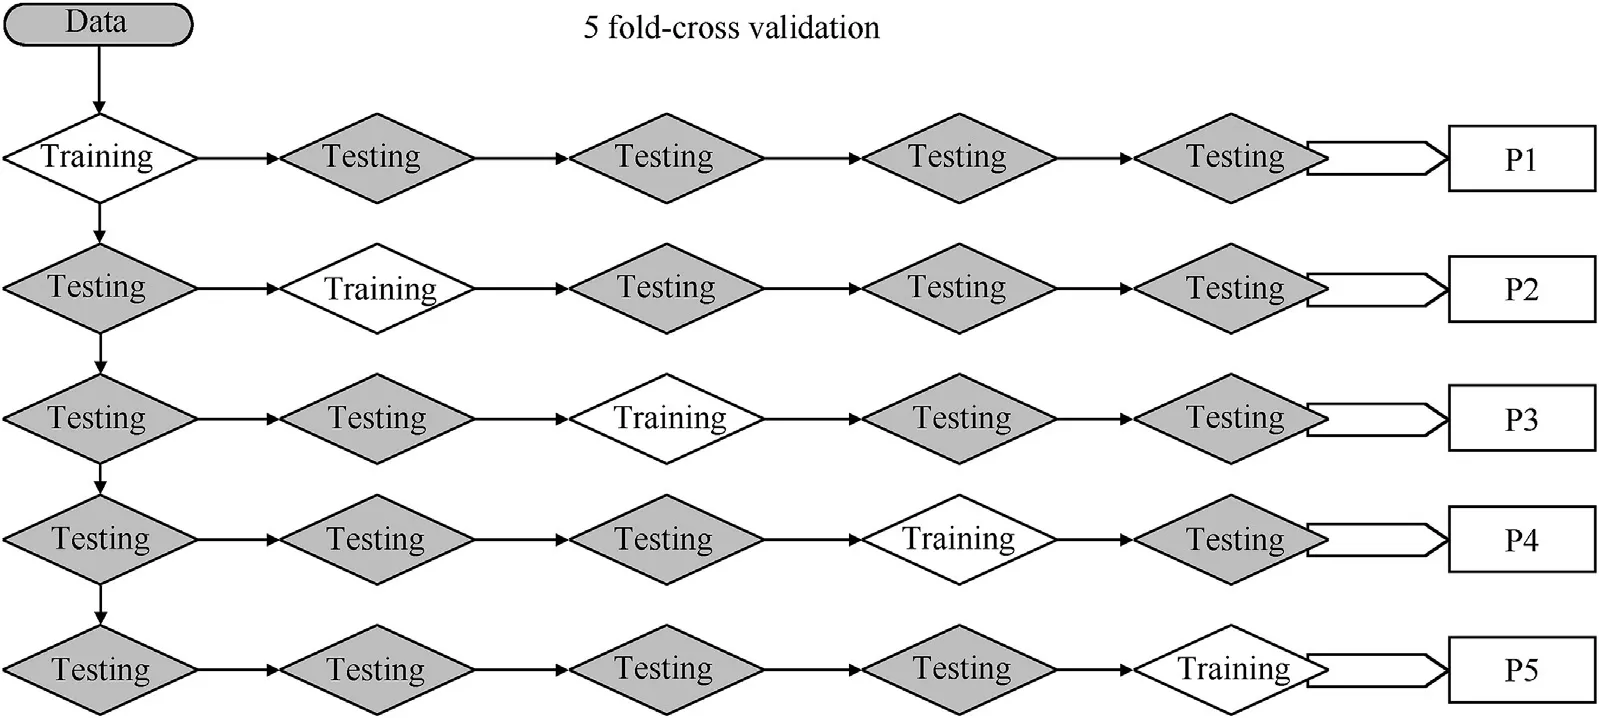
Fig.16.5 fold-cross-validation.
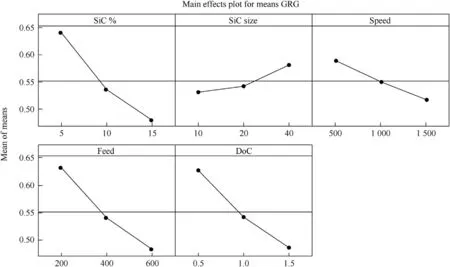
Fig.17.Mean S/N ratio graph Grey relational grade.

Table 5 Average of subsets.
Table A2 shows the grey relational grade calculated by average of the sum of the GRC.The higher value of grey relational grade shows the optimum combination of process parameters.Table 6 shows the mean value of GRG and the total mean value of GRG for each input process parameters of grey relational grade.The optimal combination of response parameters by grey relational grade is shown by the mean effect graph.GRG result proves that the percentage of SiC is the dominant factor which affects the response parameters shown in Fig.17.A1B3C1D1E1 is the optimal combination of the input parameters for milling of AMMCs identified by GRA.This function represents the finest combination for milling of aluminium hybrid metal matrix composites using multi-objective grey analysis.
4.5. ANOVA for grey relational grade
Analysis of Variance(ANOVA)is performed to find the significance and percentage influence of process parameter over the quality and characteristics.Table 7 shows the ANOVA results for grey relational analysis.Based on the percentage of contribution,the most dominating factor for milling operation is a percentage of addition of reinforcement (SiC) to the composites, feed ratefollowed by the depth of cut,cutting speed and particle size of SiC are the factors which influence the milling quality of the AMMCs.

Table 6 Response table for grey relational grade.

Table 7 The ANOVA results of the analysis for grey relational grade.

Table 8 Comparision results between initial and optimal machining parameters.
4.6. Confirmation experiment
By grey relational analysis,the optimal combination of the process parameters is identified to improve the milling characteristics.The final stage of GRA is to verify the obtained optimum condition for multi-objective quality characteristics through confirmation experiments.The equation for confirmation experiments can be expressed as[32].

Where ρttotal mean of the grey relational grade is, ρmis mean of grey relational grade at optimum level and‘n’is the number of milling parameters.The optimum combination for input control parameters is A1B3C1D1E1 and calculated grey relational grade by equation(13)is 0.6863.Table 8 shows the confirmation experiment for response parameters.It can be noted that the experimental value of surface roughness,temperature,cutting forces and MRR are considerably enhanced by GRA.
5. Conclusion
In this present study,A novel method was adapted to find the effect of machining parameters of innovatively developed hybrid composites. A single objective function and a multi-objective function named Taguchi design based grey relational analysis were adapted to find the optimal combination of the input process parameters, for lowering the surface roughness, cutting force,temperature and to attain higher material removal rate in dry milling condition.
1.By Taguchi,s single objective function the result shows that an addition of weight percentage of the reinforcements results in higher surface roughness, temperature, cutting forces and lowering the material removal rate.At the same time increase in particle size of the composites tends to decreases in surface roughness,temperature,cutting forces and increase in MRR.
2.The predicted value of experimental data proposed by the ANN model is much more significant than the regression model for every response parameters in the milling of these AMMCs.
3.The optimal combination of input parameters identified by GRA is lower reinforcement percentage,speed,feed,depth of cut and higher particle size.ANOVA results that the GRG reveal the weight percentage of SiC,feed rate and depth of cut are the most influencing parameters which affect the output parameters.
4.Finally,the confirmation test outcome results unveil that the GRG value is increased by 0.215.
Appendix A

Table A.1 Normalized value for response parameters
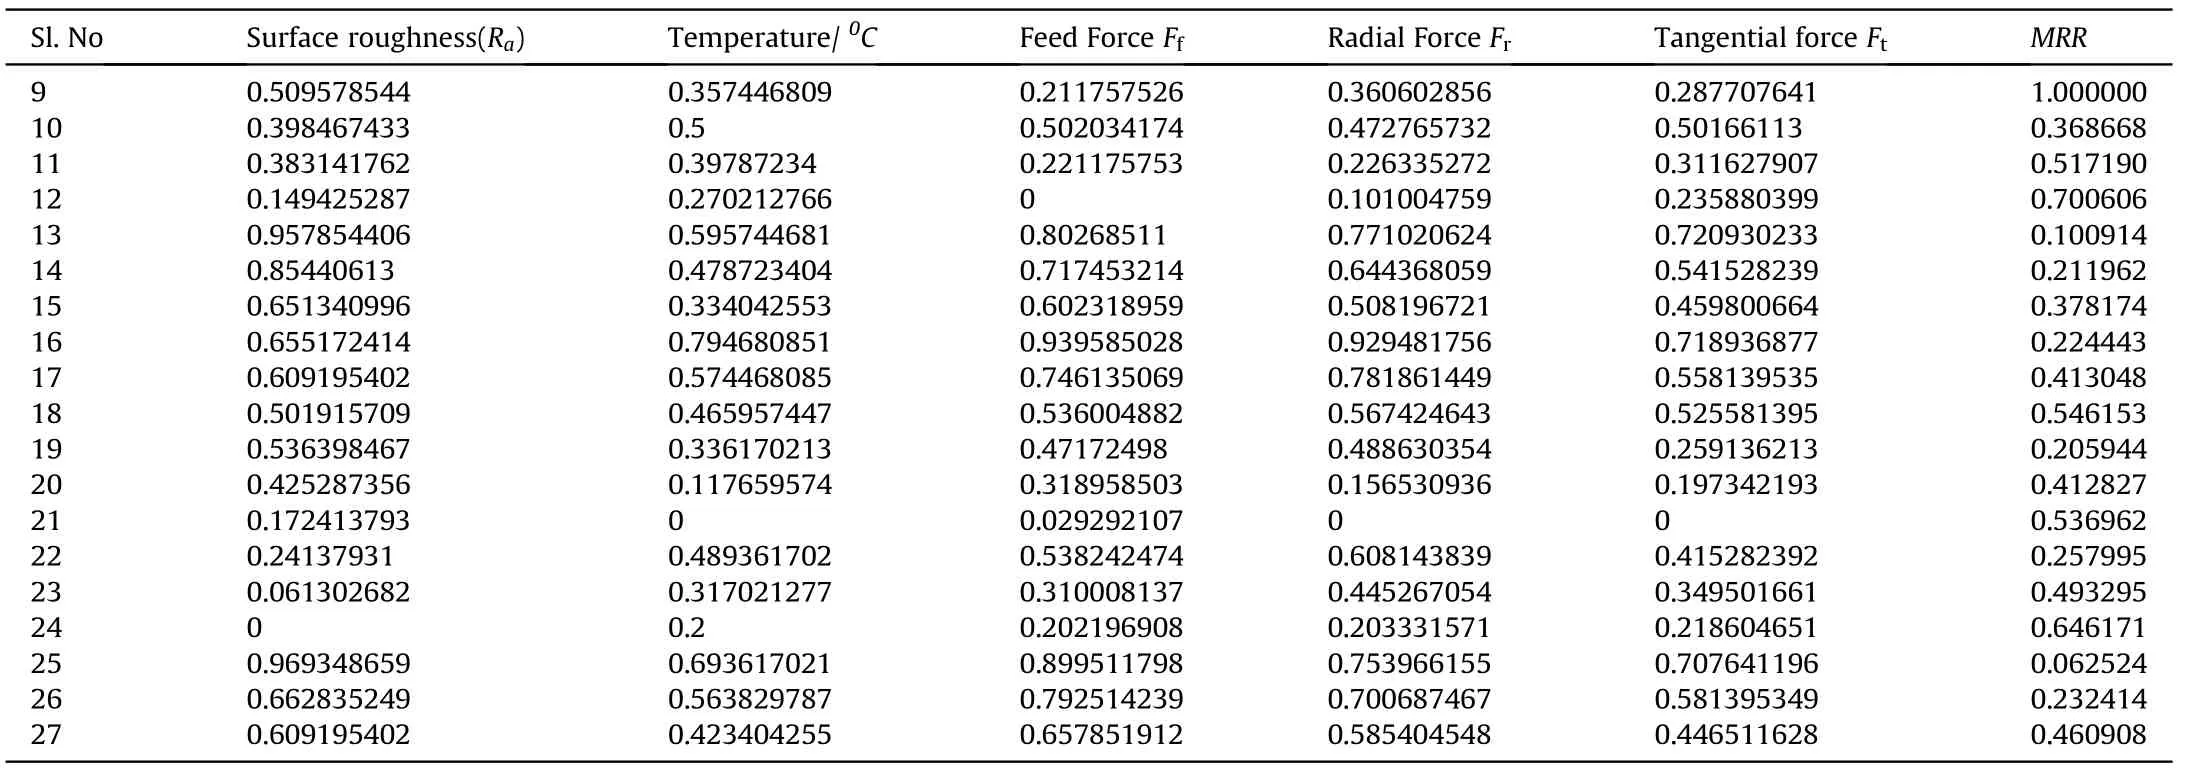
Table A.1(continued)
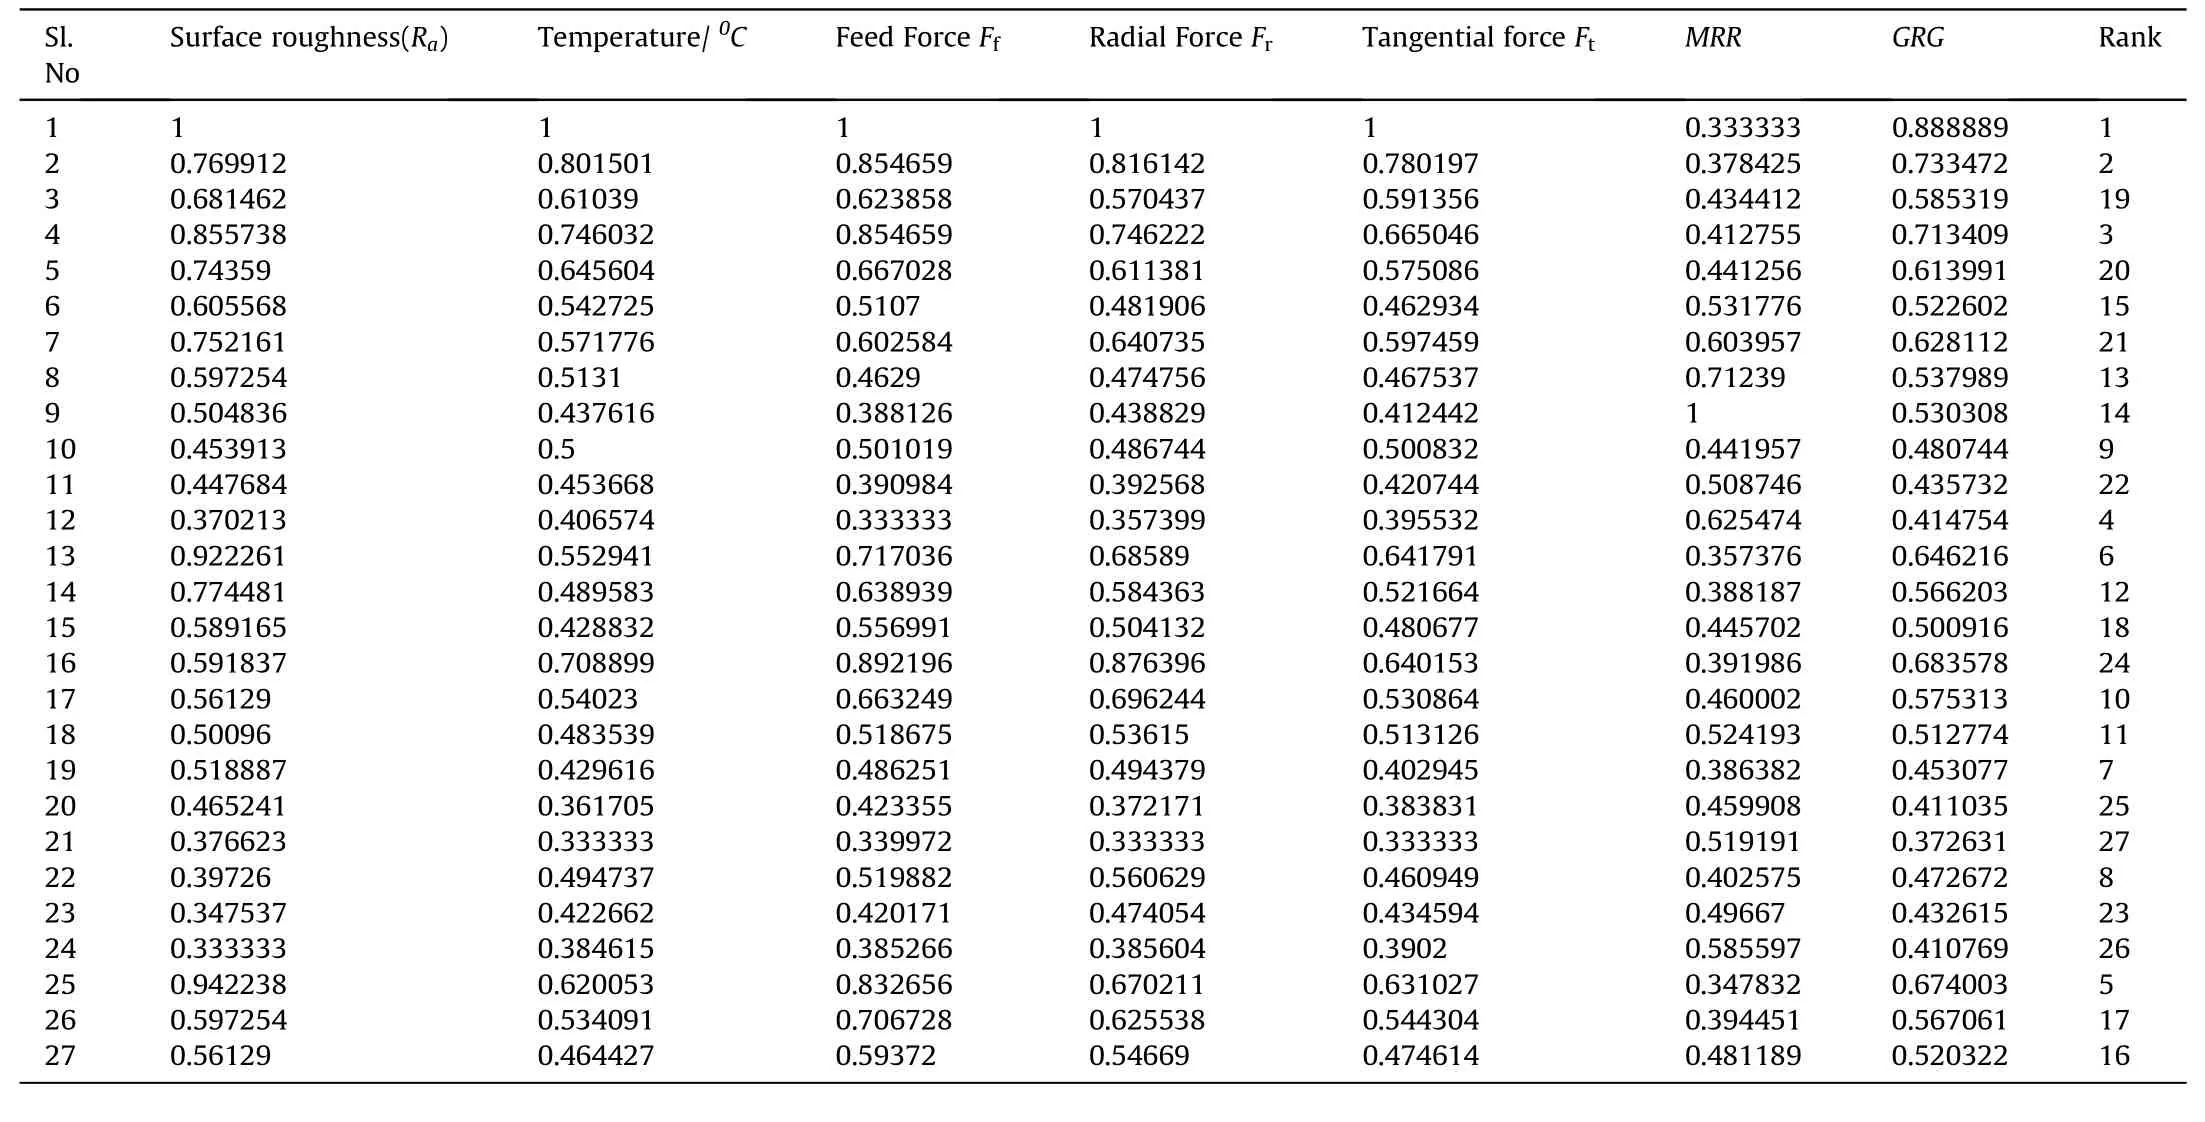
Table A.2 Grey Relational Co-efficient and Grades
杂志排行
Defence Technology的其它文章
- Modeling on the shock wave in spheres hypervelocity impact on flat plates
- Insensitive high explosives:IV.Nitroguanidine—Initiation&detonation
- Effect of energy content of the nitraminic plastic bonded explosives on their performance and sensitivity characteristics
- Effect of wave shaper on reactive materials jet formation and its penetration performance
- A comparative study for the impact performance of shaped charge JET on UHPC targets
- The role of crystal lattice free volume in nitramine detonation
