Modeling on the shock wave in spheres hypervelocity impact on flat plates
2019-10-31KenWenXiaoWeiChenDeNingDi
Ken Wen ,Xiao-Wei Chen ,De-Ning Di
a State Key Laboratory of Explosion Science and Technology,Beijing Institute of Technology,Beijing,100081,China
b Institute of Systems Engineering,China Academy of Engineering Physics,Mianyang,Sichuan,621999,China
c Advanced Research Institute of Multidisciplinary Science,Beijing Institute of Technology,Beijing,100081,China
Keywords:Hypervelocity impact Shock wave Numerical simulation Debris cloud formation
A B S T R A C T In hypervelocity impacts of projectiles into thin flat targets,shock initiation and interaction dominate the responses of projectiles and targets,and especially dominate the features of the debris cloud.To estimate the geometric features of the wave front during the first complete propagation in the sphericalprojectile,the Geometric Propagation Model(GPM)is built in this paper to describe the geometry of the shock wave front,which proposes an ellipse contour as a function of time and equivalent speed.The GPM identifies the geometric features of the wave front as a function of time and impact velocity successfully.Combined with the GPM and SPH simulation,the shock pressure distribution and attenuation in the spherical-projectile have been obtained.Meanwhile,the attenuation of shock pressure and speed are presented as a function of impact velocity,respectively,and a method for obtaining the equivalent speed of the shock wave is proposed by the GPM.The GPM may be applicable to hypervelocity events involving any monolithic materials as long as the equivalent speed could be supplied from numerical simulation.The GPM proposed in this paper and the corresponding shock wave analysis provide a new insight into the processes of the quantitative analysis of the initiation of the debris cloud.
1. Introduction
Hypervelocity impacts of spheres and flat plates as well as the jetting,spallation and debris cloud generated afterwards have attracted widespread attention.The impact jetting and spallation are deemed to plausible mechanism for the generation of tektites[1,2].The formation of debris cloud distributes the momentum/kinetic energy of the projectile,thereby reducing its threat to underlying structure.The Whipple shield based on this phenomenon has been widely applied and improved in spacecraft protection[3—7].Remarkably,Piekutowski[8,9]conducted a series of hypervelocity impacting experiments of aluminum alloy projectiles and plates in the 1990s,providing a number of data and photographs,which is of great significance in this research field.
Understanding the evolution of shock wave in hypervelocity impact events makes sense for the theoretical studies of the formation of jetting and debris cloud [1—3], locating HVIcommitted damage in space structures [10,11], and dynamic behavior of materials[12,13].However,insofar as observed,a direct measurement of the shock wave in experiments is difficult to achieve under current experimental technology,so the theoretical analysis and numerical simulation are the main methods for studying the actions of shock wave in hypervelocity impact events.In terms of theoretical works,Ang[14]proposed the jet initiation model(JIM)analyzing the shock wave propagation before the jet initiation.The JIM derives the critical conditions for the jet initiation and thus divides the shock wave propagation process into two stages:before and after the jet initiation.Grady and Kipp[12]discussed the dynamic fragmentation of materials based on the JIM and conservation of energy.Johnson et al.[1]used the JIM and thin plate theory to analyze the jet of meteoroid hypervelocity collision events.Miller et al.[3]considered the shock wave within the sphere as a planar shock wave and developed an analytic ballistic performance model of Whipple shields.In terms of numerical simulation,Kipp et al.[15]simulated the fragmentation of materials caused by shock waves.Alme and Rhoade[16]and Piekutowski[17]estimated the phase state of material in debris cloud based on the simulation of the shock pressure on the wave front and the impact-induced phase change theory.Kurosawa et al.[2]modeled the spallation process during vertical impacts over a range of impact velocities from 6 to 21 km/s to explore mechanism for material exchange between two planetary bodies.However,the geometry and physical properties of the wave front are not considered in detail in these works.
In the view of the bottleneck of today's scientific regime,the geometric propagation model(GPM)is first deduced,which propose an ellipse in two-dimensional axisymmetric coordinate(corresponding to an ellipsoid in three-dimension space)to describe the wave front of the first complete propagation in the projectile.Then,aluminum projectile hypervelocity impacting on aluminum plate is simulated by employing Smoothed Particle Hydrodynamics method(SPH)to verify the model.At last,combining with the GPM and SPH simulation,the physical characteristics of the wave front are further analyzed.
2. Initial stage of collision
Regarding the impact-induced jet,Ang[14]proposed a Jet Initiation Model,which also described the shock wave propagation of spheres hypervelocity impacting targets during the initial stage.
As shown in Fig.1,the collision point A(A′)represents the new contact point of the projectile and target.The figure also illustrates the impact angle α between the target surface and the tangent surface of the projectile at the collision point,and the projectile radius and the initial impact velocity are R and V0,respectively.vATand vAPare the collision point velocity along the target and projectile surface,respectively.The shock wave originates from the collision point A(A′)and propagates forward into the material spherically with shock speeds USTand USP,respectively.
The collision point velocity along the target surface,the collision point velocity along the tangent surface of the projectile,and the angle can be obtained as following,
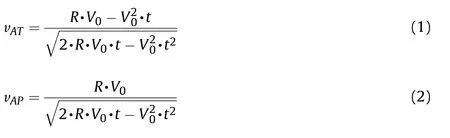
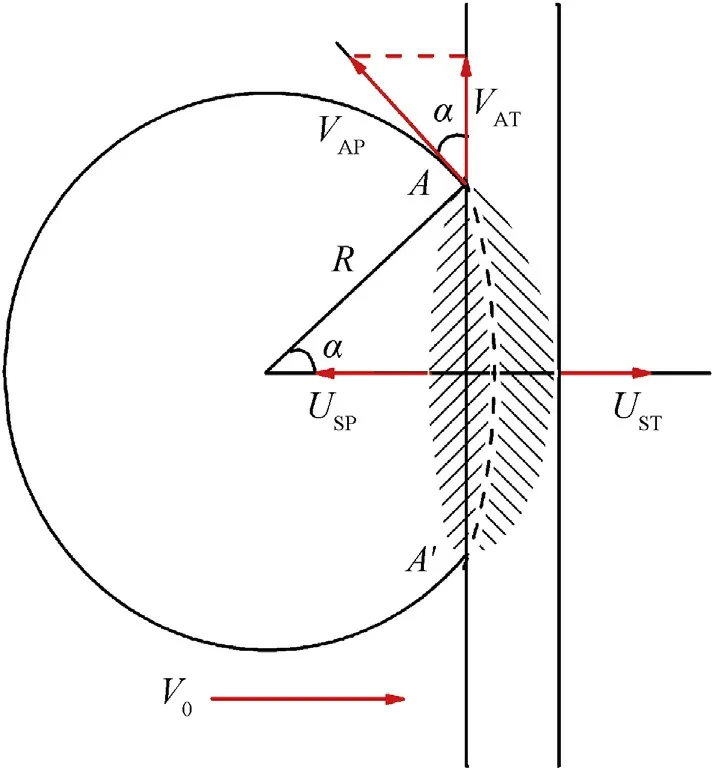
Fig.1.Schematic of the impact area.
It can be seen from Equations(1)and(2),the velocities of A(A′)along the projectile and target surface are continuously reduced during penetration.Ang[14]argues that the shock wave is quasione dimensional when the collision point A(A′)is moving faster than the shock wave propagation.Conversely,rarefaction wave will generate,then the projectile and/or target material destructs and the jet initiates.
In general,for known hypervelocity impact conditions,the Lagrangian shock speeds,USTand USP,could be derived with the Hugongiot relations(Equation(4))and the interface conservation equations(Equation(5))[14],
where M and N are parameters in the Hugoniot relations and the subscripts P and T stand for the projectile and target,respectively.UPPand UPT,are the particle velocities(the change of particle velocity due to the shock wave) for the projectile and target,respectively, and ρPand ρTare the material densities,correspondingly.
The JIM is only applicable in the initial stage for the propagation of shock wave(within the range t <t0).That means,the shock wave propagation is quasi-one-dimensional before the critical time t0,and becomes sophisticated later.Separated by the critical time t0,the first complete propagation of shock wave in the projectile can be divided into two stages:from the initial contact of the projectile and target to t0is the first(initial)stage;from t0to the time at which the wave front reaches the rear end of the projectile is the second stage.
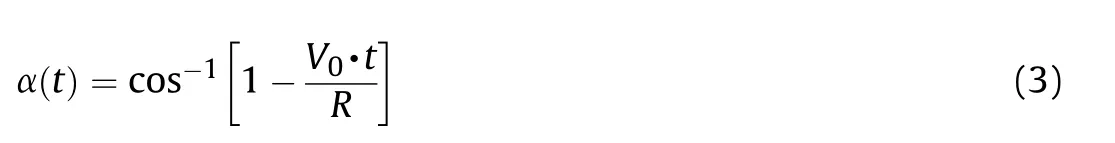
Piekutowski conducted a series of hypervelocity experiments of spherical projectiles impacting on thin targets in the 1990s[8,9],and analyzed the experimental results based on the JIM,where the AL 6061-T6 target thickness is 2.2 mm,and the radius R of the AL 2017-T4 spherical projectile is 4.8 mm.In order to simplify the problem,the target and projectile material are treated as the same approximately,and thus we have UPP=UPT=V0/2,USP=UST,which could be derived from Equations(4)and(5).For aluminum material,the Hugoniot parameters M is 5.38 and N is 1.34 in Equation(4)[8].The critical angleα0can be calculated for aluminum material,
It can be seen from Equation(6)that,the smaller the impact velocity is,the smaller the critical angle will be.It should be noted that,the critical angle of shaped charge jet increases with the increase of the impact velocity[18],that is analogous to the conclusion here.
For known impact velocity V0=6.7 km/s the critical time t=t0≈0.12 μs could be obtained from Equation(1)when the shock speed USTis equal to the point A(A′)velocity vATalong the target surface,as shown in Fig.2.
The JIM is meaningful in hypervelocity impact research,which describes the wave propagation and evolution before the jet initiation,and clearly defines the two stages of the wave propagation.However,the JIM is only applicable in the initial extremely short time.Propagation and evolution of the wave front after the first stage directly control the feature of debris cloud,and the further analysis still has important engineering significance.
Fig.2.Velocities versus time after impact of AL-AL[14].
In the next Section the first complete propagation of shock wave in the spherical projectile is described and a geometric propagation model represented by an ellipse in two-dimensional axisymmetric coordinate(corresponding to an ellipsoid in the three dimensional space)to characterize the wave front will be deduced.
3. Geometric propagation model of wave front
After the generating of rarefaction wave in the projectile,the shock wave propagation gets into the second stage,and its propagation and evolution become complicated. Simulation results[15,16] indicate that the amplitude of shock wave deceases constantly because of the rarefaction unloading and geometry dissipation,but the geometric shape and propagation speed of the wave front remain basically quasi-steady unchanged.Based on these investigations,it cloud be assumed that the shock wave front in the projectile remains geometrically undistorted,and propagates toward the rear of the projectile at an equivalent speed in the second stage,while variable U is used to represent this equivalent speed.
It must be stated that if the amplitude of shock wave decrease,the wave speed should decrease accordingly.The equivalent speed assumption here should be interpreted strictly as that the velocity attenuation is small enough to simplify the theoretical derivation.To discuss the rationality of the assumption of the equivalent speed,a detailed analysis of the propagation speed will be conducted in Section 6.
Based on the equivalent velocity assumption,the first complete propagation of shock wave in the projectile is described as follows:after the initial contact of the target and projectile,the shock wave immediately generates at the collision point A(A′),and propagates into the projectile at the equivalent speed U.
To model the shock wave propagation described above, a“reverse-ballistic”event is used here,and the two-dimensional axisymmetric coordinate system is established with the origin point setting on the initial contact point.As shown in Fig.3,the solid line circle indicates the projectile with radius R,and two vertical dash lines represent the position of the target at t and t1,respectively,and the equivalent speed is presented with U.
The time t1at which shock wave generates at y1in the projectile is(the initial projectile-target contact time is zero),
Fig.3.Schematic of shock wave propagation.
At time t,the axial displacement of the shock wave from y1is l(t ≥t1).

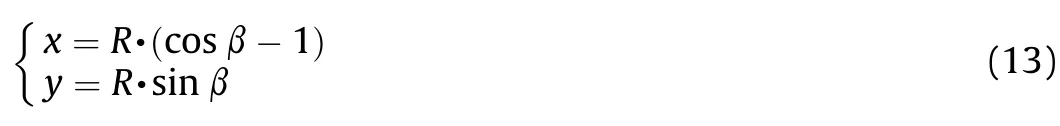
The position of the wave front x and y at time t could be deduced as following,
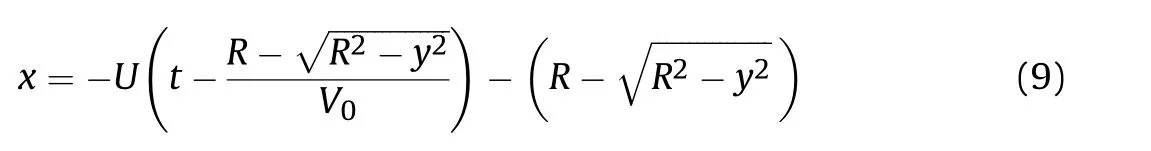
An elliptic equation is obtained by re-arranging Equation(9).
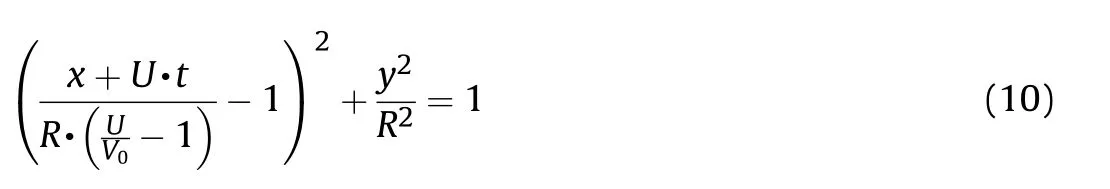
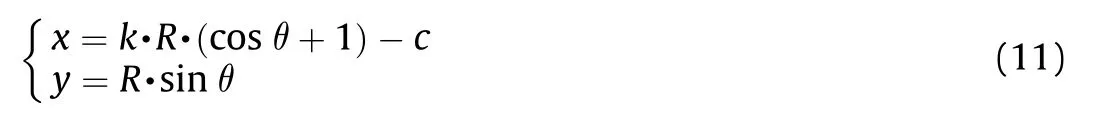
Obviously,the wave front contour based on this assumption is an ellipse,which is presented as the red dash line in Fig.3.Meanwhile,the ellipse should be translated to an ellipsoid by revolving around x axis in three-dimension space.With the introduction of ellipse parameters θ,the shock wave geometric propagation model can be expressed as,
The above derivation is carried out on the premise of the direct contact between the projectile and the target,and its scope of application is t ≤tm=.However,based on the equivalent speed assumption,the wave would propagate into the projectile with its shape unchanged,subsequently after the critical time tm.So the arccan still be regarded as the wave front.Therefore,the scope of application of the model may extend to the whole first complete propagation process,i.e.,t ≤tl=It is worth noting that the above derivation does not involve the material properties of the projectile and target,so it is applicable to the hypervelocity impact events of any material.
The parameter c is the product of the propagation time t and the equivalent speed U,representing the distance that wave front has moved along the axial direction.Position of the ellipse in the projectile can be ascertained with this parameter.The long axis of the ellipse described by Equation(11)is constant 2R and the short axis is k⋅2R.Parameter k is the ratio of long and short axes,which reflects the geometric curvature of the ellipse.The magnitude of k is determined by the ratio of the equivalent speed U and the initial impact velocity V0.A larger k states a larger elliptical curvature.
In Equation(11),R is the radius of the projectile,V0is the impact velocity,and U is the equivalent speed of the wave front.If the three parameters above are known,the ellipse(ellipsoid)described by the geometric propagation model would be determined.At the initial moment of impact,the ellipse(ellipsoid)is tangent to the projectile circle externally,and then moves toward the projectile at the equivalent speed U.The arc A⁀A′represents the shock wave front within the projectile at any moment before the wave front reaching the rear end of the projectile.
To analyze the relationship of these parameters with the impact conditions,the propagation velocity U is assumed as the initial wave Hugoniot velocity USP,temporarily,which could be obtained from the material Hugoniot relationship(Equation(4))and the impact interface conservation equation(Equation(5)).At the same time, the parameter-1 can also be obtained directly.
Taking the example of spherical aluminums projectile hypervelocity impacting on aluminum targets,the parameter k can be obtained from Equations(4)and(5).
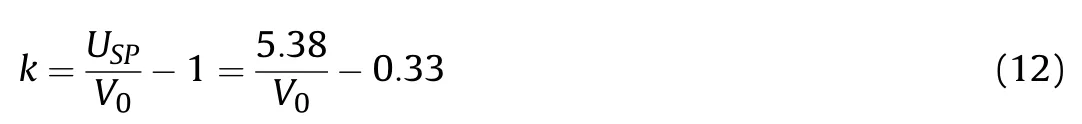
The above formula shows that the parameter k,which represents the curvature of the wave front,is inversely proportional to the initial impact velocity V0.So it can be predicted that the lower impact velocity,the larger curvature of the wave front.It should be mentioned that,due to the attenuation of the shock amplitude,the propagation velocity should be a little smaller than the initial Hugoniot velocity U <USP.This dispose is mainly for the convenience of theoretical analysis,and the error will be analyzed in detail in Section 6.
The position of the shock wave on the surface of the projectile associated with time could be obtained by the conjunction of the circle boundary of the projectile and the ellipse equation of the wave front.The circle boundary of the projectile(undeformed)in this coordinate system is
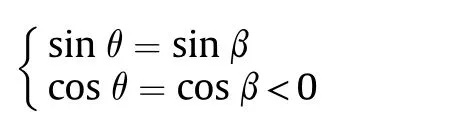
whereβ is the central angle of the circle as illustrated in Fig.3.Before the target passes over the center of the projectile,i.e.0 ≤t <,the shock wave front is intersected with the front half part of the projectile,so the following conditions should be satisfied at the intersection point.
Equations(11)and(13)yield,

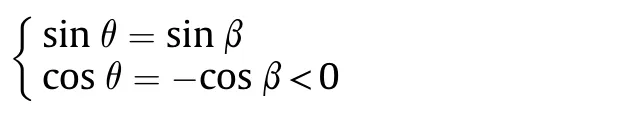
According to above analysis,the intersection point of the wave front and the projectile surface is the collision points A(A′)before the target passes through the projectile center.After the moment,the target no longer directly intersects with the surface of the projectile,and the intersection point is calculated by the wave front ellipse and the back half part of the projectile circle.Therefore, the following condition should be satisfied at the intersection point.
Equations(11)and(13)yield,
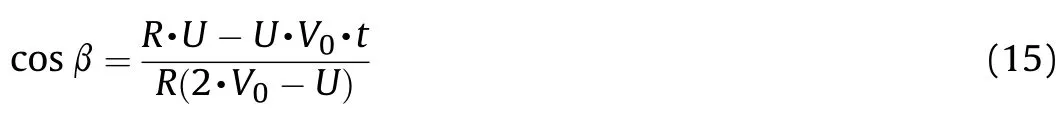
By factorizing Equation(15)and introducing the parameter k in Equation(11),the following equation can be obtained.
Note that the right part of Equation(16)is exactly the product of a coefficient decided by k and the right part of Equation(14).The relationship between the central angle β of the intersection point and the time t is obtained by the above derivation.Special attention should be paid to the fact that,whenshock wave affects the back part of the projectile and generates reflection rarefaction wave,which will directly interact with release portion after the shock front.As a result,large tensile stress and even spallation occur.Equation(16)also indicates the relationship between the position of the spallation and the time after impact,to a certain extent.
The geometric propagation model(Equation(11))based on the equivalent speed assumption is built in this section.The model forecasts the function of the wave front curvature on the impact velocity(Equation(12)),and the intersection points of the wave front and the projectile surface at certain time(Equation(14),(15)).In the following sections,this model would be verified and the physical characteristics of the wave front would be further discussed based on numerical simulation.
4. Simulation of wave front propagation and evolution
The numerical simulations with 2D axisymmetric model are performed regarding Piekutowski's experiments [8] with AUTODYN-SPH to verify the GPM and further analyze the physical characteristics of the wave front.In the simulation model,the target thickness is 2.2 mm and its height is 20 mm(40 mm in full model).Shock state equation,Steinberg-Guinan strength model and Grady spall failure model are employed to describe the target material AL 6061-T6 and the material parameters are from the AUTODYN standard library [19]. Correspondingly, Shock state equation,Johnson-Cook strength model and Grady spall failure model are collected to describe the AL 2017-T4 projectile with a radius R of 4.8 mm and the material parameters are from the literature[20].The artificial viscosity in SPH is selected as 2.5,and SPH particle size is 0.02 mm.The numerical method and parameters above have been validated in literature[21,22].
SPH particle size is set as 0.02 mm,and total 10 cases with different impact velocities have been simulated(the impact velocity varied from 2.5 km/s to 6.5 km/s,in steps of 0.5 km/s,and also 6.7 km/s).Fig.4 shows the simulation of wave propagation in the case of V0=6.7 km/s,in which the time interval between each graph is 0.1 μs and the range of the pressure amplitude is 0—50 GPa.
During the propagation of the wave,the shock pressure is attenuating constantly as shown in Fig.4,but the geometric characteristics and propagation speed of the shock wave are almost stable.This result agrees well with the literature[10,11].It is also could be seen from the simulation results that,the jet initiation time is 0.15 μs.The first stage sustaining t=t0˜0.12 μs is obtained with the JIM model,as illustrated in Fig.2,which is shorter than the time observed in Fig.4,but it is still reasonable when taking the time of jet movement into consideration.
Fig.4.Propagations of shock wave in the projectile(from 0 to 1.1 μs).
The wave front illustrated in dash line(and dash-dot line)is compared with the simulated wave front of V0=6.7 km/s,to verify the geometric propagation model(Equation(11))in Fig.4.Fig.5 also shows the comparison of the wave fronts of different impact velocity at the same time of 0.5 μs.Two attempts are made for the equivalent speed U of the geometric propagation model.One is the average velocity of the wave front calculated from simulation(based on the visual observation in Fig.4,the total propagation time 1.13uswith a 9.6 mm displacement,so the average velocity of wave front is 8.49 km/s);The other one is the initial shock velocity obtained by Hugoniot relationship(Equation(4))USP.The theoretical wave fronts obtained with these two tentative speeds are represented by black dash line and yellow dash-dot line in Fig.4,respectively.
Fig.5.Propagations of shock wave in the projectile for four impact velocities.
Table 1 Parameters calculated from Hugoniot-relation and simulation.
The theoretical wave front(yellow dash-dot line)is faster than the simulated result when the equivalent speed is set as the initial Hugoniot velocity,while the theoretical wave front(black dash line)is in well agreement with simulation when the equivalent speed is set as average velocity,as shown in Fig.4.
The shock propagation simulations at 0.5 μs after initial collisions of different impact velocities varied from 3 km/s to 6 km/s are shown in Fig.5.Good agreement is found between the theoretical wave front(black dash line) and simulated results when the attempted average velocitywas taken.
The theoretical wave fronts predicted with both of the tentative speeds correctly reflect the change of the curvature:the smaller impact velocity,the larger curvature of the wave front,as shown in Fig.5.This is consistent with the theoretical forecast made by Equation(12)for aluminums projectiles impact aluminums targets situation.
In summary,the geometric propagation model(Equation(11))correctly predicts the wave front as a function of the initial impact velocity.When the equivalent speed U is set as Hugoniot velocity,the obtained wave front propagates faster than the simulation result.However,when the equivalent speed U is set as the simulation average velocitythe model can accurately describe the geometry and position of the shock wave front.Obviously,the error of Hugoniot velocity attempt is caused by the attenuation of the wave velocity,and the attempt using simulation average velocity exactly offsets the influence of velocity attenuation.The equivalent speed in GPM should be taken as the average velocity,but the alternative attempt here is inconvenient because of the need of numerical simulation. A method to acquire equivalent speed directly would be proposed in Section 6.
5. The pressure distribution on wave fro nt
The geometric propagation model(Equation(11))has been verified by numerical simulation.On this basis,the pressure distribution on the wave front could be obtained furthermore.In SPH numerical simulation,virtual gauges may be set up to output the pressure history information of particles.When the wave front reaches a virtual gauge point,the pressure of this gauge reaches the peak of its pressure-time curve.The distribution of pressure on the wave front can be obtained from a series of peak pressure of gauges on the wave front.Combining with the wave front geometry represented by Equation(11),the locations of gauges on the wave front are determined,and the gauge's peak pressure which is exactly the wave front pressure could be obtained from the pressure history of the gauges.However,the number of the virtual gauges supported by AUTODYN is limited,so a method of segmenting the virtual gauges and getting the pressure distribution at different time successively is adopted.As an example,the gauge distribution on the wave front according to the GPM for V0=6.7 km/s,at t=0.4 μs and t=0.5 μs is shown in Fig.6,respectively,where the black diamond points are the virtual gauges on the wave front.
The pressure distribution of the wave front in the entire propagation process can be obtained by this segmentation method.The variation of pressure distribution(P-y)at different time is shown in Fig.7.
As illustrated in Fig.7,the pressure on the wave front attenuates over time during the first complete propagation process,which is consistent with the previous analysis.
In the first propagation stage,the surface of the projectile continuously collides with the target and generates quasi-onedimensional shock,and the jet or rarefaction wave from the surface of projectile has not initiated,according to the JIM.The wave has propagated for a certain distance outward the axis and it has led some attenuation to the shock amplitude.Therefore,at the beginning of the impact,the value of pressure in the impact axis is the smallest,and the closer to the surface of the projectile,the larger of the pressure is. So the distribution of P-y curves is“concave”,just as the curves at 0.1 μs and 0.2 μs in Fig.7.
As the projectile penetration and the shock wave propagation,rarefaction would generate on the surface of the projectile and evidently decrease the shock amplitude.As a result,the pressure on the surface of the projectile would decrease obviously,even below the pressure on the impact axis,and the P-y curves changes from“concave”to“flat”and then to“convex”,as shown in Fig.7.
It should be noted that the transform time is 0.2 μs in Fig.7,later than the time t=t0˜0.12 μs according to JIM.However,it is still reasonable when taking the time for curve's transformation into consideration,which is analogous with the jet initiation time in Fig.4.
Based on the GPM and numerical simulation,the pressure distribution on the wave front is obtained.Some factors,such as geometric dissipation and rarefaction unloading, decrease the pressure of the wave front continuously.At different propagation stages,the P-y curve will stay at different states.
Fig.7.Shock pressure versus y-distance at different time.
It is challenging but meaningful to calculate the peak pressure theoretically at any position within the projectile.Based on the above results,if the pressure on the axis has been obtained,the wave front pressure at any position could be estimated according to the propagation stages,which is exactly the peak pressure of the point.If the propagation is in first stage,the pressure distribution curve is“concave”.If the propagation is in the second stage,the pressure distribution curve is“convex”.
Note that the points on the P-axis in Fig.7 exactly represent the pressure on the impact-axis of the projectile,and obviously the pressure of these points deceases nearly linearly.For a quantitative analysis of the pressure on the axis,more careful study has been conducted in the next Section.
6. Attenuation of shock pressure on the axis
The shock wave theory and numerical simulation(Figs.4 and 7)confirmed the attenuation of axial pressure.Taking V0=6.7 km/s case as an example,the attenuation of axial pressure is researched with the pressure distribution(P-x)at different time,as shown in Fig.8.It concludes that the pressure attenuation is a summation of multiple nonlinear processes,but the attenuation is linear overall,and that is consistent with other literature[15,16].
Fig.6.The distribution of gauges on the shock front——(a)0.4 μs,(b)0.5 μs.
Fig.8.The shock pressure versus X-distance at variable time.
Based on the linear property of the pressure attenuation,if the attenuation of pressure ΔP has been determined,the pressure at any position on the axis could be obtained from the initial pressure obtained from“pressure-particle velocity”Hugoniot relationship.Using this idea,Piekutowski[17]analyzed the function of pressure attenuation on different thickness of targets and got the pressure at any position on the axis.
10 cases with different impact velocity but the same target thickness have been simulated. The pressure distributions at different time on the axis for impact velocity varied from 3 km/s to 6 km/s are shown in Fig.9 where the ordinates(i.e.,the pressure amplitude)are set to a constant range.It can be seen from Figs.8 and 9 that the attenuation of pressure changes with impact velocity(initial pressure).To study the relationship between the attenuation of shock pressure and initial pressure,the projectile head pressure P0,the projectile tail pressure PLand the pressure attenuation ΔP of 10 different cases are listed in Table 2.
The head pressure P0of the projectile could be calculated with Hugoniot relationship[17]:

The tail pressure of the projectile PLmay be derived from simulation,but it is difficult to get the exact tail pressure directly from simulation.Therein the tail pressure is obtained by taking intercept,as illustrated in Fig.8.The pressure attenuation ΔP is the difference between P0and PL.
The relationship between the pressure attenuation ΔP and the head pressure P0is approximately linear and easily obtained by linear fitting the data in Table 2,as shown in Fig.10.

Combining Equation(18)and linear attenuation of the pressure on the axis,pressure at any position of the axis for different head could be obtained easily.
Fig.9.The shock pressure versus X-distance at different time of variable impact velocities.
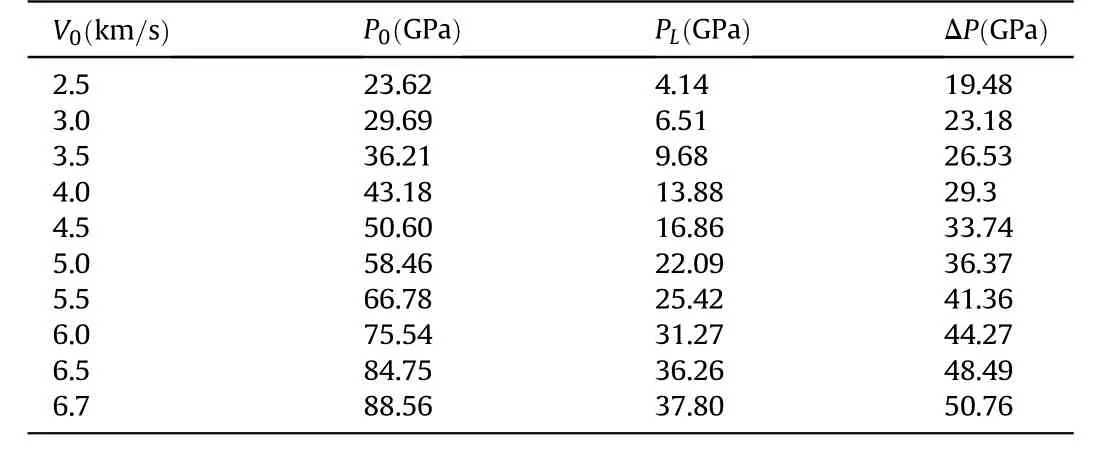
Table 2 The ΔP of central line at different impact velocities.
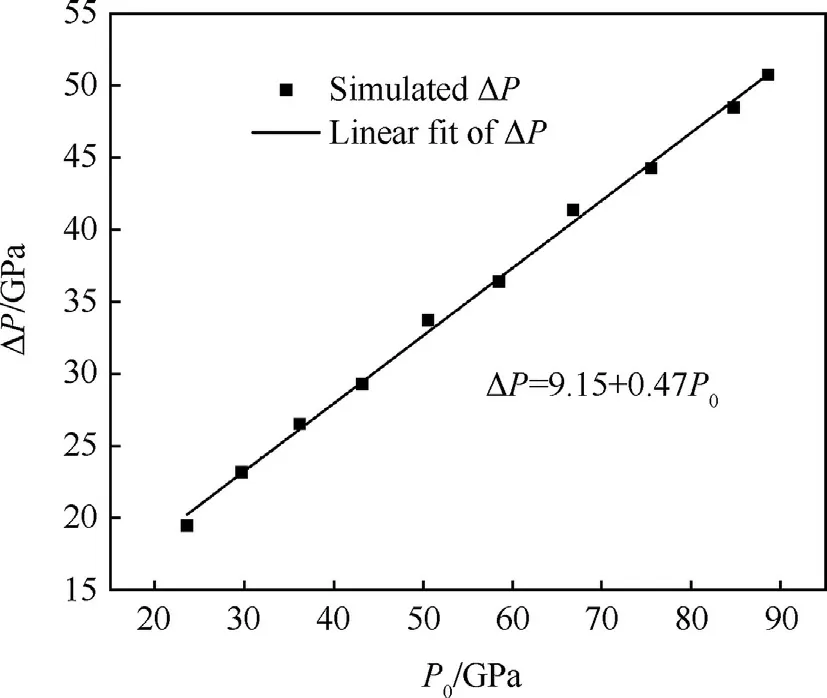
Fig.10.Linear fitting of ΔP versus P0.
So far,for the Al—Al hypervelocity impact events with known impact conditions,the geometry and position of the wave front in the projectile could be calculated with the GPM,and the pressure on the axis could be obtained with Equation(18).Then the pressure on the wave front could be estimated based on the propagation stages and corresponding distribution law of the shock pressure.In this way,the peak pressure at any position in the projectile can be obtained.
The equivalent speed U in the GPM still need to be determined through simulation and this is of inconvenience.In the next Section,a method to evaluate the equivalent speed directly would be proposed,based on the discussion of wave velocity.
7. Attenuation of wave-velocity
The wave front velocity deceases along with the pressure attenuation of wave front.Firstly we quantify the change of wave velocity with simulation method,by considering the displacement of wave front at a predetermined time interval,like 0.1 μs.
The displacement and velocity of the wave front of the hypervelocity impact case V0=6.7 km/s are listed in Table 3,where xnis the distance from the wave front to the projectile tail,lnis the displacement in the nth time interval,is the average speed in the nth time interval,and~U is the mean velocity of the whole process.As shown in Fig.11,the wave velocity attenuates monotonically with propagation,but the variation is small relatively.This also proves that the equivalent velocity assumption is reasonable.
It should be noted that there is a rising edge of the wave front pressure,and 30 GPa is set as the benchmark to acquire the position of the wave front at a certain time.The average wave velocityis 8.49 km/s obtained according to the numerical simulation,which isslightly larger than the velocity~U=8.42km/s obtained here.The difference may be caused by a rough observation of the total propagation time(1.13 μs)in previous analysis.
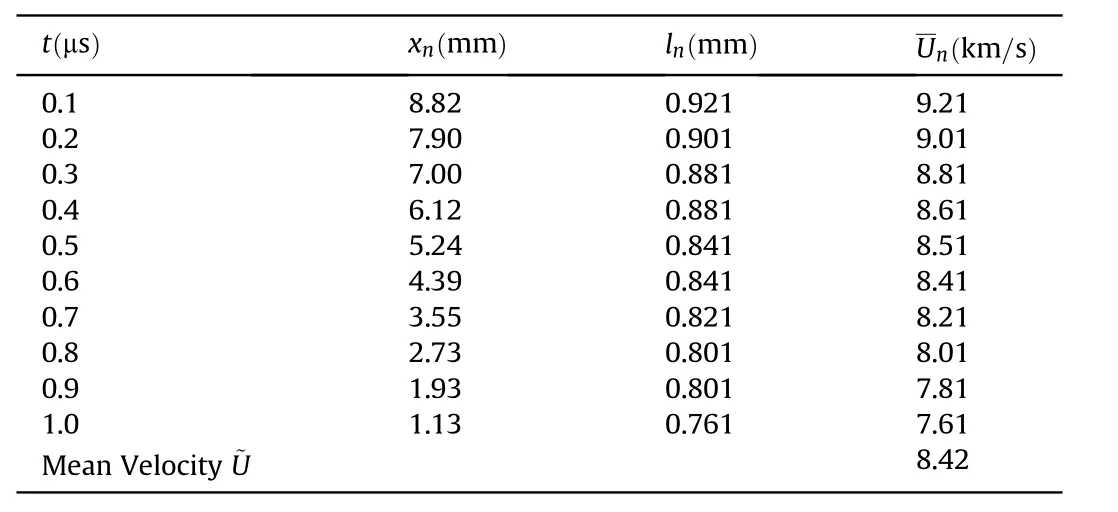
Table 3 The decrease of shock wave velocity.
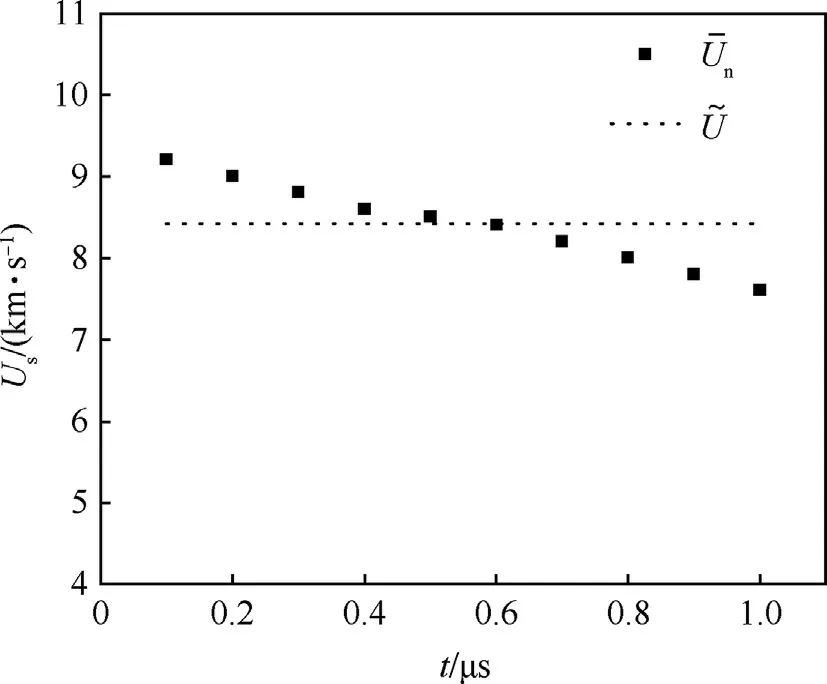
Fig.11.The decrease of shock wave velocity.
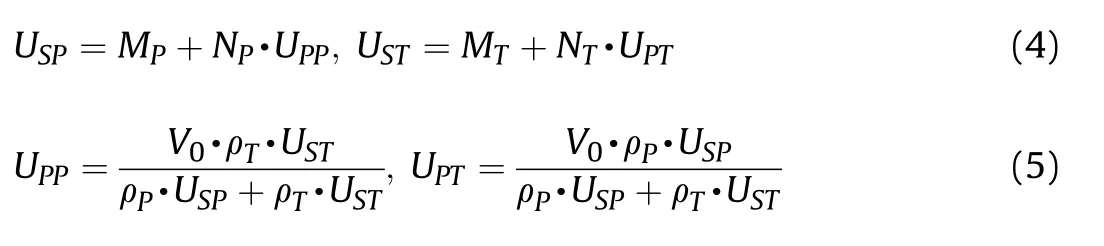
A method to obtain the equivalent speed U for the GPM based on the initial impact velocity is proposed.Combining Equations(4)and(17),the Hugoniot relationship of shock pressure and shock velocity could be obtained.

Equation(18)presents the attenuation of wave pressure,and thus the wave velocity at the head and tail of the projectile for any impact velocity could be expressed by combining Equations(18)and(19).We propose the average value of head velocity and tail velocity as the equivalent speed U,then it could be obtained from the initial impact condition directly instead of simulation.
where U0is the wave velocity at the projectile head,which is actually USPmentioned above,and ULis the wave velocity at the projectile tail,derived from Equations(18)and(19).
Taking an example of V0=6.7 km/s,the wave velocity at the projectile head U0is 9.86 km/s,and the wave velocity at the projectile tail ULis 7.80 km/s,then the equivalent speed U is the average of U0and UL,8.83 km/s.The equivalent speed U acquired in this method is close to the velocity~U=8.42km/s acquired from simulation.The wave fronts at 0.5 μs after initial impact represented by the GPM with the above two equivalent speeds are shown in Fig.12.The wave fronts are basically the same and consistent with the simulation result.
Fig.12.Example for wave-fronts predicted with above equivalent speeds.
In summary of the previous analyses,based on the GPM and the pressure distribution of wave front,the wave front geometry and physics characteristics,and the peak pressure at any position within the projectile could be obtained,in Al—Al hypervelocity impact events.And the GPM is applicable to the hypervelocity impact events of any materials and sizes,which only need to supplement the attenuation law of pressure by numerical simulation.
It should be noted that numerical simulation is one way to obtain the equivalent speed,but without numerical simulation,the GPM is still available.For example,if the GPM is used completely independent,the equivalent speed in the GPM could be set as the Hugoniot shock velocity.In this situation,the difference between the prediction and the simulation would be a little large relatively,while the form and the tendency of the shock front will still be useful.
8. Conclusion
The characteristics of the shock wave in a spherical projectile hypervelocity impacting on thin plate have been studied in this work.The propagation of shock wave is divided into two stages according to the analysis of the JIM.A geometric propagation model is established theoretically based on an equivalent speed assumption.The model uses an ellipse(an ellipsoid in 3-D coordinate)to describe the wave front geometric characteristics and derive the geometric curvature of wave front as a function of the impact velocity.A series of simulations of spherical projectiles hypervelocity impacting on thin plates confirm the GPM valid when proper equivalent speeds are obtained.The GPM are concise and easy calculated to get detailed information of the shock front.We can predict the shock-front's geometry shape and motion much faster and relatively precise compared with simulation.The pressure distribution and wave velocity are also analyzed with the GPM and simulations.Meanwhile,the methods to estimate the pressure at any position in the projectile and to obtain the equivalent speed U of the GPM are proposed.
The shock initiation and interaction dominate the dynamic damage and the phase changing of materials,and especially control the formation of the debris cloud.The characteristics of shock wave in the first complete propagation are analyzed quantitatively,and a comprehensive model has been developed in this work.However,to establish the direct relationship between the debris cloud and the shock wave propagation,further studies are necessary,where the evolution of the wave and the interaction between the wave and the dynamic damage of materials must be taken into consideration.
Acknowledgment
This work was supported by the National Natural Science Foundation of China(11627901,11872118).
杂志排行

Defence Technology的其它文章
- Insensitive high explosives:IV.Nitroguanidine—Initiation&detonation
- Effect of energy content of the nitraminic plastic bonded explosives on their performance and sensitivity characteristics
- Effect of wave shaper on reactive materials jet formation and its penetration performance
- A comparative study for the impact performance of shaped charge JET on UHPC targets
- The role of crystal lattice free volume in nitramine detonation
- Optimizing the defensive characteristics of mild steel via the electrodeposition of Zn—Si3N4 reinforcing particles