RF design of 650-MHz 2-cell cavity for CEPC
2019-10-18HongJuanZhengJieGaoJiYuanZhaiPengShaFeiSiHeZhongQuanLiSongJinZhengHuiMiJianKuiHao
Hong-Juan Zheng · Jie Gao · Ji-Yuan Zhai · Peng Sha · Fei-Si He ·Zhong-Quan Li · Song Jin · Zheng-Hui Mi · Jian-Kui Hao
Abstract In order to meet the requirements of the Circular Electron Positron Collider (CEPC), a 650-MHz 2-cell superconducting cavity was proposed and designed.In this study, we show the progress in the cavity design for the CEPC. The radio frequency and mechanical designs are ready for the first design version, called CEPC-V1. A cryomodule, which consists of two 650-MHz 2-cell cavities, was scheduled the last year. Therefore, prototypes of the 2-cell cavity based on this design were fabricated and tested the following year.The vertical test results show that multipacting (MP) exists from 10 to 19 MV/m. This will increase the operational risk of the CEPC, while the continuous-wave operation for the 650-MHz cavity is 19.7 MV/m. Two trapped modes were also found, which exist because of the identical half-cell design. Therefore, a few improvements regarding MP and more efficient extraction of higher-order mode power are discussed. A new type of cavity design, called CEPC-V2, is also discussed in this paper.
Keywords 650-MHz cavity · Multipacting · Higher-order mode
1 Introduction
CEPC is a 100-km Circular Electron Positron Collider operating at a center-of-mass energy of 90-240 GeV for Z,W, and Higgs bosons. The conceptual design report of the CEPC was published in August 2018 [1]. The CEPC parameters and lattice design for the collider are described in earlier references [2-5].The CEPC will use a 650-MHz superconducting RF system with 240 cavities for the collider and a 1300-MHz superconducting RF system with 96 cavities for the booster [6]. The collider has a double-ring structure with shared cavities for Higgs operation and separate cavities for W and Z operations, as shown in Fig. 1. This common cavity scheme will reduce the total cavity and cryomodule number, as well as the cryogenics,by half compared with the usual double ring with separate cavities for each of the two rings. The electron or positron beams will go through the two RF stations in each RF section for Higgs operation. When operating for W and Z,part of the Higgs cavities will be used in each RF section,and the electron or positron beams will go through only one of the two RF stations of an RF section.
The 650-MHz 2-cell cavity used for the collider is made of bulk niobium (Nb) and operates at 2 K with Q0>4×10¹⁰at 22 MV/m for the vertical acceptance test and Q0>2×10¹⁰at 20 MV/m for the horizontal test. The accelerating gradient is provided by the voltage required per cavity over the effective length of the cavity. The operation gradient for Higgs mode is 19.7 MV/m, and the lower limit of Q0is 1.5×10¹⁰for long-term operation.
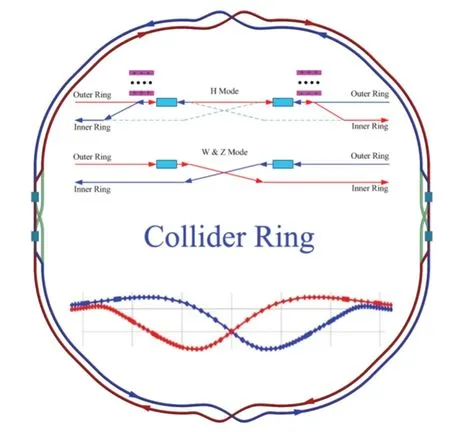
Fig. 1 (Color online) CEPC layout
This study was focused on the 650-MHz 2-cell cavity design.The remainder of the paper is organized as follows:Section 2 summarizes the RF and mechanical design for the CEPC-V1 cavity. A scheme involving four identical halfcells was adopted for this design version to save dies,which is not only economical, but is also easy to fabricate. Two cavities with two cells each were fabricated and avertical test was carried out,of which the results are presented in Sect. 3 along with the test results and comparisons with the simulations.In Sect. 4,a new cavity design version named CEPCV2 is provided to improve the multipacting(MP)and trapped modes encountered in the CEPC-V1 cavity. Finally, the conclusions are summarized in Sect. 5.
2 RF and mechanical design for CEPC-V1 cavity
A superconducting cavity is characterized by different geometrical parameters. By choosing these parameters properly, we try to optimize several figures of merit and compare them. The goal of the RF design is to minimize Bpeak/Eaccand Epeak/Eacc, and to maximize R/Q and the cell-to-cell coupling k.The geometric parameters chosen to describe the cell of the elliptical superconducting cavity are shown in Fig. 2.The radius of the iris Riris,iris ellipse ratio b/a, side wall inclination alpha, and the wall distance parameter d were optimized to achieve the design goals.
Figure 3a shows that a large Ririsis good for cell-to-cell coupling. The cell-to-cell coupling factor k specifies the passband width;therefore,a smaller coupling factor gives a narrower passband. If the frequency of the π mode is too close to the frequency of the 0 mode,the 0 mode could also be excited by an RF generator. This can be avoided by increasing the aperture of the cell-to-cell coupling.Higherorder modes also form passbands.For small k values,there is a danger that if the given mode is excited by the beam(e.g., somewhere in the middle of the cavity), it will propagate out and decay very slowly.However,a large Ririsleads to large Bpeak/Eaccand Epeak/Eaccvalues, and it also decreases the impedance of the fundamental mode. A trade-off between the acceleration efficiency for the fundamental mode and the cell-to-cell coupling should be considered. The iris ellipse ratio b/a is determined by the local optimization of the peak electric field, as shown in Fig. 3b.A small alpha decreases the Bpeak/Eaccvalue while increasing the cell-to-cell coupling, as shown in Fig. 3c.The wall slope angle alpha is also related to the cavity mechanical stability, cavity chemistry, and cleaning. The parameter d is used to balance the Bpeak/Eaccand Epeak/Eaccvalues. However, a smaller d increases the cell-to-cell coupling.
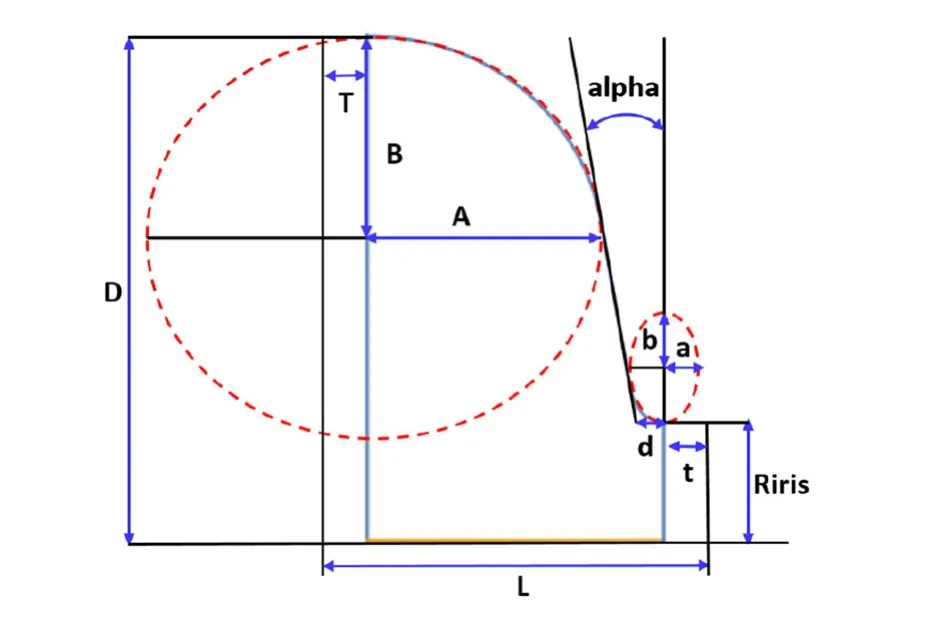
Fig. 2 (Color online) Definition of cell shape parameters
We used the codes BuildCavity [7]and Superfish [8]to perform parameter scan analysis. The optimized parameters of the cavity based on the above analysis are listed in Table 1. There was a 1.46-mm-long straight line-segment at the equator between two half-cells that was used to tune the field flatness and for welding.

Fig. 3 (Color online) Electromagnetic parameters as a function of Riris, iris ellipse ratio r, alpha, and d

Table 1 Parameters of the 650-MHz 2-cell cavity (CEPC-V1)

Fig. 4 (Color online) 2-cell cavity with the coupler pipes model
The length of the cavity beam pipes,higher-order mode(HOM) coupler pipes, and input coupler pipe should be long enough to ensure negligible power dissipation in the gaskets and flange surfaces, compared with the wall loss for a high Q cavity. However, they cannot be so long that they go beyond the critical temperature of Nb.If the length for each pipe is not selected properly,the heat dissipated on the gaskets and flange surfaces will be high, which will ultimately lower the cavity quality factor Q0. The heat dissipation on the stainless-steel flanges installed on each pipe during the vertical test was simulated using CST Microwave Studio. A three-dimensional RF model of a 2-cell cavity with coupler pipes was constructed as shown in Fig. 4. To be clear, the term ‘P’ used in Fig. 4 represents the end face of the pipe.The pipes were closed with blank stainless-steel flanges during the vertical tests. ‘P1’ and‘P2’ only indicate the end face of the beam pipes, that is,the face of the blank stainless-steel flanges that were not built into the model.‘P3’indicates the end face of the input coupler pipe. ‘P4’ and ‘P5’ indicate the end face of the HOM coupler pipes.The electrical boundary condition was used to obtain the surface magnetic field distribution. By integrating the square of the surface magnetic field and multiplying the surface resistance of the stainless steel Rs,we calculated the heat load on the stainless-steel flanges using Eq. (1) [9], where f is the fundamental mode frequency of the 650-MHz 2-cell cavity, μ0is the permeability of the vacuum,μris the relative permeability,and σ is the conductivity of the stainless steel. The external Q value for each surface is calculated using Eq. (2) after obtaining the surface heat load, where ω is the angular frequency of the fundamental mode and U is the energy stored in the cavity. Subsequently, the actual Q0of the cavity could be obtained when the heat load of all five of the pipe ports caused by the stainless-steel flanges was considered.

Considering the actual space limitations and power dissipation calculation, the beam pipe length chosen was 260 mm, the input coupler pipe (P3) length was 162 mm,and the HOM coupler pipe (P4) length was 142 mm. The external Q value for each pipe calculated from the heat load on the surface of the blank flanges is listed in Table 2.Considering the influence of all five of the surfaces, Q0of the cavity decreased from the design value of 4×10¹⁰to 3.48×10¹⁰, which was acceptable.
The cavity’s mechanical structure was optimized using a helium vessel to minimize its pressure sensitivity (df/dp)and mechanical stress [10]. The cavity wall thickness was 4 mm, and the stiffening ring thickness was 3 mm. The simulated tuning sensitivity was 310 kHz/mm, and the stiffness was 16 kN/mm. The maximum tuning force was approximately 7.8 kN (the stress remained within allowable limits),and the tuning range was approximately 1.158 kHz. After optimization, the requirements for the final mechanical design were fulfilled.
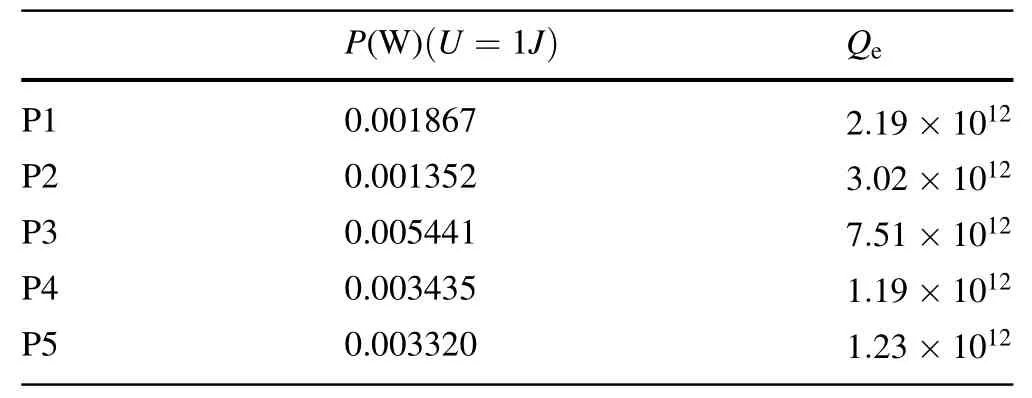
Table 2 External Q value for different surfaces of the pipe
3 Vertical test of the CEPC-V1 cavity
Two 2-cell cavities were fabricated by OTIC (Ningxia Orient Tantalum Industry Co., Ltd.) (1#) and HERT (Beijing HE-Racing Technology Co., Ltd.) (2#), respectively.Different post-processing methods were used for the two cavities.
For cavity 1#,the main post-processing procedures were as follows:
· Buffered chemical polishing (BCP) of 180-220 μm.
· 800°C heat treatment for 3 h.
· BCP of 30-40 μm.
· High-pressure rinsing (HPR) three times.
· No baking.
For cavity 2#,the main post-processing procedures were as follows:
· BCP of 120 μm.
· 800°C heat treatment for 3 h.
· BCP of 30 μm.
· HPR four times.
· Baking at 75°C for 3 h.
· Baking at 120°C for 48 h.
The vertical test was completed this summer, and the test results for the two cavities are shown in Fig. 5.The Q0was 4×10¹⁰at 19.2 MV/m for cavity 1#. The max gradient reached was 27 MV/, which was limited by field emission and RF power for cavity 1#. The Q0value for cavity 2#was lower than for cavity 1#. The maximum gradient attained was 24 MV/m,which was limited by the RF power on the test cables for cavity 2#.The Q0was approximately 3×10¹⁰at 19 MV/m for cavity 2#.The main reason these two cavities ultimately failed to achieve the vertical test goal (Q0=4×10¹⁰@22 MV/m) is that the Q-slope is in the medium field. The field emission went up, and the Q0values decreased substantially after the field exceeded 20 MV/m. To protect the 650-MHz solid-state amplifier and cables for the vertical test,the incident power of cavity 1#finally reached 79 W and cavity 2# reached 50.1 W.Without further increase in the incident power,the vertical test was stopped.
Both test results appeared to be very close to meeting the requirement for CEPC long-term operation(19.7 MV/m@Q0=1.5×1010). To achieve high Q0in the vertical test and in operation, many issues should be considered. Ultra-clean cavity surface processing is required to avoid field emissions. Nitrogen-doping and electro-polishing (EP) of the 650-MHz 2-cell cavity are under investigation to improve the overall performance of the cavity and eventually, to satisfy the CEPC specifications.
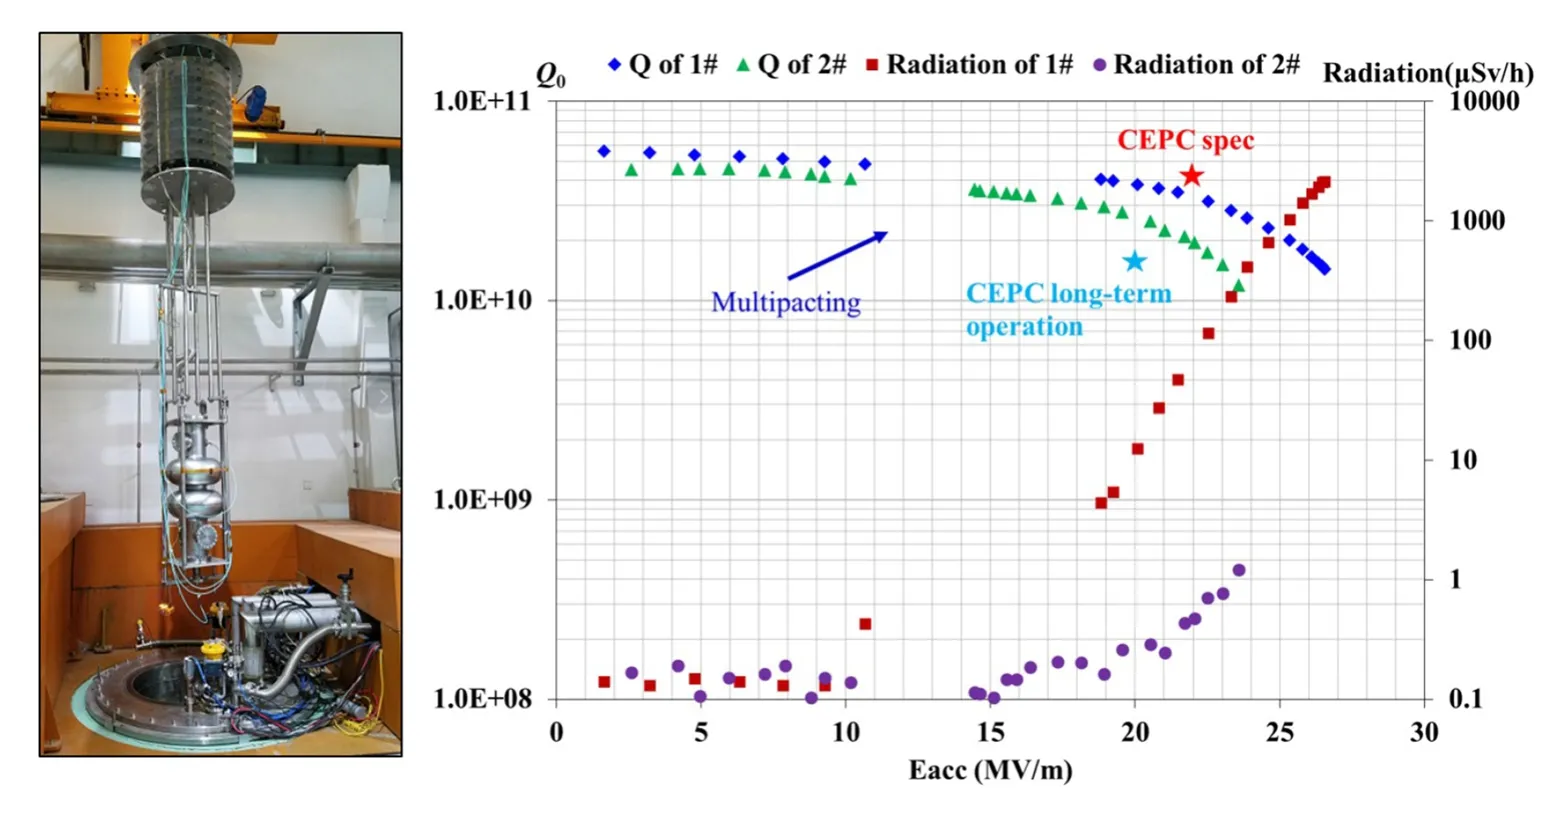
Fig. 5 (Color online) Vertical tests of the two cavities

Fig.6 (Color online)a Geometry of a CEPC-V1 cavity with particle sources highlighted by red surfaces and b different particle sources used
As we can see, MP was encountered with both cavities.The RF field range was 11-19 MV/m for cavity 1# and 11-14 MV/m for cavity 2#.Although the MP barrier could be surmounted by processing during the test, the RF field range at which MP occurs was near the operation field of CEPC. The range of MP occurrences varied for cavity 1#and cavity 2#, which may be due to different post-processing methods, for example one was baked while the other one was not. The particle-tracking solver of CST Particle Studio (PS) [11] was used for MP simulation to understand this phenomenon.Usually,several locations are suspected of experiencing MP; hence, it is necessary to create a shell around the entire volume of the cavity and provide independent initial particle sources. This helps determine the MP location on different surfaces independently. To reduce the total number of mesh cells and therefore save time in the simulation,we decided to use 1/8 of the cavity models after considering the symmetrical design of the cavity. Figure 6a shows the geometry of the CEPC-V1 cavity used and the red surfaces indicate the particle source chosen for MP simulation.Figure 6b shows the three different particle sources used for primary electrons. A general approach for MP simulation was developed and can be found at [12-18]. These approaches will not be discussed in detail in this paper. The Furman probabilistic model for secondary emission from a 300-deg bakeout of niobium was used with the default CST PS parameters. The Furman probabilistic model used by CST PS considers elastic backscattered, re-diffused, and true electrons. The true emission is responsible for electron growth because the backscattered and re-diffused electrons do not produce secondary particles. The true SEY curve used for niobium is plotted in Fig. 7a.
The particle-tracking solver of CST PS evaluates the particle numbers in the cavity volume versus time of simulation, which is a natural parameter to indicate and verify the electron multiplication. When MP occurs in the simulations without space charge effects, the number of particles grows exponentially. The number of particles after MP began was expressed by N(t)=N0eα(t-t0), where α is the exponential growth rate coefficient, usually expressed in ns-1. The negative growth rate indicates the absence of MP,and N0is the number of particles at t=t0.To obtain accurate results, we swept the cavity gradient from 2 to 20 MV/m and swept the initial phases for the emission electrons under each cavity gradient. Finally, the growth rate of the particle curve with the fastest growth rate under each cavity gradient was selected as the growth rate of the MP.Figure 7b shows the growth rate results for different particle sources, shown in Fig. 6b, of the CEPCV1 cavity.The simulation results show that MP is likely to occur from 8 to 20 MV/m. The particle trajectories for different particle sources indicate that MP only occurs in the equator region, as shown in Fig. 8.The simulation and vertical test results shown in Fig. 5 appear to be in good agreement.The results indicate that MP occurs over a wide range; therefore, the design must be adjusted to mitigate MP.
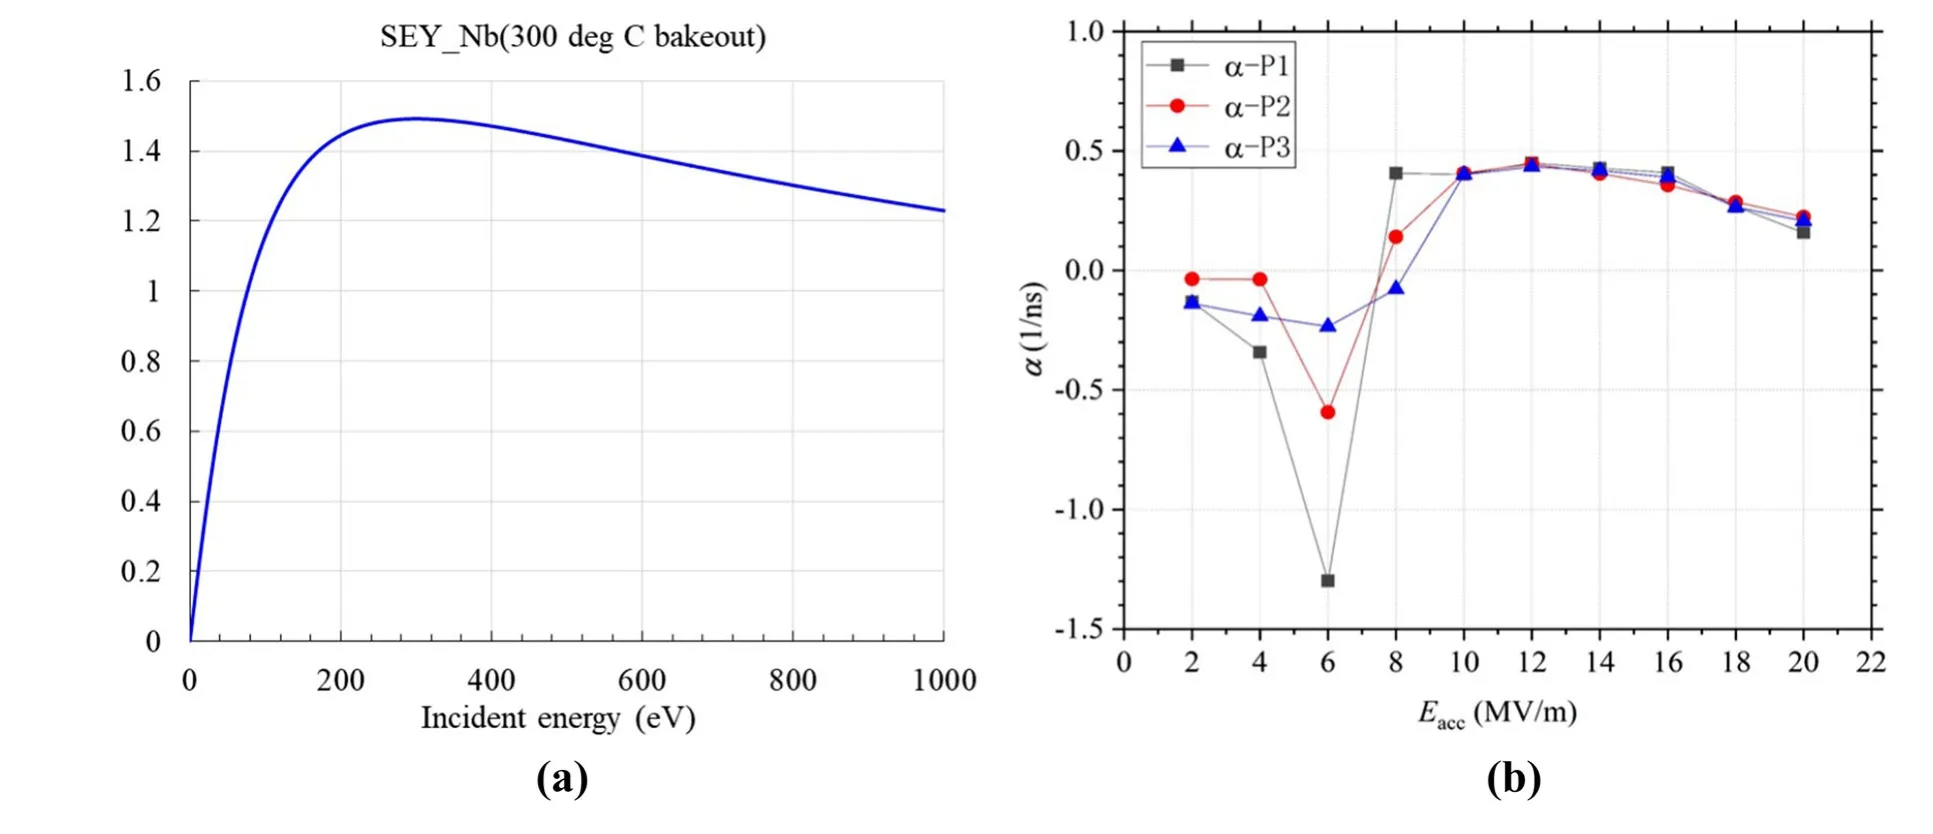
Fig. 7 (Color online) a True secondary electron yield (SEY) of niobium as a function of incident electron energy. b CEPC-V1 growth rate α versus gradient for different particle sources
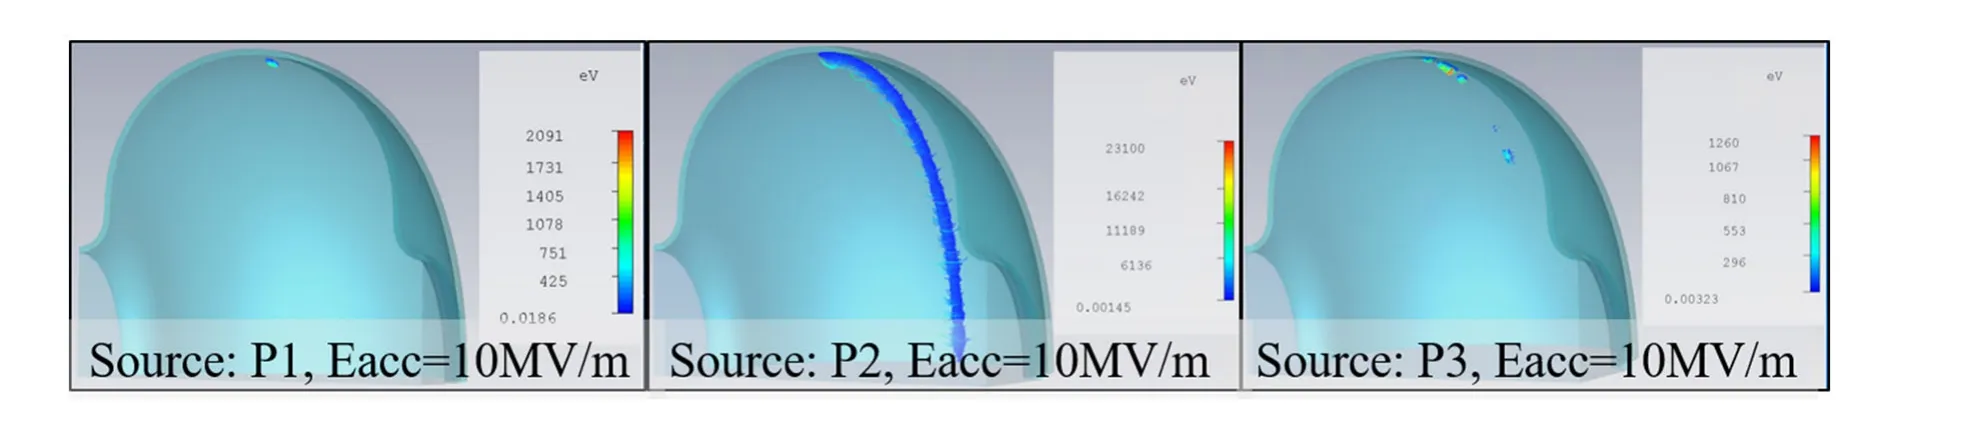
Fig. 8 (Color online) Particle trajectory for different particle sources
4 New type of cavity design (CEPC-V2)
The geometry of the equator section is the most influential factor for the secondary electrons. During the cavity shape optimization, the geometry of the cavity equator region was varied. In addition to the MP analysis, two trapped modes TM012 and TE121 were found in the CEPC-V1 design, because of the design scheme involving four identical half-cells. To improve the trapped modes,different geometries for mid-half-cell and end half-cell designs were adopted. Other design goals for the new type of cavity were to maintain the Epeak/Eaccvalue below 2.4,while the Bpeak/Eaccwas kept not greater than 4.2. The radius chosen for the iris and beam pipe was between 75 mm and 80 mm. Regarding the fabrication and cavity treatment constraints, the wall angle increased because small values can be critical for the cavity chemistry and cleaning procedures.
The electromagnetic parameters as a function of the equator ellipse ratio R, the wall slope angle alpha, the iris radius Riris, and the iris ellipse ratio r are shown in Fig. 9.The iris radius was set at 75 mm,and the beam tube radius was set at 80 mm. The optimization procedures of the geometry parameters were almost the same as with CEPCV1,except for the consideration of the MP and the trapped modes. After a few optimizations, the parameters of the cavity were chosen as shown in Table 3.
The electric field distribution on-axis for the TM012-π mode, compared with CEPC-V1 and Future Circular Collider e+e-(FCC-ee) [19]-type cavities [20], is shown in Fig. 10a, and the electric field distribution off-axis for the TE121-π mode compared with CEPC-V1 and FCC-ee type cavities is shown in Fig. 10b. As we can see from the simulation results, the field distribution of TM012-π mode and TE121-π mode in the beam tube is enhanced for CEPC-V2 when compared with the CEPC-V1 design. The field distribution in the beam pipe of the TM012-π mode for FCC-ee is stronger than that for the CEPC-V2 cavity.This is because the FCC-ee used a design with two different end cells, which is apparently good for the trapped modes. However, the CEPC-V2 design is better when considering the electric field distribution of the TE121-π mode.A double notch coaxial HOM coupler was designed for the CEPC 650-MHz 2-cell cavity [21].A HOM coupler was installed on each side of the beam tubes, as shown in Fig. 4 to extract the HOM power below the cutoff frequency and to meet the HOM damping requirements to ensure beam stability. To evaluate the effect of the new design on the trapped modes,a 2-cell cavity equipped with a two HOM-coupler model was built. The damped Q values of the TE121 and TM012 π modes and the field distributions were given by the CST Microwave Studio eigenmode solver.Figure 11a,b shows that a large amount of stored energy is concentrated in the middle cell and the field values in the beam pipe are low for the CEPC-V1 cavity. With the different mid-half-cells and end half-cell designs, the field distribution was varied, as shown in Fig. 11c, d. As the field strength in the beam pipe was enhanced, the coupling of the two modes to the HOM coupler became stronger.The Qevalues for the TE121 and TM012 π modes are listed in Table 4. It can be seen that the Qefor TE121-π mode declined from 7.57×10⁶to 7.11×10³and for TM012-π mode declined from 6.92×10⁶to 3.08×10⁵. This means that coupling of the two modes to the HOM coupler became stronger and that the modes were no longer trapped.

Fig. 9 (Color online) Electromagnetic parameters as a function of the equator ellipse ratio R, alpha, Riris, and the iris ellipse ratio r

Table 3 Parameters of the 650-MHz 2-cell cavity (CEPC-V2)

Fig.10 (Color online)a Electric field distribution on-axis for TM012-π mode.b Electric field distribution off-axis(10 mm)for TE121-π mode
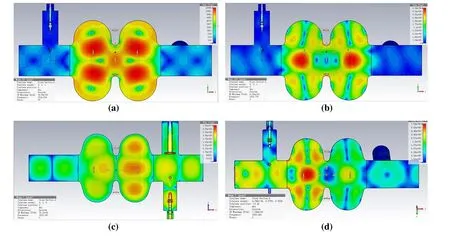
Fig. 11 (Color online) a Electric field distribution of TE121-π mode for the CEPC-V1 cavity. b Electric field distribution of TM012-π mode for the CEPC-V1 cavity.c Electric field distribution of TE121-π mode for the CEPC-V2 cavity. d Electric field distribution of TM012-π mode for the CEPC-V2 cavity
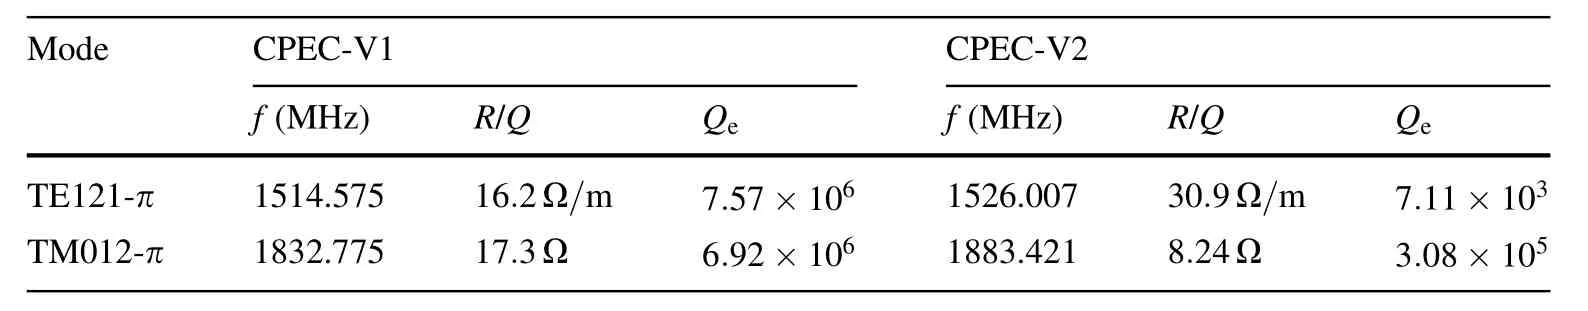
Table 4 Qe values for TE121 and TM012 π modes

Fig. 12 (Color online) CEPC-V2 growth rate α versus gradient for different particle sources
The same method and procedure used for MP simulation as mentioned in part III were used for the CEPC-V2 cavity design. A total of 1/8 of the cavity models and three different particle sources, as shown in Fig. 6, were used for the simulation.Figure 12 shows the growth rate results for different particle sources. The simulation results indicate that MP is likely to occur from 8 to 12 MV/m,which range is far from the operation gradient (19.7 MV/m) for the CEPC. A test cryomodule with two 650-MHz 2-cell cavities is in fabrication and will be assembled in the test cryomodule in 2019.A beam test with a DC photo-cathode gun (CW 10 mA) is scheduled to start in 2020 at a new SRF laboratory in the Platform of Advanced Photon Source Technology R&D (PAPS).
5 Summary
A detailed design evolution of the original 650-MHz 2-cell cavity for the CEPC ring that led to modifications to satisfy the demand for better operation is given herein.Two 650-MHz 2-cell cavities of CEPC-V1 were fabricated,and the vertical tests were completed this year. Different post-processing procedures were used for these two cavities. The test results revealed that MP occurred during 11-19 MV/m that nearly reached the CEPC long-term operation gradient (19.7 MV/m@Q0=1.5×1010). To meet the CEPC long-term operation goal, a new version of the cavity design was provided to reduce the range of MP occurrence and to free the TE121 and TM012 modes. The simulation results for the MP effect indicate that MP is likely to occur between 8 and 12 MV/m,which is far from the operation gradient (19.7 MV/m) for the CEPC. The field propagation of the TE121 and TM012 modes also appears to be better than that of the old design version.The CEPC-V2 type Nb cavity is under fabrication and will be assembled in the test cryomodule to be installed at PAPS next year.
杂志排行

Nuclear Science and Techniques的其它文章
- Study of Sallen-Key digital filters in nuclear pulse signal processing
- Advanced topics on RF amplitude and phase detection for lowlevel RF systems
- Feasibility analysis of 60Co production in pressurized water reactors
- Recovery of saturated signal waveform acquired from high-energy particles with artificial neural networks
- Assessment of self- and cross-absorbed SAF values for HDRKman using GEANT4 code: internal photon and electron emitters
- Development of alpha surface contamination monitor based on THGEM for contamination distribution