Feasibility analysis of 60Co production in pressurized water reactors
2019-10-18WeiZhangFengLeiNiuYingWuZhangPengGuo
Wei Zhang · Feng-Lei Niu · Ying Wu · Zhang-Peng Guo
Abstract The radioactive isotope 60Co is used in many applications and is typically produced in heavy water reactors. As most of the commercial reactors in operation are pressurized light water reactors (PWRs), the world supply of high level radioactive cobalt would be greatly increased if 60Co could be produced in them. Currently,60Co production in PWRs has not been extensively studied;for the 59Co (n, γ) 60Co reaction, the positioning of 59Co rods in the reactor determines the rate of production. This article primarily uses the models of 60Co production in Canadian CANDU power reactors and American boiling water reactors;based on relevant data from the pressurized water Daya Bay nuclear power plant,a PWR core model is constructed with the Monte Carlo N-Particle Transport Code; this model suggests changes to existing fuel assemblies to enhance 60Co production. In addition, the plug rods are replaced with 59Co rods in the improved fuel assemblies in the simulation model to calculate critical parameters including the effective multiplication factor,neutron flux density,and distribution of energy deposition.By considering different numbers of 59Co rods, the simulation indicates that different layout schemes have different impact levels, but the impact is not large. As a whole, the components with four 59Co rods have a small impact, and the parameters of the reactor remain almost unchanged when four 59Co rods replace the secondary neutron source.Therefore, in theory, the use of a PWR to produce 60Co is feasible.
Keywords MCNP·Fuel assembly·Neutron flux·Reactor power · 60Co
1 Introduction
The radioactive isotope60Co is widely used in fields as diverse as food irradiation, materials science, commercialization of Chinese herbs, and environmental management[1-3].Due to the broad range of applications of60Co and their high economic benefit, methods of producing a large quantity of high specific activity60Co have become an important issue in many countries.The nuclear reaction59Co (n, γ)60Co [4] is often used to produce60Co [5]; a high specific activity is obtained by placing a59Co-containing target in a high-flux reactor for neutron irradiation[6].
Currently, there are only seven commercial nuclear power operations in the world that are producing the radioactive isotope60Co:the Russian MAYAK facility,the Leningrad nuclear power plant(graphite reactor),the Bruce Power and Ontario Power Generation CANDU reactors(Canada), the Embalse CANDU reactors (Argentina), the Qinshan CANDU reactors (China), the Clinton boiling water reactor (BWR) power plant (USA), and the Hope Creek (BWR) reactors (USA). Table 1 estimates the amount of60Co supplied by these commercial nuclear power plants.Although thermal reactors,experimental fast reactors, and subcritical reactors can be used to produce60Co,the CANDU reactor is the most widely used for this;no country has made full use of PWRs to produce60Co[7].In recent years, the demand for60Co has grown significantly; the market size for60Co from 2006 to 2011 is shown in Fig. 1. Considering the availability of cobalt metal as an irradiation target for60Co production, the consulting firm Roskill predicts that the industrial demand for cobalt will maintain a growth rate of over 6%per year,based on recent years[6].The expected global demand for cobalt will be more than 100,000 metric tons in 2020;since the annual production of cobalt is limited,the world supply will be insufficient to meet the demand[1].To compensate for this mismatch, an effective method to produce the required60Co in PWRs is needed, as most of the commercial reactors in operation are PWRs (Table 2) [8-10].Pressurized water reactors are found in a large majority of the world’s nuclear power plants, with the number of PWRs being much larger than BWRs and supercritical water reactors (SCWRs).

Table 1 60Co supplied by commercial nuclear power plants

Fig. 1 Analysis of market size for 60Co from 2006 to 2011 (billion yuan)
PWRs have a secondary neutron source, whose main function is to improve the neutron flux level of the reactor during the loading and unloading processes, so the source count rate will be in a suitable range and provide a reliable basis for safe reactor startup. Some (α, n) neutron sources and spontaneous fission neutron sources in the spent fuel assemblies in Daya Bay nuclear power plant (NPP) produce a large number of neutrons; if spent fuel assemblies were substituted for the secondary neutron sources, the measurement accuracy of the instruments would be increased and the replacement of the secondary neutron sources during the lifetime of the reactor could be avoided.Beginning in October 2010, Daya Bay NPP discontinued the use of secondary neutron source assemblies and introduced some spent fuel assemblies with a known burnup value as the secondary neutron sources.
Because of its neutron absorption properties,a59Co rod can be put in the original position of the secondary neutron source and60Co will be produced. Preliminary analysis shows that this method is feasible. Success in finding an optimal location for a59Co target in a specific reactor would provide a starting point to investigate60Co production in that reactor. In this article, the effects on PWR operations of adding59Co in rod form are studied.
In order to study the characteristics of60Co production in a PWR, we combine the design principles of thermal neutron reactors with the method of producing60Co in other reactors. The core design is optimized to reach keffafter adding59Co rods to the PWR. The parameters of the PWR are then adjusted to find the solution which has the smallest impact on the core [11].
2 The design of a PWR core
The Monte Carlo N-Particle Transport Code (MCNP)[12] is internationally recognized for analyzing the transport of neutrons,photons,and electrons and can be used to simulate a PWR. MCNP is widely used in the analysis of fuel assemblies as well as core design. It can be used for calculations of the multiplication factor, reaction rates,neutron flux and spectrum,power peaking factors,reaction rate distribution,and radiation shielding[13].Monte Carlo methods do not solve an explicit equation deterministically[14], but simulate the motion of individual particles statistically to obtain a solution. In addition, the code can work with a 3D geometry and can even include time as a fourth dimension; an example would be an ellipsoidal surface with an arbitrary three-dimensional perturbation[15]. MCNP uses statistical methods to solve complex problems that cannot be modeled directly by computer algorithms. The neutron energy range with the MCNP program is: 10-11to 20 MeV; the photon energy range is:1 keV to 1000 MeV [16].

Table 2 Nuclear power plants in commercial operation
The sequence for an MCNP simulation is as follows(Fig. 2):
A number of input files are used by MCNP, including XSDIR and a cross-sectional database file. The main file requiring user input is designated INP. Output files containing calculated results and various running information are created by MCNP [17].

Fig. 2 Running process of the Monte Carlo N-Particle Transport Code (MCNP)
In this paper, a PWR core model is created using the MCNP and SCALE codes. We use MCNP to calculate the neutron flux density and energy deposition, assuming different numbers of59Co rods loaded into a pressurized water reactor.The criticality source condition is used to calculate the effective multiplication factor(keff).The initial estimate of the core keffis set to 1,the number of cycles is 500,and 100 cycles are skipped to ensure that the normal spatial mode for fission sources is achieved. When we study the axial distribution of neutron flux,the reactor core is divided into 74 parts (on average) along the axis, and the neutron flux density in each part is counted. For the calculation of the radial energy deposition in the core, the component is taken as the research object,and the reactor core is divided into 15 modules spaced equidistantly along the diameter from (-7,0,0) to (7,0,0); each module is calculated separately. The SCALE (Standardized Computer Analyses for Licensing Evaluation) [18] code contains a different set of analysis and calculation modules; this paper mainly uses the Origen-S module to calculate burnup.
2.1 The configuration of the PWR core
A model of the core of the China Guangdong Daya Bay 900 MWe PWR was created using the MCNP4C code[19]to study the technology of producing60Co in PWRs. The core consists of 157 fuel assemblies, of which 49 (first cycle) or 61 (subsequent cycle) are equipped with control rod assemblies, while the remaining are equipped with core-related components, including burnable poison assemblies, neutron source assemblies, and plug assemblies. All the fuel assemblies are the typical 17 × 17 configuration. Every assembly contains 264 fuel rods, 24 control rod guide tubes and 1 neutron detector guide tube.Three different types of assemblies are needed when the fuel assemblies are loaded for the first time; their enrichments are 1.8,2.4, and 3.1% [20].The numbers of various components in the PWR core when first loading (and subsequently) is shown in Table 3.
2.2 The main parameters of the PWR
In this PWR simulation,we use fuel with a UO2density of 10.4 g/cm3.In addition,the large amount of water in the PWR acts as both the coolant and moderator as it contains dissolved boric acid (concentration 1000 ppm). The main parameters of the PWR are listed in Table 4.

Table 3 Type and number of components in the core

Table 4 Main parameters of the PWR
2.3 Core modeling of the PWR
The control rods have a great influence on reactivity and are used for dynamic regulation during normal operation;to simplify the calculations, all control rods have been replaced by a water gap cell for modeling. Based on the geometry and material composition described above, the PWR model assumed for the MCNP simulation is shown in Fig. 3a.
3 Alternate design
In order to approach the design model of the Daya Bay Nuclear Power Plant [21] and obtain precise calculation data, the thimble plug assemblies (namely, the spent fuel assemblies) are used to replace the secondary neutron sources and are placed at the same locations. Then, we have a new reactor type, based on the original, and suitable for comparison.The assemblies requiring replacement are located at(3,H)and(13,H);the prototype reactor after the replacements is shown in Fig. 3b.
There is a big difference between light water reactors and heavy water reactors in structure, so from the perspective of nuclear materials security, the study of using a Qinshan CANDU reactor to produce60Co cannot provide significant reference information [22]. Obviously, the technology of producing60Co in an American BWR is worth investigating; when the General Electric Company produced60Co in a BWR, it inserted 4 or 559Co rods in 10 × 10 fuel assemblies. Since BWRs and PWRs are both light water reactors,there are many common features. It is reasonable to increase the number of59Co rods inserted in the PWR and conduct a comparative analysis. The three analysis schemes of this paper are as follows:

Fig. 3 a Cross section of the reactor core.b The prototype PWR after replacement of two fuel assemblies
Scheme one: replace the secondary neutron source rods(four rods);
Scheme two: replace the secondary neutron source rods(four rods) and two stopper rods; and
Scheme three:replace the secondary neutron source rods(four rods) and four stopper rods.
3.1 The prototype reactor
The secondary neutron source locations are replaced in the prototype by a thimble plug component,which contains 24 stopper rods and one tube for a neutron flux detector,as shown in Fig. 4a.
3.2 Scheme one
The first approach is to replace the stopper rods at the positions of the secondary neutron source rods with59Co rods. The positions of the secondary neutron source rods are fixed in the assemblies of the reactor, yet the specific position is not determined. However, the arrangement of the control rods in the assembly is symmetrical. Figure 4b shows the location of the four neutron source replacements by59Co rods.

Fig. 4 Fuel assembly with different numbers of 59Co rods.a The thimble plug component.b The position of the four 59Co rod replacements within the component (scheme one). c The position of the six 59Co rod replacements (scheme two).d The position of the eight 59Co rod replacements(scheme three)
3.3 Scheme two
Scheme two is based on scheme one, with two additional59Co rods replacing two stopper rods. The specific positions of the six59Co rods are shown in Fig. 4c.
3.4 Scheme three
Scheme three is also based on scheme one, with four59Co rods replacing four stopper rods (Fig. 4d). There is a A = total of eight59Co rods.
4 Analysis of the simulation results
4.1 Estimation of core lifetime and 60Co production
Loading the cobalt rods will change the core lifetime of a reactor and affect its electricity production.Therefore,in order to have a rough estimation of the cost-benefit balance, we calculate keffand the60Co content for different burnup values using the SCALE code. The results are shown in Fig. 5 and Table 5, respectively.
In the analysis and calculation, the60Co content in the results are not presented in absolute terms, but as the ratio of60Co content to the U content in the initial UO2fuel loading, for convenience in comparing the three schemes.When the relative content is calculated, the amount of U loaded per component at the initial time is set to 1 ton.
The activity of60Co at different burnup values can be estimated from the60Co half-life. The specific calculation is as follows:


Fig. 5 Variation of core keff with burnup under different loading schemes
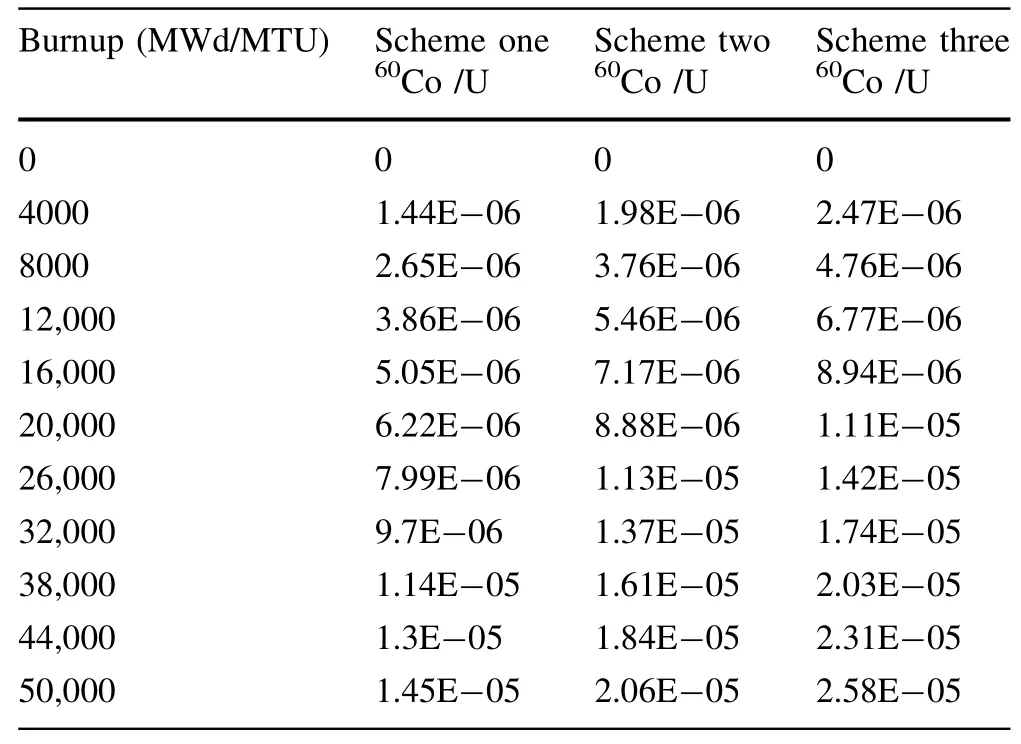
Table 5 60Co content at different burnup values
From Fig. 5(inset)we can see that for four,six,or eight59Co rods in the assemblies, the corresponding keffvalues are smaller than for the prototype reactor. Moreover, keffdecreases with increasing number of59Co rods, indicating greater absorption of neutrons by the59Co rod than by the reinforcing rod.It is obvious from Fig. 5 that after loading the59Co rods into the reactor core, the core lifetime decreased.The calculation shows that the core lifetimes for the prototype reactor and schemes one, two, and three are 188.5,188.5,188.8,and 190 d,respectively,indicating that loading four to eight cobalt rods into the core will shorten the core lifetime by one to two effective full-power days.
Based on the simulation results in Table 5,for a burnup of 20,000 MWd/MTU, the specific activity of60Co for schemes one,two,and three is 44.82,43.73,and 43.25 Ci/g, respectively. When the burnup reaches 50,000 MWd/MTU, the specific activity is 104.77, 101.42, and 100.89 Ci/g, respectively, which is suitable for industrial irradiation sources.
4.2 Neutron flux in the axial direction
In this program, each rod bundle has a complete length of 365.8 cm and is divided into 73 segments of length about 5 cm; each bundle thus has 74 cross sections. The axial neutron flux distribution for all cross sections is of interest,but for simplicity of presentation, we have chosen to display only every fourth section to focus on trends in these simulations. The comparison between the three schemes and the prototype reactor is shown in Fig. 6a.

Fig. 6 Neutron flux. a Axial distribution, b radial distribution
It is shown from Fig. 6a that the axial neutron flux distributions of the three schemes are consistent with that of the prototype,and the deviations from the prototype are indeed small. The mean squared deviation can reflect the degree of deviation between the two groups. The smaller the value, the smaller the difference between the two groups. Table 6 (upper row) shows that the mean squared deviation of the third scheme is the smallest and its value is 8.9345e-15.The first scheme has the largest mean squared deviation, with the second scheme roughly midway between. This indicates that as more59Co rods are loaded in the assemblies,the less influence they exert on the axial neutron distribution.
4.3 The radial distribution of neutron flux
As a result of the symmetry of the components in the core, only some locations were tested: (8, H), (8, I), (8, J),(8,K),(8,L),(8,M),(8,N),and(8,O).By comparing the radial neutron flux of the three59Co rod schemes with the prototype,we observe(Fig. 6b)that the radial distributions of neutron flux for the different schemes are distinct, but the differences are small.As shown in Table 6(lower row),scheme two is in closer agreement with the prototype reactor with a mean squared deviation of 9.6046e-14.Scheme one has a slightly higher (18%) mean squared deviation, and scheme three’s is 2.6 times higher.
4.4 The radial energy deposition (X)
The main source of heat in the reactor is the energy released in the fission chain reaction by the fissile material of the fuel pellet. MCNP provides a tally to calculate the average fission energy deposition of a cell;the tally can be used to calculate the core’s power density,as energy deposition indirectly reflects the core’s power level.As shown in Fig. 4,Cartesian coordinate system is established by using(8,H)components as coordinate origin,line 8 components as X-axis, and column H components as Y-axis. The radial distribution of energy deposition(X)for the three schemes and the prototype reactor are shown in Fig. 7a.
The difference between the various schemes cannot be seen from Fig. 7a. However, in light of the results from Table 7, we can see that scheme two has a high degree of agreement with the prototype reactor, while the third scheme has a large deviation.The radial distribution of the neutron flux has an effect on the reactor power, so it follows that the second scheme has the least impact on power,while the third scheme brings about the most.
High local power density can lead to fuel rod melting.The local power density at the hottest part of the fuel rod is expressed by the power peaking factor, and it is therefore necessary to calculate the power peaking factor of the core before and after loading the cobalt rods. From the calculation, we can see that the power peaking of the prototype reactor, scheme one, scheme two, and scheme three is located 43 cm away from the midpoint of the reactor core in the X direction, and their power peaking factors are 1.158, 1.151, 1.156, and 1.178, respectively, showing a maximum deviation of 1.73%.This shows that the addition of the cobalt rods has little effect on the location of the power peak in the X direction.

Fig. 7 a Radial energy deposition(X).b The radial energy deposition(Y)
4.5 The radial energy deposition (Y)

Table 6 Neutron flux, mean squared deviation from prototype PWR
The radial dependence (in the Y direction) of energy deposition for the three schemes and the prototype are compared in Fig. 7 and Table 7. From Table 7, the mean squared deviation of scheme one from the prototype is the minimum (0.0060) while the mean squared deviations for schemes two and three are rather larger (0.0274 and 0.0374). Thus, it can be concluded that the latter two schemes have more impact on the core power dependence on the Y coordinate. Figure 7b shows that the energy deposition patterns for the various schemes are different from each other, showing larger discrepancies at the coordinates of + 100 and - 100 cm. Those two positions are where the59Co rods replace the stopper rods. As the59Co rods absorb more neutrons than stopper rods, energy deposition (core power) at those positions will decrease accordingly.
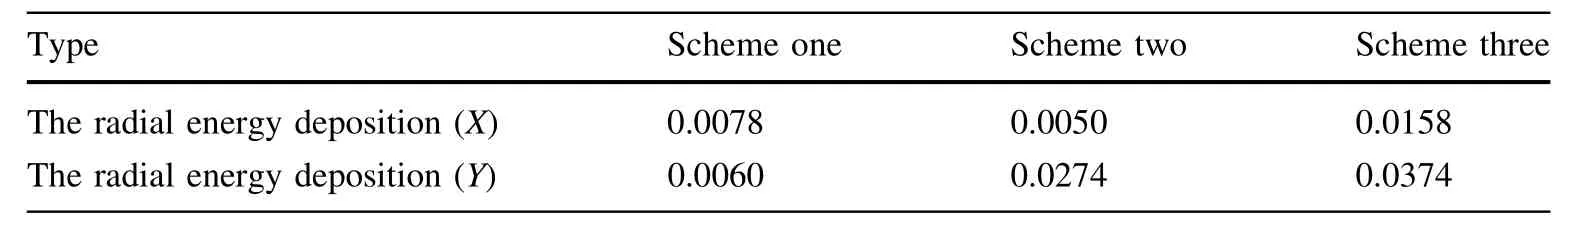
Table 7 Energy deposition,compared to prototype reactor(Mean squared deviation)
In the Y direction,the power peaking factors of different schemes and the prototype reactor are calculated. The power peaking factors of the prototype reactor and Schemes one, two, and three are 1.082, 1.139, 1.169, and 1.174, respectively. The maximum deviation of the schemes from the prototype is 8.5%.In addition,the power peaking for all schemes occurs 43 cm away from the midpoint of the core, and we may conclude that the addition of the59Co rod to the PWR has no significant effect on its radial location.
5 Conclusion
To study the effect of loading59Co rods into a PWR core, we simulated the core with the59Co rods in three different configurations. The radial and axial distributions of neutron flux, and the radial distribution of energy deposition,were obtained from the Monte Carlo N-Particle(MCNP) program. Through comparison of the three59Co configurations (schemes) to a prototype PWR (without59Co), we can draw the following conclusions:
1. There are differences noted between the three schemes and the prototype reactor;however,the differences are small.
2. Because cobalt rods have a larger neutron absorption capability than the plug rods, the effective multiplication factor of these three schemes is smaller than the prototype PWR’s.Increasing the number of cobalt rods decreases the effective multiplication factor.
3. For the axial distribution of neutron flux, the scheme with more59Co rods in the reactor is closest to the prototype reactor.
4. Cobalt has a strong ability to absorb neutrons,resulting in a large change in the radial distribution of energy deposition near the location of the cobalt rods.Increasing the number of added59Co rods increases the deviation at those locations.
5. The power peaking locations for the different schemes of59Co loading and the PWR prototype reactor are all at 43 cm from the midpoint of the core;the differences in the power peaking factor are small. Therefore,loading the59Co rods into the PWR has no significant effect on the radial power peaking.
In general, each scheme has its own pros and cons.Replacing the secondary neutron sources in the fuel assemblies with four59Co rods has only a small impact,and the parameters of the reactor remain almost unchanged. Therefore, in theory, the use of a PWR to produce60Co is feasible.
Producing60Co in the PWR is a sound way to mitigate the current shortage of the radioisotope, and an effective way to bring about extra benefits for the nuclear power plants. Yet there are still technical problems to be overcome before realizing the successful production of radioactive cobalt commercially. For instance, a prototype design of the isotope production module is needed for a specific reactor.Performance tests should be carried out on the cobalt source assemblies under the expected conditions of high temperature, high pressure, and a corrosive environment. The impact of the60Co radioactivity on the pressure vessel should also be tested. Moreover, it is necessary to develop the installation, disassembly, and the transportation methods for cobalt source assemblies to meet the operational requirements of the thermal chamber of the spent fuel pool.
杂志排行

Nuclear Science and Techniques的其它文章
- Study of Sallen-Key digital filters in nuclear pulse signal processing
- Advanced topics on RF amplitude and phase detection for lowlevel RF systems
- Recovery of saturated signal waveform acquired from high-energy particles with artificial neural networks
- Assessment of self- and cross-absorbed SAF values for HDRKman using GEANT4 code: internal photon and electron emitters
- Development of alpha surface contamination monitor based on THGEM for contamination distribution
- Single-event effects induced by medium-energy protons in 28 nm system-on-chip