XAFS and SRGI-XRD studies of the local structure of tellurium corrosion of Ni-18%Cr alloy
2019-10-18MiLuoShengJueDengLiLiFeiSongLiHuaWangZhiJunLiZhengJiang
Mi Luo · Sheng-Jue Deng · Li Li · Fei Song · Li-Hua Wang ·Zhi-Jun Li · Zheng Jiang
Abstract The speciation and atomic structures of corrosion products in Ni-based alloys could provide basic information for understanding the Te corrosion mechanism. In this paper, two-dimensional synchrotron-radiation-induced grazing incidence X-ray diffraction was used to characterize the corrosion products of a Ni-18%Cr binary alloy at temperatures from 600 to 1000 °C. The results showed that a film of CrTe is preferentially formed when Te reacts with the Ni-based alloy at low temperatures(below 900 °C), while CrTe and Ni3Te2 are formed at 900 °C. Moreover, at a temperature of 1000 °C, a solid solution is formed without any changes in the Ni-Cr substrate lattice parameters. Furthermore, X-ray absorption fine structure and wavelet transform analyses were used to investigate the atomic local structure of Te. The investigation indicated that Te atoms diffuse into the Ni-Cr substrate to form a substitutional Ni-Cr-Te solid solution at 1000 °C. Notably, based on a discussion of the thermodynamics of the chemical reaction process, CrTe is considered to be the most stable and prevalent corrosion product due to its comparatively lower Gibbs free energy of formation.These results demonstrate that the Ni-18%Cr alloy is capable of resisting the diffusion of Te atoms.
Keywords Ni-Cr alloy · X-ray absorption spectroscopy(XAS) · High-temperature diffusion · Gibbs free energy ·Solid solution
1 Introduction
Molten salt reactors(MSRs),one of the most promising candidates among the Generation-IV nuclear energy systems, have attracted considerable attention due to their advantages such as their inherent safety, ability to recycle fission fuel, and less long-lived radioactive wastes [1, 2].To develop such reactors, Oak Ridge National Laboratory(ORNL) developed Hastelloy N as a structural material with adequate high-temperature mechanical properties and excellent corrosion resistance. However, during the early stages of the Molten Salt Reactor Experiment (MSRE),researchers found apparent intergranular cracking(IGC)on the surface of Hastelloy N, and these cracks would propagate inward after a long time. This caused a serious deterioration of the mechanical properties of the structural materials and can further shorten the lifetime of molten salt reactors [3, 4].
During a series of studies, especially in the Knudsen Cell Reactor experiments [5, 6], researchers observed almost no intergranular cracks on the surface of the Nibased alloy with high Cr content. They proposed that this was because of a new phase formed on the grain boundaries that was stable and inhibited the diffusion of Te at the grain boundaries. This explanation was proposed only based on the previous experimental results with Hastelloy N in the early molten salt reactor. To confirm the mechanism by which Cr inhibits intergranular embrittlement by Te, Jia et al. [7] studied the Ni-Cr binary system to investigate the reaction products formed when Te diffuses inward along the grain boundaries [8]. Two alloys with different amounts of Cr, Ni-7%Cr and Ni-15%Cr, were selected, and the controlled reaction conditions included temperature (800 °C) and reaction time (100 h). They found that Ni3Te2was formed on the surface of both Ni-7%Cr and Ni-15%Cr alloys, while strip-shaped CrTe was only found on the surface of the Ni-15%Cr alloy. The formation of CrTe is the main reason for the diffusion of Te to be suppressed along the grain boundaries, which is the key to protecting the alloy from Te corrosion. Although these results further explain the mechanism by which Cr inhibits intergranular embrittlement by Te, there are two points that need to be investigated further. First, according to the results obtained by ORNL,a Ni-based alloy with Cr content higher than 15 wt%would have a significant effect on cracking resistance, while further research is needed to see whether the reaction product is CrTe.Second,previous research has shown that the reaction products have a strong correlation with the reaction temperature when Te diffuses into a Ni alloy. In detail, experimental research has demonstrated that the corrosion product Ni3Te2slowly decomposes to form Ni metal and Te vapor at 800 °C,while a Ni-Te solid solution is formed in Ni substrates at 1000 °C.However,Jia et al.only focused on a temperature of 800 °C.The reaction products formed in a Ni-Cr binary system at other temperatures also need to be investigated.At the same time, clarifying the atomic structure of the corrosion products can help in better understanding Te corrosion.
Therefore, in this work, a Ni-Cr binary alloy with 18%Cr content was chosen as our research object to investigate the behavior of Te when diffusing into a Ni-based alloy.To understand the effects of annealing temperature and annealing time on the corrosion products, the specimens were exposed to Te vapor for five different reaction times and at five different reaction temperatures. Two-dimensional synchrotron-radiation-induced grazing incidence X-ray diffraction (2D SRGI-XRD), X-ray absorption fine structure(XAFS)analysis,and the wavelet transform(WT)analysis method were used to analyze the reaction products.The primary purpose was to reveal the speciation and the atomic structure of Te corrosion products and confirm the anti-intergranular embrittlement mechanism. Based on our analysis, we elucidate the effect of temperature on the diffusion behavior of Te into Ni-Cr alloys. The results further demonstrate the resistance imparted by high Cr content at high temperature.
2 Experimental section
Ni/Cr foil (0.025 mm thickness) and Te powder(99.999%) were purchased from GoodFellow. The chemical composition of the Ni-Cr binary alloy is summarized in Table 1. Specimens (1 cm × 2 cm) for testing were cut from a heat-treated bar. After that, they were first washed with HCl/H2O (1:10) and rinsed with acetone and ethanol thrice.Then,each specimen and an adequate amount of Te powder were sealed in an evacuated quartz tube(16 mm in diameter and 28 cm in length)with a base pressure greater than 5 × 10⁻⁵mbar. The Te powders were added at approximately 1 mg/cm2according to the size of the specimen and were used to produce a Te vapor atmosphere.Then, all the tubes were annealed in a muffle furnace to induce the thermal diffusion reaction. In combination with the other reaction conditions,we prepared two series of five Te-induced corrosion samples. For the first set, the five tubes were annealed for 100 h in a muffle furnace at 600 °C, 700 °C, 800 °C, 900 °C, and 1000 °C. For the second series, the five tubes were annealed at 800 °C in a muffle furnace for 24, 100, 400, 700, and 1200 h. After that,they were removed from the furnace and cooled in air.
The morphologies of all corrosion products were further examined by using a field-emission scanning electron microscope (FESEM, Hitachi S4800).
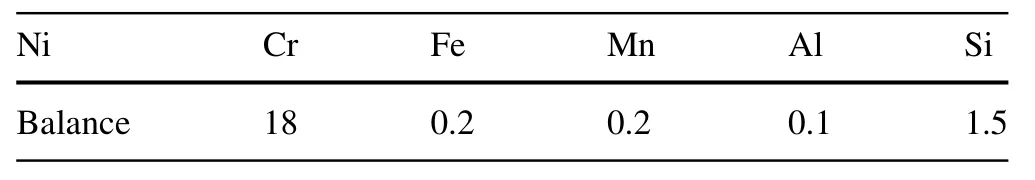
Table 1 Chemical composition of the experimental alloy (wt%)
The 2D SRGI-XRD experiments were performed at beamline BL14B1 of the Shanghai Synchrotron Radiation Facility (SSRF) [9] to identify the phase structures of the reaction products. During the tests, the beam size was 200 μm × 200 μm, the beam energy was 10 keV(λ = 1.24 A˚),and the incident angle was at 2.0°.A Mar225 X-ray detector continuously recorded two-dimensional(2D) diffraction patterns, and the integration time was approximately 20 s. For the calibration, standard LaB6 powder was used and the specimen-to-detector distance was approximately 294 mm. All data were analyzed using Fit2d software.
The X-ray absorption fine structure spectra were measured at beamline BL14W1 of the SSRF [10], a thirdgeneration light source with a 3.5 GeV storage ring running a 250-mA electron beam current in top-up injection mode.The beamline was monochromatized with a doublecrystal monochromator (DCM) equipped with Si(111) and Si(311) crystals and the beam size at the samples was approximately 300 μm × 300 μm (FWHM). The weight percent of Te prevented transmission XANES measurements;thus,the spectra were obtained in the solid detection mode.In this mode,the fluorescence signals were collected with a Vortex Silicon Drift Detector (SDD) at an angle of 45° with respect to the sample surface. A metallic Sb reference foil(50 μm)was used to provide an accurate energy calibration before collecting all Te K-edge spectra. All the spectra were recorded from 31,614 to 32,614 eV using different energy intervals and integration times(31,614-31,794 eV: 5 eV, 5 s; 31,794-31,854 eV: 0.5 eV,5 s; 31,854-31,914 eV: 1 eV, 5 s; 31,914-32,114 eV:2 eV, 5 s; 32,114-32,264 eV: 3 eV, 5 s;32,264-32,414 eV: 4 eV, 5 s; 32,414-32,614 eV: 5 eV,5 s). Each spectrum was recorded over about 51 min in an unfocused mode. The thickness and weight percent of Ni allowed transmission XANES measurements. A transmission XANES spectrum was recorded from a metallic Ni reference foil (6 μm) and used to provide an accurate energy calibration for all Ni K-edge spectra. The first inflection point of the Ni K-edge was set to 8133 eV, and the integration time for different energy intervals was 1 s.Similarly, a transmission XANES spectrum was collected from a metallic Cr reference foil (5 μm) and used to provide an accurate energy calibration for all Cr K-edge spectra.The first inflection point of the Cr-K-edge was set to 5789 eV, and the integration time for different energy intervals was 1 s. Each spectrum was recorded over about 16 min with a focused beam. All XAFS spectra were analyzed using the Demeter software package (University of Chicago) [11]. The XANES raw data were normalized by a procedure consisting of several steps.First,the photon energy was calibrated based on the Te 5f peak of a freshly sputtered gold wafer and then using a substrate line to set the pre-edge at zero. Finally, the spectra were normalized to yield an edge jump to one.For each fitting,a model was set up based on the known crystal structure.
3 Results and discussion
With the exception of the foil held at 1000 °C,thin sheet reaction layers formed on the surfaces of the binary Ni-Cr alloys annealed at various temperatures.The outer reaction layers were scraped from the foil surfaces with tweezers and kept separate from the foils. Figure 1a shows the sample annealed at 800 °C and the black reaction layers formed on the surface of the alloy. To gain more insight into the phase of the reaction products, time-resolved GIXRD experiments were performed afterward. As shown in Fig. 1b-d,the 2D XRD patterns of the reaction products annealed at 600-800 °C exhibit similar diffraction rings.This similarity indicates that the crystal phases are roughly unchanged over the temperature range.However,since the diffraction pattern in Fig. 1e shows quite different diffraction rings, it can be concluded that there may be a new phase produced at an annealing temperature of 900 °C. Moreover, the foil exposed at 1000 °C did not have a visible reaction product. As can be seen in Fig. 1f,the diffraction pattern exhibits only one faint ring.
In order to further reveal the chemical components and crystal phases of all corrosion products,the integral curves(λ = 1.24 A˚converted using Bragg’s law)for the different reaction temperatures are presented in Fig. 1g. It is noted that the peaks at 20.68°,22.92°,23.67°,31.05°,and 36.32°correspond to the (100), (002), (101), (102), and (110)planes of the as-prepared CrTe alloy, respectively, without impurities. The sharpness of the strongest diffraction peak corresponding to the (101) plane indicates a highly crystalline nature. This suggests that specimens exposed to temperatures of 600 °C to 800 °C formed CrTe. In these cases, the only telluride identified is CrTe, which appears to be the most stable and prevalent nickel telluride in the 600 °C to 800 °C temperature range. In addition, at a reaction temperature of 900 °C, besides the X-raydiffraction patterns from the surface itself, peaks were observed from the reaction film as well,which are indexed as CrTe. It must be pointed out that the peaks at 11.64°,14.82°, 15.15°, 21.01°, 22.09°, 22.21°, 22.51°, 23.46°,24.04°, 24.20°, 25.15°, 26.81°, 29.15°, 29.44°, 30.00°,30.23°, 31.20°, 31.59°, 31.86°, 35.56°, 35.65°, 36.15°,37.03°,38.08°,and 38.41°are ascribed to Ni3Te2.Notably,the intensities of the rings at 22.21°, 26.81°, 38.08°, and 38.41° correspond to the indexed planes of (011), (210),(020), and(400)of Ni3Te2,respectively. The XRD pattern from this material is best indexed as a mixture of CrTe and Ni3Te2. What is more, only Cr peaks at 35.44° resulting from (110) planes or Ni peaks at 35.40° corresponding to(111) planes existed after annealing at 1000 °C, which matches well with the analysis of the 2D XRD patterns.The above results indicate that a Ni-Cr-Te solid solution is formed with similar substrate lattice parameters. Our observation of tellurides formed on the Ni-Cr binary alloy in the temperature range of 600-800 °C demonstrates that the most stable and prevalent phase is CrTe.
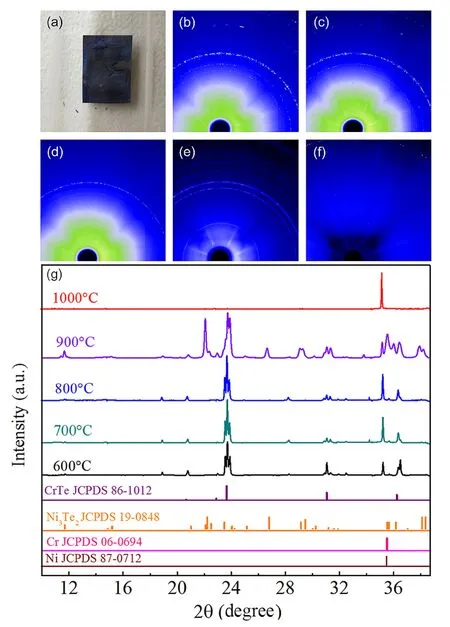
Fig. 1 (Color online) 2D X-ray micro-diffraction patterns of reaction products annealed at various temperatures: a the sample annealed at 800 °C,b 600 °C, c 700 °C, d 800 °C,e 900 °C, and f 1000 °C. g The integral curves (λ = 1.24 A˚ converted using Bragg’s law)of reaction products annealed at different temperatures
The morphologies of the reaction products annealed at temperatures from 800 to 1000 °C for 100 h are compared in Fig. 2. After annealing at 800 °C, many large striated particles are closely packed on the surface, as shown in Fig. 2a. The microstructure evolution of the sample was further examined using high-resolution scanning electron microscopy. Many large blocky particles are dispersedly packed on the surface,as seen from Fig. 2b.Thus,it can be confirmed that these particles are chromium tellurides. For the reaction products annealed at 900 °C, similar results were observed, and there are many large striated particles,as displayed in Fig. 2c. An interesting finding is that the blocky particles formed on the surface at 900 °C (Fig. 2d)are much larger than the reaction products formed at 800 °C.These particles are nickel tellurides and chromium tellurides. The above observations are in agreement with the results of Jia [12] who investigated the effect of temperature on pure Ni, whereas when the temperature was increased to 1000 °C, no reaction products were observed on the surface of the specimen. As can be seen from Fig. 2e,the mean grain size of the specimen was calculated as 22 μm and the surface morphology of the foil changed into trapezoids, as shown in Fig. 2f, which is totally different from the morphology of the other samples.

Fig. 2 Surface morphologies of foil samples annealed at different temperatures for 100 h: a, b 800 °C, c, d 900 °C, e, f 1000 °C
The XAFS technique, due to its excellent sensitivity to atomic species, was applied to further investigate the local geometry around Te atoms in the Ni-Cr substrates. This technique is very useful for the structural characterization of mixtures, especially solid solutions. The X-ray absorption near-edge structures(XANES)of the Te K-edge were measured,as displayed in Fig. 3a.The overall shapes of the spectra of specimens annealed at 600-800 °C are quite similar, including the absorption edge and main peaks, which indicates the presence of Te atoms with similar neighboring atomic structures. The shapes of the spectra of the specimens annealed at 900-1000 °C exhibit differences in the main peaks compared with those of the specimens annealed in 600-800 °C. The observations above correspond well with the results of XRD analysis and suggest that the reaction temperature produces marked effects on the crystal structure. Noticeably, the radial distribution functions (RDFs) of the samples obtained from their k2-weighted Fourier transform EXAFS are shown in Fig. 3b. It should be pointed out that the specimens annealed at 600-800 °C exhibited similar structural features, which implies that there was no change in the local structure of Te atoms.The Fourier transform(FT)curves of these samples exhibit a main peak at 2.27 A˚,corresponding to the Cr-Te scattering contribution. It must be mentioned that there is no prominent Te peak located at 2.6 A˚in the RDF of the annealed sample, which indicates that there were no Te clusters in the annealed sample. This phenomenon clearly indicates that the corrosion product is chromium telluride, which is consistent with the XRD results. In addition, a prominent peak centered at a much lower R position was observed at 2.05 A˚ for the sample annealed at 900 °C. The origin of this peak can be associated with the dominance of the Ni-Te contributions owing to the formation of partial Ni3Te2. Another interesting finding is that the specimens annealed at 1000 °C exhibited two similar main peaks at 2.05 and 2.27 A˚,corresponding to Ni-Te and Cr-Te scattering contributions, respectively. Based on the analysis of the crystal phase, we consider the corrosion product to be a substitutional Ni-Cr-Te solid solution, which can be also verified by wavelet transform (WT) analysis. The wavelet transforms of Te K-edge EXAFS oscillations were further measured to confirm the atomic dispersion of Te throughout the whole corrosion specimen owing to its powerful resolution in both R- and k-spaces. The WT analysis method [13] can decompose each local contribution that contains specific frequency information in the original signal and discern the contribution of each pathway. Thus,more accurate and comprehensive local atomic and electronic structure information can be obtained. The wavelet transform is a new method of transformation analysis,which inherits and develops the idea of localization from the short-time Fourier transform. At the same time, it overcomes the shortcoming that the size of the window does not change with frequency. It is an ideal tool for signal time-frequency analysis, and during processing it can provide a ‘‘time-frequency’’ window which changes with the frequency. Thus, it can focus on the specific details of the signal and has become a great breakthrough in scientific methods after the Fourier transform. The analysis of an EXAFS spectrum is usually based on using a Fourier transform to obtain an EXAFS graph which contains high-frequency EXAFS oscillations and smooth(lowfrequency) background absorption. The removal of background absorption is equivalent to the removal of lowfrequency information from the EXAFS spectrum. Based on this principle, the wavelet transform can denoise and parse the EXAFS data, which are difficult to parse with traditional Fourier transform methods. Thus, the WT analysis method is helpful for identifying the contributions of different pathways quickly and accurately. The WT contour plots of Te foil in Fig. 3d display one intensity maximum at 10.8 A˚-1 in k-space, corresponding to Te-Te coordination. One intensity maximum at 2.6 A˚in R-space could be attributed to Te-Te bonding. The WT intensity maximum at 8.5 A˚-1 for the samples annealed at 600 °C,700 °C, and 800 °C, could be attributed to Cr-Te scattering but not Te-Te scattering by comparison with the WT plots of the Te foil. Additionally, for the lower coordination, the WT plots further visually display an intensity maximum at 8.0 A˚-1 which can be ascribed to the Ni-Te scattering contribution. Therefore, the analysis of WTEXAFS oscillations is well consistent with the observations made from FT-EXAFS.

Fig. 3 (Color online)a X-ray absorption spectra at the Te K-edge of foils annealed at different temperatures for 100 h. b RDFs of the annealed samples as well as the Te standard. The k range used in the FT was 3.0 to 12.384 A˚-1 for all data sets. c Typical fitting curve of the Te EXAFS signal in R-space for five specimens annealed from 600 to 1000 °C.The black solid line represents the experimental data,and the red solid line represents the best fitting.d Wavelet transforms for the k2-weighted Te K-edge EXAFS signals for the highcoordination shells. The colors in the contour figures indicate the moduli of the Morlet wavelet transform
To quantitatively extract the structural parameters for the atoms surrounding the central Te atoms, we further fitted the main FT peaks from 1.3 to 3.0 A˚for the annealed samples. The best fitting indicates that for the samples annealed at 600-800 °C,the first shell peak near 2.27 A˚is due to the Cr-Te scattering contribution. The path was fixed to the CrTe intermetallic phase and this model produced a satisfactory fit(Fig. 3c) with the percentage misfit(R-factor) being under 1.0%. Nevertheless, the fitting results deteriorate dramatically when a Te-Te path is attached to each shell, which suggests that no Te clusters exist.The next peak near 2.05 A˚observed in the specimen annealed at 900 °C can be ascribed to the Ni-Te contribution. The paths were fixed to both Ni3Te2and CrTe intermetallic phases, and these models produced a satisfactory fit with the percentage misfit (R-factor) being 1.9%. Our results are summarized in Table 2, and they further show that the most prevalent telluride phase formed on the Ni-Cr binary alloy in the temperature range of 600-800 °C is CrTe. Both Ni3Te2and CrTe intermetallic phases can be obtained at 900 °C. When the reaction temperature was increased to 1000 °C, as shown in Fig. 4,the FT curves of the Cr K-edge and Ni K-edge exhibited an fcc structure feature similar to that of the reference Ni,which implies that the local structures around the Ni and Cr atoms in the annealed sample are similar to that of fcc Ni.This provides direct evidence that Cr substitutes for Ni atoms to form a Ni-Cr solid solution. It is important to highlight that the FT curve of Te is similar to that of Ni but is different from that of pure Te,which implies that Te has diffused into the lattice and formed a Ni-Cr-Te solid solution in the sample annealed at 1000 °C.
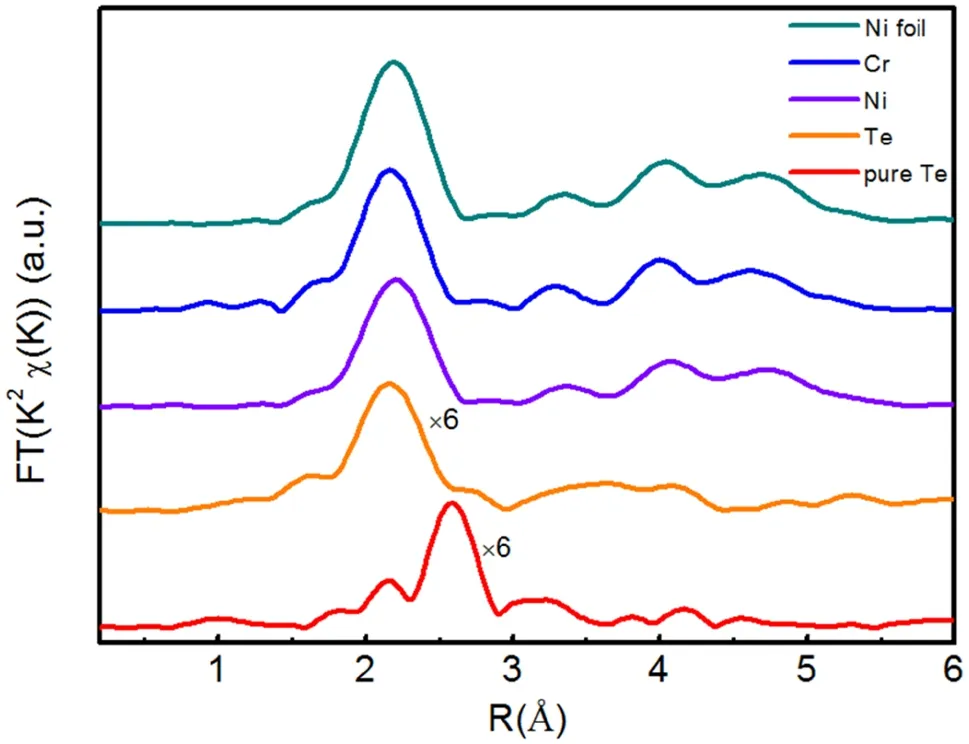
Fig. 4 (Color online) Typical Fourier transform of the k2-weighted EXAFS spectra of the sample annealed at 1000 °C, including Cr K-edge,Ni K-edge,and Te K-edge,as well as the standard Ni foil and Te foil.The k range used in the FT was from 3.0 to 12.41 A˚-1 for all data

Table 2 Structural parameters of the samples obtained from EXAFS fitting
In order to verify the stability of chromium telluride,several specimens exposed to Te vapor at 800 °C for 24 to 1200 h were used for reference. XANES measurements of the Te K-edge of the specimens were performed,as shown in Fig. 5a. The overall shapes of the spectra of all specimens include a quite similar absorption edge and main peaks, which suggests the presence of Te atoms in these corrosion products with similar neighboring atomic structures. The RDFs of the samples after solution treatment obtained from their k2-weighted EXAFS by Fourier transform analysis are displayed in Fig. 5b.It should be pointed out that the FTs of the EXAFS spectra for these specimens after different annealing times from 24 to 1200 h exhibit similar structure features, which implies that there was no change in the local structure around the Te atoms in the five samples. The FT curves of these samples have a main peak at 2.27 A˚, corresponding to the Cr-Te scattering contribution, which indicates that the corrosion product at 800 °C is chromium telluride,even if the annealing time is as long as 1200 h. Therefore, we consider CrTe to be the most stable and prevalent compound. We further fitted the FT main peaks from 1.3 to 3.0 A˚,and the fitting results are summarized in Table 2. The best fitting indicates that the main peak of the samples near 2.27 A˚can be ascribed to the Cr-Te scattering contribution.The path was fixed to the CrTe intermetallic phase, and this model produced a satisfactory fit (Fig. 5c) with the percentage of all misfit (Rfactor) below 1.0%. Nevertheless, the fitting results deteriorate dramatically when the Te-Te path is attached to each shell, which suggests that no Te clusters exist. The above phenomenon clearly provides direct evidence that when the annealing temperature was 800 °C, only CrTe was observed without other tellurides, which is also confirmed by wavelet transform analysis. The wavelet transform of the Te K-edge EXAFS oscillations was further measured to confirm the atomic dispersion of Te throughout the whole corrosion specimen due to its speed and accurate resolution in both R-and k-spaces.As can be seen in Fig. 5d,the WT contour plots of the sample annealed for 24 h display one intensity maximum at 8.45 A˚-1 in kspace, corresponding to Cr-Te coordination. One intensity maximum at 2.4 A˚in R-space could be attributed to Cr-Te bonding.The WT intensity maximum at 8.5 A˚-1 observed for samples annealed for 100, 400, 700, and 1200 h could be associated with Cr-Te scattering but not Te-Te scattering; this can be confirmed by comparison with the WT plots of Te foil mentioned above. The analysis of WTEXAFS oscillations is well consistent with the results of FT-EXAFS analysis.

Fig. 5 (Color online) a X-ray absorption near-edge structure spectra at the Te K-edge of samples annealed at 800 °C for 24 to 1200 h.b RDFs of the annealed samples.The k range used in the FT was from 3.0 to 12.384 A˚-1 for all data sets. c Typical fitting curve of the Te EXAFS signal in R-space for five specimens annealed from 24 to 1200 h at 800 °C. The black solid line represents the experimental data and the red solid line represents the best fitting. d Wavelet transforms for the k2-weighted Te K-edge EXAFS signals for the high-coordination shells.The colors in the contour figures indicate the moduli of the Morlet wavelet transform
The fraction of Te which actually propagates into the specimen is probably quite small, with the remainder reacting to form various telluride intermetallic compounds on the surface. Based on the above experimental results,the reaction products greatly changed with varying reaction temperature. It is worth noting that there are three phases(beta,gamma,and delta)in the Ni-Te system and β-Ni3Te2is deemed to be the main stable nickel telluride [14, 15].The Gibbs free energy of formation per molecule of Te(ΔG0) for Ni3Te2is 58.95 kJ/mol, which is more negative than that of NiTe (36.85 kJ/mol) calculated by Jia [7].However, our observation of tellurides formed on a Ni-Cr alloy over a temperature range of 600 °C to 800 °C indicates that the most stable and prevalent phase is CrTe.Moreover, the presence of CrTe and ‘‘Hastelloy N’’ as the Knudsen cell reaction products after the 750 °C exposure indicates that CrTe is much more stable than Ni3Te2.Concurrently, according to the results of Azad et al. [16],the ΔG0of Cr2Te3is- 54.05 kJ/mol by calculation,while the ΔG0of CrTe and Cr5Te8can be calculated as 61.58 kJ/mol and 14.89 kJ/mol, respectively, based on the enthalpy and entropy at 800 °C[17,18].CrTe exhibits the best stability, as its ΔG0value is the most negative(61.58 kJ/mol) of the several compounds and even more negative than that of Ni3Te2. Although Ni3Te2appears to be the most stable nickel telluride, the presence of CrTe indicates that CrTe is much more stable than Ni3Te2.Therefore, CrTe must be the most preferentially formed compound in the Te/Ni-Cr system.
To sum up, our work clearly reveals the formation process of reaction products. This process can be summarized as follows. Firstly, the active metal component Cr from alloys with high Cr content would diffuse along grain boundaries to the surface of the alloy due to the complex chemical processes that occur at high temperature due to its comparatively lower Gibbs free energy compared to that of other impurities[19].Then,CrTe preferentially forms due to its more negative ΔG0compared to Cr and Te at that temperature (600-800 °C). With the reaction temperature increased to 900 °C, some of the CrTe intermetallic compounds decompose to Te and crystalline Cr. Then, the reaction between the fraction of Te and the large amount of Ni continues, thus forming Ni3Te2. In addition, at 1000 °C,no diffraction peaks of tellurides were detected by XRD.Nevertheless, the results of XAFS analysis showed the existence of Te in the Ni-Cr matrix, which revealed that a majority of Te had permeated into the matrix.According to the results previously reported by ORNL, many Ni-based alloys do not suffer from cracks probably because Te is tied up in a stable and relatively innocuous compound. Jia et al.[7] demonstrated that a Ni-Cr alloy with high Cr (15%)content can resist the diffusion of Te and contribute to the formation of CrTe. In this work, we have identified the reaction products which are formed when Ni-Cr alloys are exposed to a Te atmosphere by vapor deposition at elevated temperature. Cr has the tendency to diffuse to the surface,react with Te in products,and continue forming CrTe when the reaction temperatures are in the range of 600 °C to 800 °C. At the same time, Cr segregates in the GBs and grain crystals near the surface of the alloy, while Te is tied up as CrTe and is unable to diffuse into the alloy along grain boundaries.This is the reason that Cr plays a crucial role in controlling corrosion properties. However, when the reaction temperature is increased to 900 °C,Te has the tendency to react with Ni and form Ni3Te2due to the decomposition of CrTe. Meanwhile, Te atoms will propagate inward into the alloy along GBs forming apparent intergranular cracking(IGC), which seriously degrades the mechanical properties of the structural material. The results at 1000 °C revealed that a majority of Te had penetrated into the lattice after a longer annealing time, and then a Ni-Cr-Te solid solution was formed.Cr seems effective in reducing the intergranular cracking. On the other hand, the dominant corrosion mechanism in fluorine salts is the selective removal of Cr,so the Cr concentration must be limited (to some undefined values) to limit the amount of corrosion. Testing is underway to better define the minimum amount of Cr necessary to prevent cracking as well as the maximum amount that will lead to acceptable corrosion rates.
4 Conclusion
Samples of a Ni-18%Cr binary alloy were exposed to Te by vapor deposition,and the high-temperature corrosion behavior was investigated at different annealing temperatures. The speciation and local atomic structure of the resulting films were identified by synchrotron-radiation-based SRGI-XRD and XAFS measurements. Our observations indicate that the most stable and prevalent phase is CrTe.The internal Cr diffuses from the bulk to the surface along the grain boundaries and segregates in the GBs and grain crystals near the surface of the alloy. Thus,Te may be tied up in a stable and relatively innocuous form as CrTe, which explains the vital role played by Cr segregation in controlling the corrosion properties. It is indicated that Te compounds were primarily formed on the surface of the Ni-Cr substrate and then decomposed when the temperature was increased. Additionally, a fraction of Te propagated inward into the substrate and formed a substitutional solid solution at 1000 °C. We present a comprehensive study of the penetration of Te into a Ni-Cr alloy as a function of temperature and explain why Nibased alloys (Cr content is 18%) do not suffer from intergranular cracks at certain temperatures.
杂志排行

Nuclear Science and Techniques的其它文章
- Study of Sallen-Key digital filters in nuclear pulse signal processing
- Advanced topics on RF amplitude and phase detection for lowlevel RF systems
- Feasibility analysis of 60Co production in pressurized water reactors
- Recovery of saturated signal waveform acquired from high-energy particles with artificial neural networks
- Assessment of self- and cross-absorbed SAF values for HDRKman using GEANT4 code: internal photon and electron emitters
- Development of alpha surface contamination monitor based on THGEM for contamination distribution