Reliability analysis of the gasification process of nuclear fuel manufacturing facilities based on the GO methodology
2019-10-18YanWangZhiJieGuBingLianJieYangYangJunZhao
Yan Wang · Zhi-Jie Gu · Bing Lian · Jie Yang · Yang-Jun Zhao
Abstract Uranium hexafluoride (UF6) leakage accidents represent one of the most serious classes of accidents in the gasification process in nuclear fuel manufacturing facilities. Common UF6 leakage accidents include various fault conditions, such as pipeline and valve breakages or ruptures and pipeline blockages.By establishing goal-oriented(GO) operators that can represent multi-fault states, this study estimates the probabilities of various fault states corresponding to UF6 leakage accidents in the gasification process using the GO methodology and analyzes the system reliability. This article expands the scope of the GO methodology and provides technical support for reliability analysis using the GO methodology in multi-fault systems.
Keywords GO methodology·Operator·Multi-fault state·Reliability analysis · UF6 leakage
1 Introduction
Uranium hexafluoride (UF6) is a raw material for manufacturing nuclear fuel.In terms of its chemical properties,UF6is relatively active and yields both radiation and chemical toxicity [1]. Therefore, leakage accidents involving UF6represent one of the most serious types of accidents in nuclear fuel manufacturing facilities.Between 1944 and 1987, there were 48 recorded UF6leakage accidents, resulting in five deaths and over 100 injuries [2].These had a huge impact on operations, staff, the public,and the environment.
The point at which UF6leaks may occur in nuclear fuel manufacturing facilities is during the gasification process,where solid UF6is heated and vaporized in the gasification tank and then transported through the system in gaseous form. This process involves many pipelines and valves.During operation, if the pipelines or valves are damaged,then UF6leakages may occur. According to accident statistics, the proportion of accidents caused by pipeline and valve faults in UF6leakage accidents stands at 54%[2], rendering this as the main cause of UF6leakage accidents. Thus, this is the focus of the present system reliability analysis.
The goal-oriented (GO) methodology is a probabilistic analysis technique that can qualitatively and quantitatively analyze the reliability of a system [3-10]. The GO methodology can analyze the sequence of events in a state of system success, fault, and so on and calculate the probability value of the respective state, study the contribution of each component of the system to that state, and evaluate the reliability of the system.This is applicable to a system involving actual material flow.
In the GO methodology, the ‘‘operators’’ are used to represent the components of the system(such as the power,equipment,pipes,and valves)or logical relationships(such as AND, OR, and NOT), and these operators utilize the corresponding operational rules to represent the function or logical relationships between their corresponding components.The GO methodology involves 17 standard operators[9-11], referred to as Types 1-17. Operators can be categorized as input operators,logical operators,and functional operators. Input operators include Types 4 and 5, which only have output signals, and at least one input operator is required as a system input in the GO map. Logical operators include Types 2, 10, and 11, which are utilized to represent the logical relationships between system signal flows,and no actual unit parts corresponding to these exist in the system. The remaining operators are functional operators, which each represent and correspond to one of the system units. These are connected to the system and other units through input and output signals.
In addition to the GO methodology, there exist some alternative methods for multi-fault analysis. For example,Zhao et al. [12] proposed a reconstruction modeling strategy, which can capture the combinatorial nature of multiple faults and handle the problem of multiple-fault diagnosis. Yu et al. [13] proposed a multi-model exponential discriminant analysis (MEDA) algorithm to solve multi-fault diagnosis problems, where two or more faults occur simultaneously or sequentially.
The gasification process primarily transports gaseous UF6in the system. The methods in Refs. [12, 13] are mainly employed to simplify the analysis of faults in complex systems with multiple sub-faults.The gasification process and causes of system failure are relatively simple.In comparison, the GO methodology is more suitable for performing fault analysis on the gasification process.In this study, the GO methodology is adopted to analyze the reliability of the gasification process and estimate the probability values of UF6leakage accidents.
Standard GO methodology operators have some limitations to their use. Many researchers have extended the scope of the GO methodology by improving the algorithm or establishing new operators.For example,Shen et al.[14]proposed a more convenient and faster probability formula algorithm than the state combination algorithm.Zhou et al.[15] improved the Type 3 and 15 operators such that they could be utilized to describe multi-state output signals. Yi et al. [16, 17] established a GO operator combination,which is consisted by two operators, used to represent a multifunctional component. Yi et al. [18] created a new operator based on Markov process theory and applied this to conduct a quantitative reliability analysis of a hydraulic steering system for a heavy vehicle.
There exist many fault states for pipelines and valvessuch as breakages, ruptures, and pipeline blockages-but existing standard GO operators are intended for single fault states, and there are certain limitations on the reliability analysis of a multi-fault state system. By analyzing the system process of the gasification process and the fault characteristics of the related equipment, this study creates GO operators that can be used to represent a multi-fault state and determines the operation rules and probability formula algorithm. Then, the accident sequences of different states are analyzed, calculating the state probability value, identifying the weak links of the system and key equipment and analyzing the reliability of the gasification process to provide technical support to improve the overall safety and reliability of the system. At the same time, this study verifies the flexibility and adaptability of the GO methodology, extends its scope of use, and provides technical support for reliability analysis using the GO methodology in a multi-fault system.
2 GO methodology overview
The GO methodology is a success-oriented system analysis technique [9, 14, 19], which is based on a system schematic diagram,flow chart,or engineering diagram and employs operators and signal flows to model a system in the manner of a one-to-one correspondence to form a GO map.
FTA, which has been developed and applied in the industrial sector,is often adopted for system reliability and risk assessment analysis. However, FTA has certain limitations. For example, for a system with multiple states or signal feedback, or a maintainable system with time-sequential changes, FTA may become more complex or ineffective. As another system probability analysis technology, the GO methodology has its own characteristics.The GO methodology is more suitable for the safety analysis of a multi-state,time-sequential system,especially for production processes with actual logistics.
Although both FTA and the GO methodology use graphics to simulate a system,the GO methodology has the following advantages:
1. FTA modeling is based on the deductive method and is fault-oriented, whereas GO methodology modeling is based on the induction method and is success-oriented.
2. Human factors have a significant influence on FTA modeling. Fault trees built by different people may have significant differences, which are not easy to crosscheck and can easily be omitted or repeated. The GO methodology is modeled according to the system flow chart. The modeling process is simple, and models built by different people will not be significantly different. Thus, they are easy to check and verify, and there are no omissions.
3. FTA is highly convenient for the analysis of two states(success and fault) and non-sequential systems. However, the analysis of multi-state and time-sequential systems is highly complicated, and sometimes even ineffective.The GO methodology expresses the system using different data.The various states can indicate not only the success and failure status of the system, but also effectively describe multi-state events. It can also simulate systems with sequence or timing requirements, especially for the analysis of a flow system.
4. FTA must first find the minimum cut set and then calculate the probability of the system’s top event based on the minimum cut set. The quantitative calculation of the GO methodology is based on the algorithms of the GO operators, and the quantitative calculation is performed directly without the need to first determine the minimum cut set.The minimum cut set can be obtained through a direct qualitative analysis.
In the GO methodology, a unit refers to an element,component, or subsystem in the system. Aside from the input unit, which only has an output signal, all other units have an input and output signal. Operators can represent various types of units, characterizing unit functions using an algorithm, and characterizing the input and output signals through state probability data. Each type of operator has specific data requirements and algorithms to characterize the function of the unit.Operators,input signals,and output signals are,respectively,represented by C,S,and R,and state values are represented by VC, VS, and VR.
The signal flow is used to connect the operators, to represent the relationships between them, such as the transport of gas, liquid, or current in the system; the direction of flow; or the connections and combinations between operators. The signal flow is qualitatively expressed by the state and quantitatively expressed by the state probability. Usually, the signal flow has (N + 1)states, which are represented by 0, 1, …, N. Here, 0 represents a system advance state, in which the action occurs before the signal arrives; 1, …, N - 1 represent various successful states of the system; and N represents the fault state of the system. The probability corresponding to each state is P(i), i = 0, …, N, and the sum of all state probabilities is 1.
Based on the GO maps, operators, and signal flows, a qualitative and quantitative reliability analysis of the systems can be conducted.The steps of the reliability analysis include a system analysis; determination of the system boundaries; determination of the system success criteria;the establishment of GO maps, input data, and GO operations; and a systematic evaluation [11].
3 Description of the gasification process system
The gasification process of a nuclear fuel manufacturing facility involves heating and gasifying the solid UF6in the UF6storage container and supplying it to the next process.During gasification,the UF6storage container is placed in a special gasification tank. The compressed air between the gasification tank and the UF6storage container is heated by electricity to reach the gasification temperature of UF6.The UF6in the container is gasified, and then the gaseous UF6is fed to the next process through the heat tracing pipeline[20]. During the gasification process, the system is in a high-temperature and high-pressure state.If the pipeline or valve is damaged, then the UF6gas may leak from the damaged parts. If the electric heating belt does not supply adequate heat, then the gaseous UF6will condense and solidify, blocking the pipeline.
The main features of the gasification process are the large amount of UF6, long gasification time, and hightemperature and high-pressure state of the system. The main issues are as follows: (1) the amount of UF6in the gasification process is the largest in a nuclear fuel manufacturing facility; (2) the gasification process needs to maintain a high temperature to ensure that the solid UF6will always be in a gaseous state; (3) according to the nature of UF6, the UF6volume will increase during the gasification process,and thus the whole process occurs at a high state of pressure;and(4)the gasification process takes a long time-it takes approximately 33.3 h for a UF6storage container to complete gasification [21]. Therefore,when conducting an environmental risk assessment of a nuclear fuel manufacturing facility,it is necessary to focus on UF6leakage accidents in the gasification process.
4 GO operator improvement
The standard GO operator for a multi-state includes an advance state, a plurality of successful states, and a fault state. Equipment such as pipelines and valves is usually simplified to two states of success and fault.In fact,there is normally more than one fault state for pipelines, valves,and other equipment-including leakage, blockage, pipeline fracture, and valve rupture-and there are no multifault states to represent this in the existing standard GO operator.
In the gasification process, pipeline and valve faults represent one of the main causes of UF6leakage accidents.Therefore, this study establishes new GO operators and algorithms for multi-fault states depending on the operating characteristics of pipelines and valves in the gasification process. In this manner, the GO methodology can be utilized to analyze the reliability of the gasification process,determining the probabilities of different fault states.
4.1 Three-state unit
4.1.1 Symbol
In this article,the three-state unit is defined as the Type 18 operator. The symbol of type 18 operator is shown in Fig. 1.
4.1.2 Description
The operator has one input and one output signal,which can simulate a three-state unit with one successful state and two fault states. If the signal passes successfully, this represents a successful state, a partial loss of the signal represents a loss state(i.e.,pipeline or valve leakage),and a total loss of the signal represents an absence state(i.e.,pipe breakage or valve rupture).In the loss state,the signal will continue transmitting to the downstream process, and the state of the signal in the downstream process will appear as a loss state. In the absence state, the signal cannot be transmitted to the downstream process, and the signal is terminated.
The state value VR= 1,…,N - 1,N,N1,N2,where(1,…, N - 1) represents signal success states, N represents a fault state corresponding to a fault in equipment other than the pipelines and valves, N1represents a signal loss state,and N2represents a signal absence state.
4.1.3 Algorithms
The algorithms for the three-state unit operator are presented in Table 1.
The state probability of the input signal is PS(i); the state cumulative probability is AS(i); the state probability of the output signal is PR(i); the state cumulative probability is AR(i);and the state values of the input and output signals are i, with i = 1, …, N, N1, N2.
The state probability of the operator is PC(i), i = 1 …N - 1, N1, N2.
The probability formulas of the state probability and state cumulative probability for the successful state of the output signal are, respectively.


Fig. 1 Symbol of the Type 18 operator

Table 1 Algorithms for the three-state unit operator
The probability formulas of the state probability and the state cumulative probability for the loss state of the output signal are, respectively.

The probability formulas of the state probability and the state cumulative probability for the absence state of the output signal are, respectively

The probability formulas of the state probability and the state cumulative probability for the fault state of the output signal are, respectively

4.2 Two input signals and one output signal unit
4.2.1 Symbol
Fig. 2 Symbol of the Type 19 operator
In this article, the operator for a unit with two input signals and one output signal is defined as the Type 19 operator.The symbol of this operator is presented in Fig. 2.
4.2.2 Description
This operator has two input signals and one output signal.One of the input signals is a two-state unit,namely a success and fault state.The other input signal is a four-state unit, namely a success, loss, absence, and fault state. The unit that the operator simulates is a three-state unit,namely a success, loss, and absence state. The output signal has five states, namely a success, loss, absence, blockage, and fault state. Where the signal stops transmission owing to pipeline blockage, this is in the blockage state. In the blockage state, the signal cannot be transmitted downstream, and the signal is terminated.
This operator is mainly utilized to represent transfer pipelines that require electric heating. The two input signals comprise the incoming material pipeline and electric heater, and the unit is the transfer pipeline being heated.
The state values are VR= 1 ~N - 1, N, N1, N2, and N3, where N3represents the blockage state.
4.2.3 Algorithms
The algorithms for the two input signals and one output signal unit operator are presented in Table 2.
The state probability of the first input signal is PS1(i);the state cumulative probability is AS1(i);and i is the state value of the first input signal, with i = 1, …, N.
The state probability of the second input signal is PS2(i); the state cumulative probability is AS2(i); and i is the state value of the second input signal,with i = 1,…,N,N1,N2.
The state probability of the output signal is PR(i); the state cumulative probability is AR(i); and i is the state value of the output signal, with i = 1, …, N, N1, N2, N3.
The state probability of the operator is PC(i), i = 1, …,N - 1, N1, N2.
The probability formulas of the state probability and state cumulative probability for the successful state of the output signal are, respectively
The probability formulas of the state probability and state cumulative probability for the loss state of the output signal are, respectively

The probability formulas of the state probability and state cumulative probability for the absence state of the output signal are, respectively

The probability formulas of the state probability and state cumulative probability for the blockage state of the output signal are, respectively
The probability formulas of the state probability and state cumulative probability for the fault state of the output signal are, respectively


Table 2 Algorithms for the two input signals and one output signal unit operator
5 Reliability analysis using the GO methodology
5.1 System analysis
During gasification, a magnetic drive fan is arranged at the end of the gasification tank to promote the circulation of hot air in the gasification tank,ensuring uniform heating of the container and improving the heating efficiency of gasification. Then, the outlet valve of the container is opened,and the UF6gas is transported to the outside of the gasification tank through a metal hose. The isolation valve outside the gasification tank is connected with the conveying pipeline,and the material is fed to the next process.The conveying pipeline is insulated by an electrical heating belt, with a temperature controller to prevent the gaseous UF6from condensing to a solid and blocking the pipeline.
The gaseous UF6has the characteristics of a high temperature, a high pressure, corrosiveness, and lively physicochemical properties. In the case of a pipeline or valve fault, UF6leakage will occur. The system analysis focuses on the transmission of materials in the feeding system and analyzes the potential states of each piece of equipment during transmission.
5.2 Establishment of a GO map of the system
According to the system description and system flow chart [20], corresponding GO operators are chosen according to the functions of the system components.Then,as shown in Fig. 3, the GO map is formed by connecting the operators with using logical operators and the signal flow.In the GO map,there are two numbers in the operator symbol. The first is used to represent the type of operator,and the second represents the number of the operator. As these are dependent on the relationships between operators,the operators are connected using a signal stream.
The relevant data for each operator in the GO map of the UF6gasification process are presented in Table 3. The corresponding equipment for each operator and the type number, state number, and state probability for each state are provided in table.The state probabilities of operators 1,2,and 10 are taken from[22],and the state probabilities of the other operators are taken from [23].
5.3 System reliability analysis
The states and probabilities of all the operators except logical operators in the GO map of the system can be used in the qualitative analysis to determine the minimum cut set of the system. In the calculation process of the N-order system cut set,for all operators in the system,it is assumed that all N operators are in a non-successful state (i.e., loss,absence,fault state),i.e.,the probability of their successful state is 0. The remaining operators maintain the original state probability, and the probability of success of the system is calculated under the combination of states.If the probability is 0, then the fault state combination of the N operators is an N-order cut set of the corresponding fault state of the system,and the combination calculation can be performed in turn until all the N-order cuts of the system are obtained. When calculating a high-order cut set of the system,a high-order combination cannot contain low-order cut sets,and thus all the obtained cut sets are the minimum cut sets of the system.
According to the success probability formulas of all operators except the logical operators in the system, the success probability formula of the output signal of the UF6gasification process system is

Fig. 3 GO map of the UF6 gasification process
It can be observed that the UF6gasification process system is a serial process flow, and the success probability formula of the system’s output signal is the product of the success probabilities for each operator. Through the analysis, it was found that the minimum cut sets of the system were first-order cut set.There were 11 minimum cut sets in total, of which seven were two-state operators, namely operators 1,2,3,4,6,10,and 11,and four were three-state operators, namely operators 7, 8, 9, and 12. According to the role of each operator in the system, the loss state operators 7,8,9,and 12 corresponded to a loss state of the system; the absence state operators 7, 8, 9, and 12 corresponded to an absence state of the system; the fault state operators 1, 2, 3, 4, and 6 corresponded to a fault state of the system; and the blockage state operators 10 and 11 corresponded to a blockage state of the system.

Table 3 Operator data in the GO map of the UF6 gasification process
The probabilistic formula algorithm was utilized to quantitatively calculate the state probability and state accumulation probability of the output signal flow of the UF6gasification process. The probability formula algorithm utilizes the probability formula for each operator to quantitatively calculate the operators in the GO map oneby-one to obtain the state probability and state cumulative probability of the corresponding signal stream, and finally obtain the exact probability of system success or fault.The minimum cut sets are independent of each other, and the probability of system fault is represented by the sum of the probabilities of all the minimum cut sets in the system.
Table 4 presents the reliability analysis results of the UF6gasification process system. Table 4 shows the following:
1. The probability of system success was 0.999966849,the probability of a loss state (i.e., pipeline or valve leakage) was 0.000000240, the probability of an absence state (i.e., pipe breakage or valve rupture)was 0.000000111, the probability of a blockage state was 0.000001265, and the probability of no UF6passing owing to other equipment faults was 0.000031535.
2. The system loss state included four minimum cut sets:71, 81, 91, and 121. The corresponding bottom events comprised UF6storage container outlet valve leakage,metal hose leakage, isolation valve leakage, and heat tracing pipeline leakage. The occurrence probabilities of the minimum cut sets were 1.0 × 10-7,1.0 × 10-8,1.0 × 10-7, and 3.0 × 10⁻⁸, respectively.
3. The system absence state included four minimum cut sets: 72, 82, 92, and 122. The corresponding bottom events comprised UF6storage container outlet valve rupture, metal hose break, isolation valve rupture,and heat tracing pipeline break. The occurrence probabilities of the minimum cut sets were 5.0 × 10⁻⁹, 1.0 × 10⁻⁷, 5.0 × 10⁻⁹, and 1.0 ×10⁻⁹, respectively.
4. The system blockage state included two minimum cut sets: 102and 112. The corresponding bottom events comprised power supply 3 fault and electric heating belt fault. The occurrence probabilities of the minimum cut sets were 2.65 × 10⁻⁷and 1.0 × 10⁻⁶,respectively.
5. The system fault state included five minimum cut sets:12,22,32,42,and 62.The corresponding bottom events comprised power supply 1 fault, power supply 2 fault,electric heater fault, magnetic drive fan fault, and UF6storage container fault.The occurrence probabilities of the minimum cut sets were 2.65 × 10⁻⁷, 2.65 ×10⁻⁷, 1.0 × 10⁻⁶, 3.0 × 10⁻⁵, and 5.0 × 10⁻⁹,respectively.
6. The system accident types mainly comprised pipeline or valve leakages,pipeline breakages or valve ruptures,blockages of the heat tracing pipeline, and no UF6passage owing to other equipment faults.According to the probability of each accident, the order of importance of accidents was as follows: no UF6passage caused by other equipment fault, blockage of the heat tracing pipeline, pipeline or valve leakage, and pipe breakage or valve rupture.
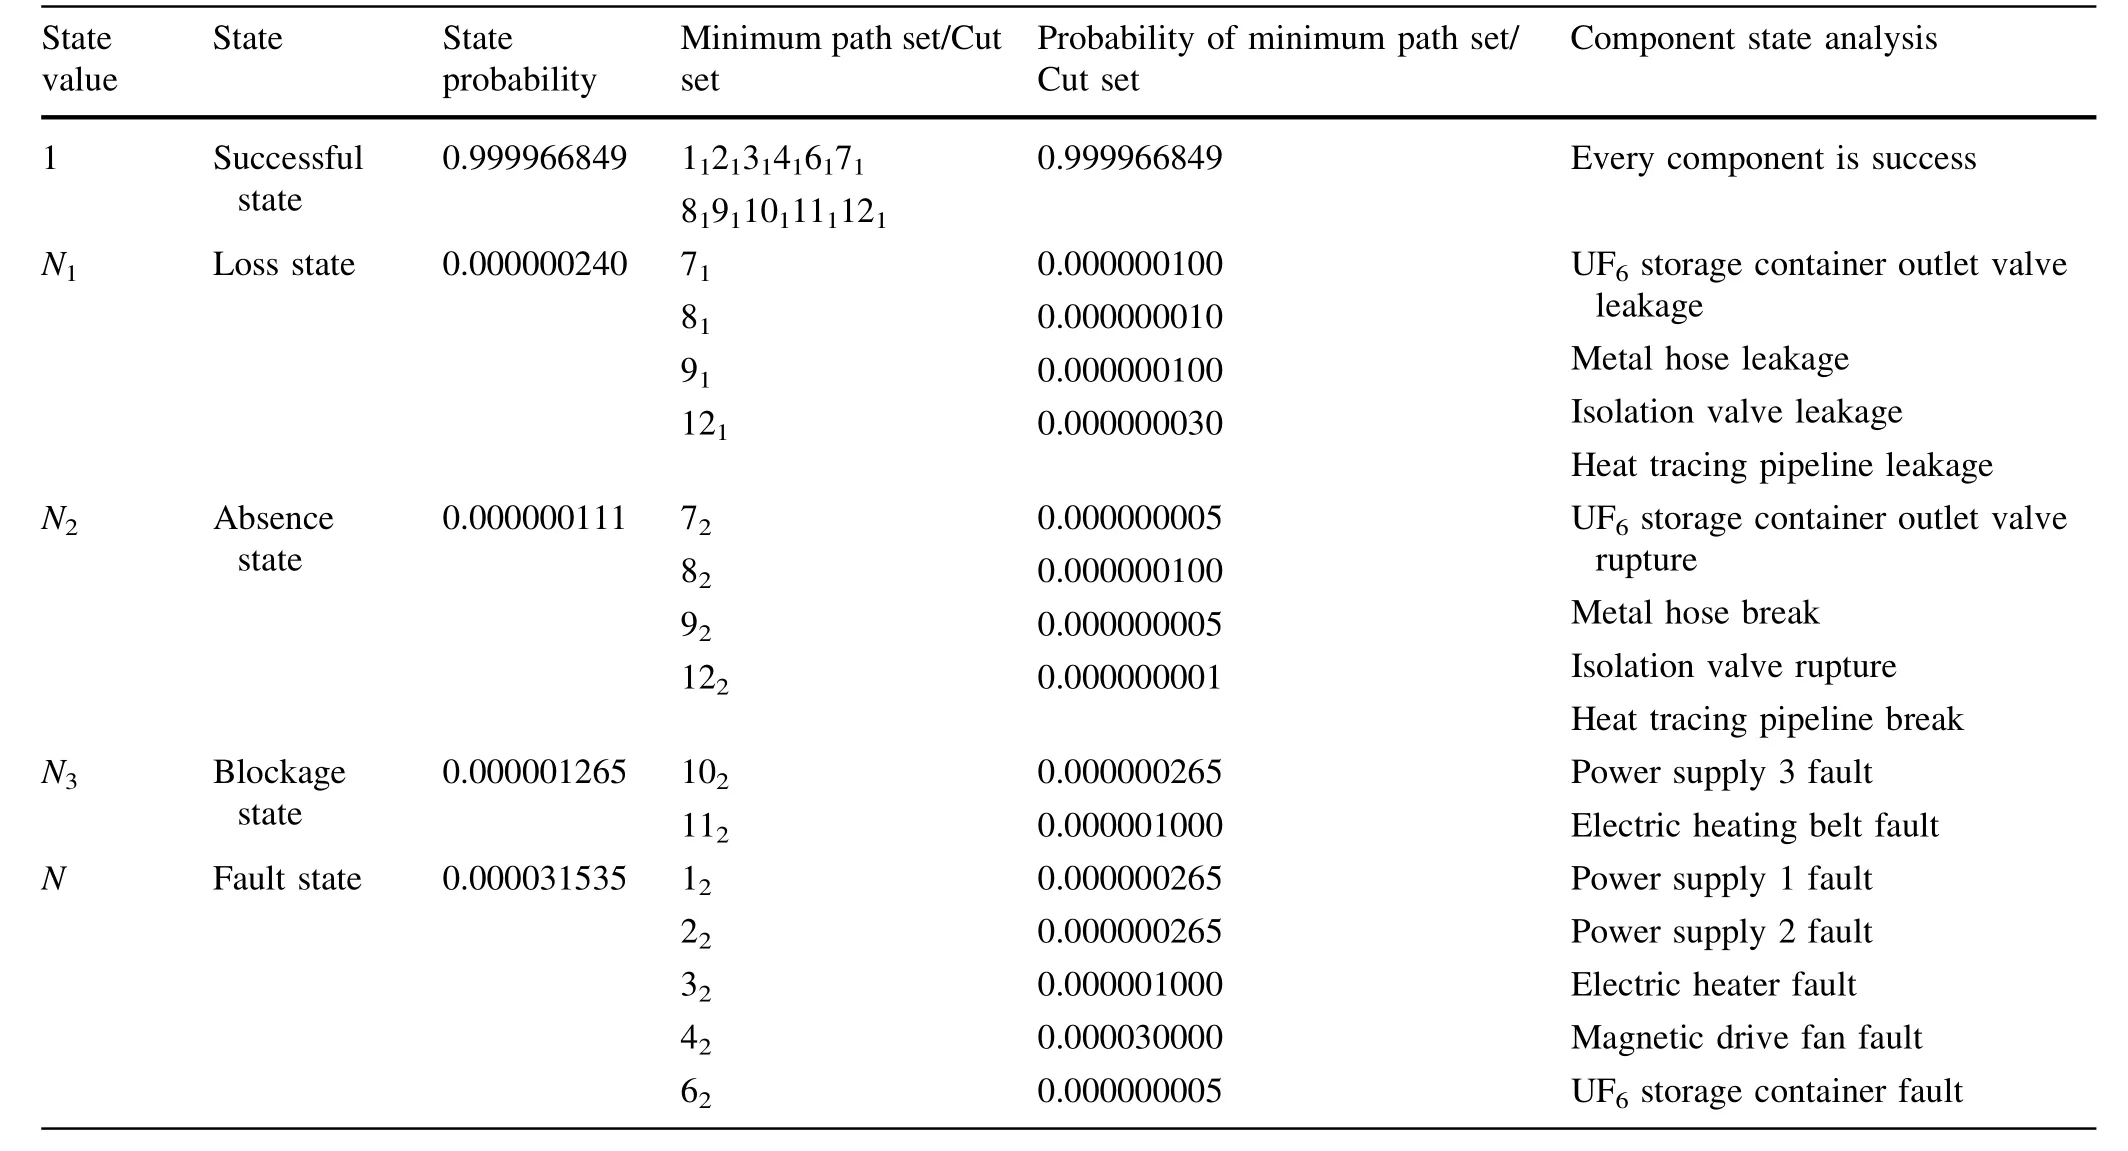
Table 4 Reliability analysis results for the UF6 gasification process system
5.4 Validation of results
There are four types of fault state in the gasification process:a small amount of UF6leakage(loss state),a large amount of UF6leakage (absence state), pipeline blockage(blockage state),and no UF6output from the UF6container(fault state).Respective fault tree analyses were performed,as illustrated in Figs. 4, 5, 6, and 7. According to the fault tree analysis results,the minimum cut sets of the loss state are first-order cut set that contain UF6storage container outlet valve leakage, metal hose leakage, isolation valve leakage, and heat tracing pipeline leakage. The minimum cut sets of the absence state are first-order cut set that contains UF6storage container outlet valve rupture, metal hose breakage, isolation valve rupture, and heat tracing pipeline breakage. The minimum cut sets of the blockage state are first-order cut set that contain power supply 3 fault and electric heating belt fault. Finally, the minimum cut sets of the fault state are first-order cut set that contains power supply 1 fault, power supply 2 fault, electric heater fault, magnetic drive fan fault, and UF6storage container fault.
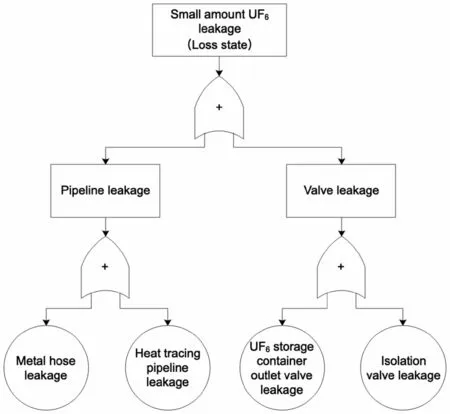
Fig. 4 FTA of a small amount of UF6 leakage (loss state)
Taking the fault state as an example, the probability calculation result gives 1 - (1 - 0.000000265) × (1 -0.000000265) × (1 - 0.000001) × (1 - 0.00003) ×(1 - 0.000000005) = 0.000031535.

Fig. 5 FTA of a large amount of UF6 leakage (absence state)

Fig. 6 FTA of pipeline blockage (blockage state)
In summary,the analysis results of the GO methodology are consistent with those of FTA.
6 Conclusion
Based on the existing GO methodology and its standard operators, this study analyzed the characteristics of gasification process accidents in nuclear fuel manufacturing facilities, established multi-state operators, and completed a reliability analysis of the gasification process system, as well as determining the accident probabilities of UF6leakages, addressing the deficiencies and expanding the application range of the GO methodology.

Fig. 7 FTA of no UF6 output from the UF6 container (fault state)
1. By establishing a multi-fault state operator, the problem that the existing GO methodology standard operator can only analyze single faults of the system is resolved, and the flexibility and adaptability of the GO methodology were verified. This provides a reference for the reliability analysis of a specific system and the establishment of corresponding operators according to the system unit characteristics.Furthermore, this lays a foundation for the reliability analysis of multi-fault systems using the GO methodology.
2. The GO methodology was utilized to qualitatively and quantitatively analyze the system reliability of the gasification process. This approach can be utilized to perform analyses of various states of the system,analyze the contribution of each component to the state, determine the key faults and components, and evaluate their impact on system reliability, providing decision support for enhancing the system reliability.
Acknowledgements We greatfully acknowledge the valuable cooperation to Environmental Impact Assessment Technology Laboratory of China Institute for Radiation Protection in system analysis.
杂志排行

Nuclear Science and Techniques的其它文章
- Study of Sallen-Key digital filters in nuclear pulse signal processing
- Advanced topics on RF amplitude and phase detection for lowlevel RF systems
- Feasibility analysis of 60Co production in pressurized water reactors
- Recovery of saturated signal waveform acquired from high-energy particles with artificial neural networks
- Assessment of self- and cross-absorbed SAF values for HDRKman using GEANT4 code: internal photon and electron emitters
- Development of alpha surface contamination monitor based on THGEM for contamination distribution