A wall-thickness compensation strategy for wax pattern of hollow turbine blade
2019-09-28KangCUIWenhuWANGRuisongJIANGDezhongZHAO
Kang CUI, Wenhu WANG, Ruisong JIANG, Dezhong ZHAO
Key Laboratory of Contemporary Design and Integrated Manufacturing Technology, Ministry of Education,Northwestern Polytechnical University, Xi’an 710072, China
KEYWORDS
Abstract As an important index affecting the aerodynamic performance and the structural strength of hollow turbine blades,the wall-thickness precision of the blade is mainly inherited from the positional relationship between the corresponding wax pattern and the internal ceramic core.However, due to locating errors, the actual position of ceramic core is always deviated from the ideal position,which makes it difficult to guarantee the wall-thickness precision of the wax pattern.To solve this problem, a wall-thickness compensation strategy is proposed in this paper. Firstly,based on the industrial computed tomography (ICT) technique and curve matching algorithms, a model reconstruction method is developed, with which the 3D model of a trial wax pattern can be easily constructed. After that, focusing on eliminating the wall-thickness errors of the trial wax pattern, an optimization method for the pose of the ceramic core in the wax pattern is proposed.Then,by mapping the optimal pose of the ceramic core to length adjustments of the locating rods,the wall-thickness errors of the wax pattern can be greatly reduced.A case study is also given to illustrate the effectiveness of the proposed compensation strategy.
1. Introduction
In a gas engine, turbine blades are a group of individual components responsible for extracting energy from the hightemperature high-pressure gas produced by the combustor.To better adapt to this strenuous environment, the modern turbine blades always employ an internal hollow structure,which indeed improves their cooling efficiency and survival ability,but also brings a lot of difficulties to their manufacturing. At present, hollow turbine blades are precisely manufactured by investment casting, which is a widely used method for making parts that transitional methods such as forging and machining cannot produce.1The major steps includes:ceramic core fabricating, injection molding of a wax pattern,ceramic shell building, dewaxing, drying, metal casting and decladding.2By analyzing the error propagation throughout the investment casting process,researchers found that the geometric accuracy of the final casting is mainly inherited from the corresponding wax pattern.3From the above analysis, it can be found that to obtain a hollow turbine blade with high geometric precision, the shape precision of the corresponding wax pattern must be guaranteed.
Generally, the shape precision of the wax pattern is evaluated from two aspects: surface profile and wall thickness. Past studies have shown that by optimizing the performance of the wax material,4,5injection parameters2,6and the geometry of the die cavity,7-9the contour accuracy of the wax pattern can be improved. As for the wall thickness of the wax pattern, it entirely depends on the pose of the ceramic core in the die cavity.10,11However,due to locating errors,the actual position of ceramic core is always deviated from the ideal position,which makes it difficult to guarantee the wall-thickness precision of the wax pattern. To solve this problem, a wallthickness compensation strategy is proposed in this paper. By mapping the wall-thickness errors of a trial wax pattern to length adjustments of the locating rods of the ceramic core,the wall-thickness errors caused by the error sources can be minimized.
Wall thickness belongs to the inner structural features. At present, the methods used for internal inspection can be divided into destructive methods and non-destructive methods.Among them, industrial computed tomography (ICT) scanning is the only technology that can measure as well the inner as the outer geometry of a component without need to cut it through and destroy it.12Actually, this technique has been used in the quality control process of hollow turbine blades.13In this research, the trial wax pattern is also inspected by an ICT scanner. Then, by fitting the contour points extracted from 2D ICT scan images into sectional curves,the 3D models of the wax pattern and the internal ceramic core can be easily reconstructed. However, limited by the detection depth of the ICT canner and hollow structures of the ceramic core,14the contour data of the wax pattern and the ceramic core are not available in some areas, which results in the traditional methods used for the curve reconstruction becoming invalid.8,15-20In fact, for those incomplete measurement data,using the model registration method to construct the sectional curves seems to be a good choice. By registering the nominal sectional curves with the incomplete contour points, the sectional curves of the trial wax pattern can be generated.At present, the model registration methods include rigid registration methods and non-rigid registration methods. As the rigid registration does not change the shape of the reference model,21the transformed curve cannot represent the shape of the measurement points. Some scholars established non-rigid registration methods based on the free-from deformation (FFD)theory.22,23By iteratively changing the shape of the sectional curve of nominal CAD model, the deformed curve can have a better geometric consistency with the measurement points.However, these methods are still not suitable for our issue because the serious lack of measurement data will cause the deformation of the nominal sectional curve to be out of control. So, in this paper, a curve reconstruction method was developed, with which sectional curves and the 3D models of the wax pattern can be constructed precisely.
By comparing the 3D model of the trial wax pattern with the nominal CAD model, the wall-thickness errors at some critical points can be obtained, which provides the possibility for subsequent locating compensation of the ceramic core. In the past,a lot of efforts have been made on workpiece locating error prediction and compensation. Cai et al.24, Asada and By,25Kang et al.26and Qin et al.27utilized the linear equation to formulate the relationship between locating errors and the resultant displacement of the workpiece, and then pointed out that a workpiece can be deterministically located only when the rank of the related Jacobian matrix is equal to six.Based on the same theory, Wang28developed an optimization method for the layout of locators, which aims to reduce the influence of locating errors on the locating precision of the workpiece. Moreover, Carlson29and Cao et al.30derived quadratic equations to relate position errors in locators with the resulting displacement of the workpiece held by the locating scheme. By the use of the Newton-Raphson method, a solving strategy for the displacement of a workpiece caused by locating errors was given. Qin et al.31classified the sources of machining errors into position errors, elastic deformations and inconsistent datum errors,and then analyzed the influencing mechanism of each type on machining errors. In addition,Wan et al.32built a systematic evaluation model with respect to the above three types of source errors, and finally mapped all kinds of source errors into locating errors on the fixture. Zhu et al.33proposed a prediction model of a workpiece locating error caused by the setup error and geometric inaccuracy of locaters for the fixtures with one locating surface and two locating pins. Although many models have been proposed in above studies to approximate the relationship between source errors and the resultant workpiece displacement, the method of eliminating the displacement of workpiece by adjusting the length of locaters still did not receive much attention.
In this paper,a compensation strategy focusing on reducing wall-thickness errors of the wax pattern by adjusting the length of the locating rods of the ceramic core is developed. To start with, a trial wax pattern is inspected by an ICT scanner. By registering the sectional curves of the nominal CAD model to the contour points extracted from 2D grayscale images at different heights, the 3D models of the wax pattern and the internal ceramic core can be constructed. After that, the wall-thickness errors of this wax pattern at some critical positions will be calculated, and the optimal pose of ceramic core in the wax pattern with a purpose of minimizing the wallthickness errors will be found. Then, by mapping the optimal pose of the ceramic core to the length adjustments of the locating rods of the ceramic core, the wall-thickness errors of the wax pattern can be reduced.
Associated with the procedures mentioned above, the remainder of the paper is organized as follows. In Section 2,a model reconstruction method is developed, with which the parametric surfaces of the trial wax pattern and the internal ceramic core can be constructed. Next, a pose optimization method for the ceramic core focusing on minimizing the wall-thickness errors of the wax pattern is proposed in Section 3. Section 4 introduces a numerical method to calculate length adjustments of the locating rods, and the verification process and conclusions are given in Sections 5 and 6,respectively.
2. Model reconstruction of trial wax pattern
Definition. For a hollow turbine blade, the wall thickness of the corresponding wax pattern is defined as Euclidean distance between the two tangency points of a sphere that is inscribed with the wax pattern surface and the ceramic core surface at the same time, as shown in Fig. 1.

Fig. 1 Wall-thickness definition of wax pattern of a hollow turbine blade.
This definition indicates that to evaluate the wall-thickness of an actual wax pattern, the 3D models of the wax pattern and the internal ceramic core must be established. Generally,the 3D model of a turbine blade can be simplified as a‘‘stack”of cross-sectional curves.34With this thinking, the parametric surfaces of the trial wax pattern in this study are also created through a series of cross-sectional curves. In fact, when a wax pattern is inspected by an ICT scanner, the external and internal contour points of the wax pattern can be easily extracted from the 2D scan images. As long as these contour points can be fitted into sectional curves, the parametric surfaces of the wax pattern and its internal ceramic core can be constructed, as shown in Fig. 2.
However,limited by the dictation depth of the ICT scanner and hollow structures of the ceramic core, the contour points in some areas cannot be collected, which results in the traditional curve fitting methods becoming invalid. So, the main task of this section is to develop a curve reconstruction method, so that the parametric surfaces of the wax pattern and the internal ceramic core can be constructed.
As shown in Fig.2,the contour points extracted from a 2D scan image can be divided into external points and internal points, which represent the shapes of the wax pattern and the ceramic core respectively, and correspond to two sectional curves on the nominal CAD model. Taking the nominal sectional curve of the ceramic core as an example,if this curve can move close enough to the internal contour points without losing its original shape seriously,it can be regarded as the sectional curve of the ceramic core. With this consideration, a curve reconstruction method is developed, which involves two steps: a rigid transformation and a deformation adjustment.
2.1. Rigid transformation
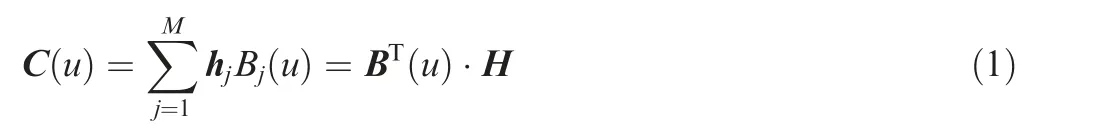
Firstly,suppose that the nominal sectional curve C(u)has a Bspline expression:

where Qiis the internal contour point;Piis the closest point of Qion the nominal sectional curve C(u); N is the number of contour points; R and T represent a spatial rotation matrix and a spatial translation vector, respectively.
In this study, Eq. (2) is solved by the SVD algorithm.36With the end of solving process, an optimal spatial rotation matrix Rbestand an optimal translation vector Tbestcan be obtained. By utilizing them, the nominal sectional curve C(u)can move closer to measurement points without losing its original shape, as shown in Fig. 3. Finally, by iteratively revising the above transformation until the solution converges to a given extent,the distances between the rigidly transformed sectional curve Cr(u)and measurement points can be minimized.
2.2. Deformation adjustment
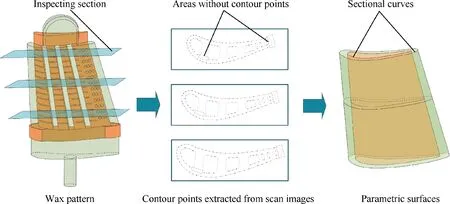
Fig. 2 Modeling process for an actual wax pattern.

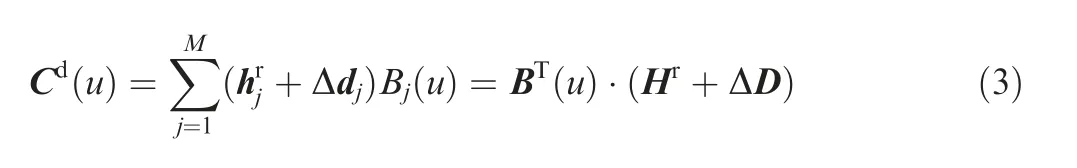

Fig. 3 Rigid transformation of nominal sectional curve of ceramic core.

Fig. 4 Deformation adjustment of rigidly transformed sectional curve of ceramic core.

Fig. 5 Optimization process for pose of ceramic core.


where Qiis the measurement point; uiis the parameter value corresponding to the closest point of Qion the curve Cr(u).
Besides, in order to prevent the curve Cr(u) deforming largely during the deformation adjustment, some constrains should be introduced into Eq. (4). Generally, the shape of a parameterized curve p(u) is reflected in its bending energy,37which is defined as
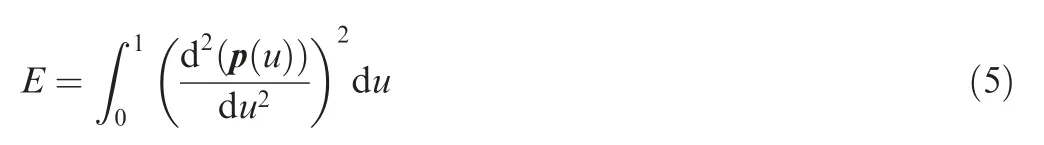
Based on this function, the bending energies of the rigidly transformed curve Cr(u) and the deformed curve Cd(u) can be expressed as
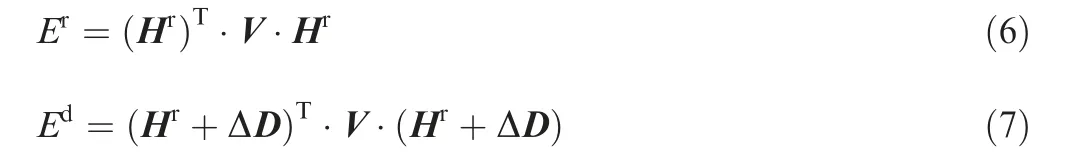
where V is a symmetric matrix, and its element Vijis

Taking the bending energy variation ΔE between the rigidly transformed curve Cr(u) and the deformed curve Cd(u) as a penalized term, and then limiting the moving ranges of the control points, the shape variation of the curve Cr(u) can be restricted, and thus the deformation adjustment will be converted to an optimization problem with constraints:
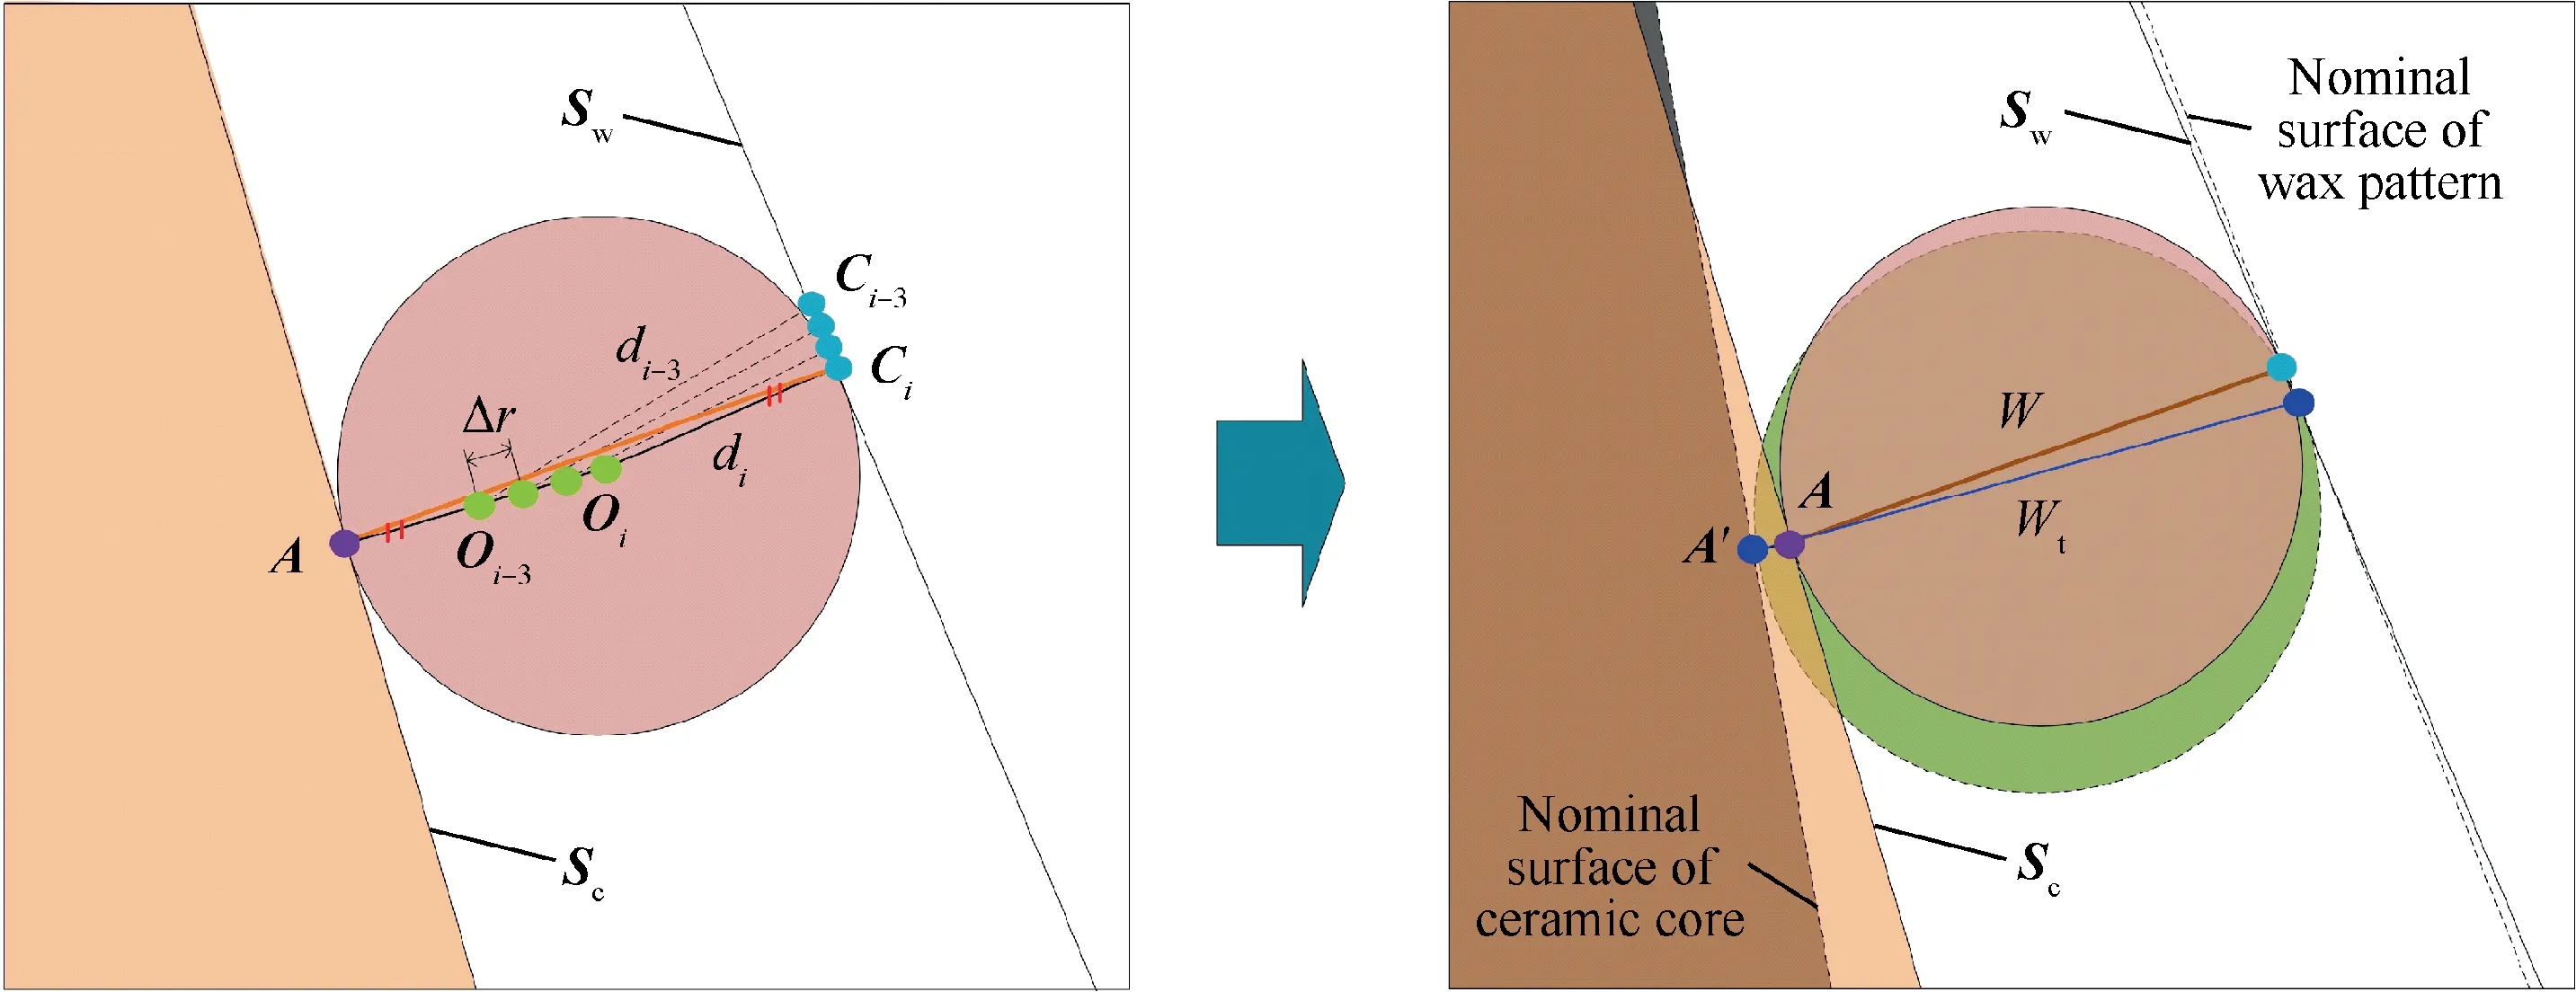
Fig. 6 Calculation process for wall-thickness error.

Fig. 7 Error transfer model of a rigid body.
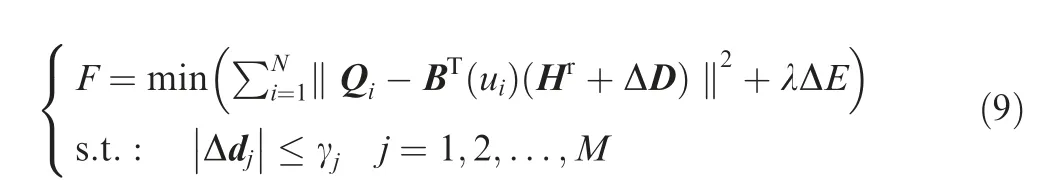
where λ is the deformation restraint coefficient;γjis the search radius of the control point j; ΔE can be simplified as

In this study, the objective function (9) is solved by the genetic algorithm. With the end of the minimization, the best displacement for each single control point will be calculated.By substituting these displacements into Eq. (3), a deformed curve Cd(u)with a high matching accuracy and minor geometric deformation can be generated.
Finally, the parametric surfaces of the wax pattern and the ceramic core can be expressed as the interpolation of the deformed sectional curves with different heights, as shown in Fig. 2.
3. Pose optimization of ceramic core
The wall-thickness precision of a wax pattern largely depends on the pose of the internal ceramic core.Thus, if an appropriate pose adjustment can be given to the ceramic core,the wallthickness errors of the wax pattern caused by error sources must be reduced, as shown in Fig. 5. With this thinking, an optimization method for the pose of the ceramic core in the wax pattern is developed in this section.
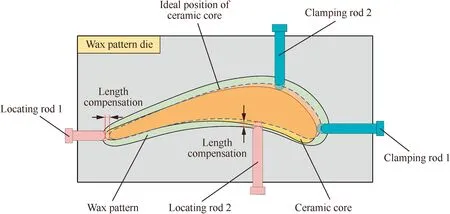
Fig. 8 Locating compensation strategy of ceramic core.

Fig.9 Calculation process for length adjustment of locating rod.

Fig. 10 Adjustment mechanism of locating rod.
3.1. Wall-thickness error calculation
As mentioned above,the wall thickness of the wax pattern of a hollow turbine blade is defined through an inscribed sphere.In order to find such a sphere, a numerical method is proposed here. As shown in Fig. 6, supposing that Sw(u,v) and Sc(u,v)are the parametric surfaces of the trial wax pattern and its internal ceramic core, which are construed by interpolating the sectional curves generated with the method presented in Section 2, and A is a point on the surface of the ceramic core,the searching algorithm for the sphere center is depicted as follows:
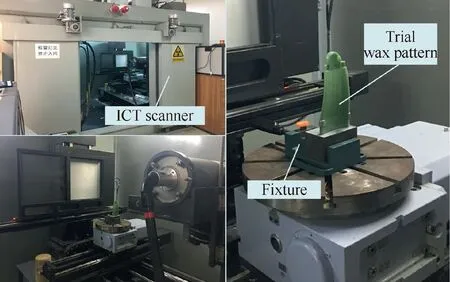
Fig. 11 ICT scanning process of trial wax pattern.
Step 1: Differentiate the surface function Sc(u,v) at the point A, and obtain its outward unit normal vector:

Step 2: Set a searching increment Δr for the sphere radius,and then initialize the position of the sphere center Oias
Step 3: Project the sphere center Oion the surface of the wax pattern,and calculate the distance between the sphere center Oiand the projecting point Ci:

Step 4: Iterations

Besides, considering that the measurement coordinate system is different from the design coordinate system, the measurement points of the trial wax pattern will be registered to the nominal CAD model based on the ICP algorithm. Thus, the reconstruct surfaces and the nominal CAD model can be aligned in the same reference frame. Supposing that the measurement coordinate system has been aligned to the design coordinate system, the projection point A′ on the nominal CAD model of the ceramic core can be regarded as the corresponding point of the point A.Thus,based on the above algorithm, the theoretical wall-thickness value Wtat the point A can be calculated, and the signed wall-thickness error Δe at the point A can be written as

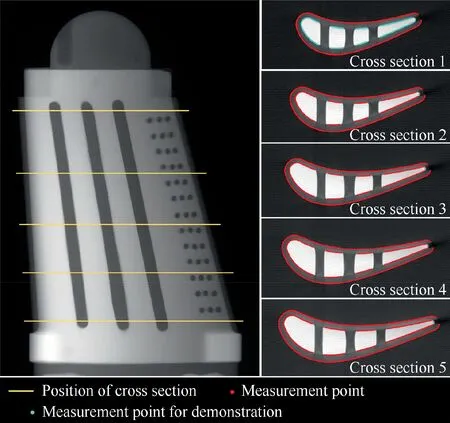
Fig.12 Scanning images and contour points of trial wax pattern.

Fig. 13 Sectional curve generated with proposed method.
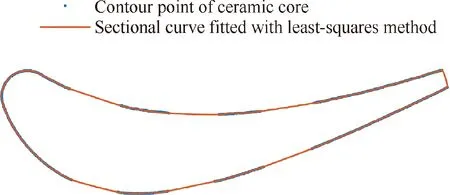
Fig. 14 Sectional curve fitted with least-squares method.
3.2. Pose optimization
Let’s introduce a positional perturbation to the ceramic core.Since any motion of a rigid body can be depicted by a translation and a rotation, this positional perturbation is defined as

Fig.15 Sectional curve generated with 2D non-rigid registration method.

Fig. 16 Parametric surfaces of trial wax pattern and internal ceramic core.

where Δb=[Δbx,Δby,Δbz]Tis a translation vector;Δθ=[Δθx,Δθy,Δθz]Tis a rotation vector.
Without loss of generality, such a positional perturbation must result in a displacement Δpiof the point i on the surface of the ceramic core. According to geometric relationship shown in Fig. 7, as long as the positional perturbation Δq is small enough, the displacement Δpican be approximated as

where piis the coordinate vector of the point i.Thus,the component of the displacement Δpialong the wall-thickness direction can be written as

Eq. (17) represents the algebraic relationship between the pose adjustment of the ceramic core and the resultant wallthickness component at a specific point. When k wallthickness evaluation points are chosen from the surface of the ceramic core, these individual error compensation equations can be collected into a single formula as
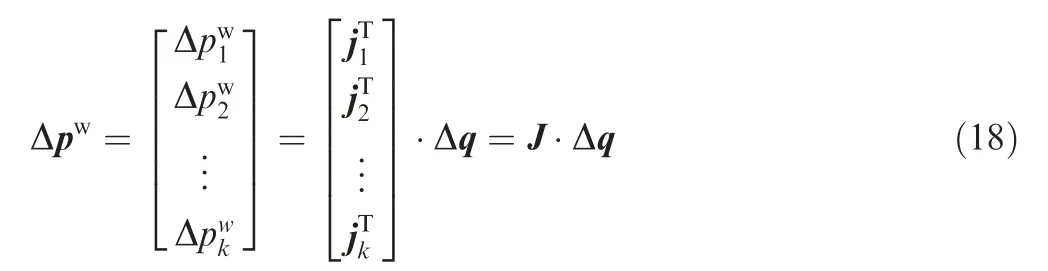
where J is the Jacobian matrix. Thus, focusing on eliminating the wall-thickness errors at these points, the pose optimization of the ceramic core can be described as: find a Δq*, such that
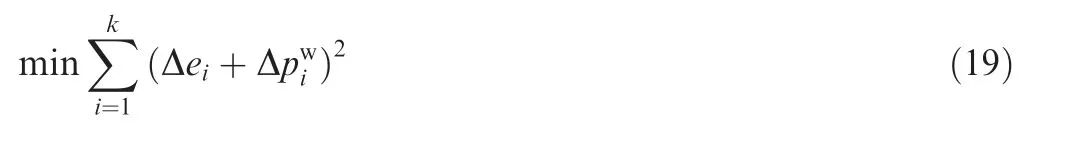
where Δeidenotes the wall-thickness error of the point i,which can be calculated with the method presented in Section 3.1.Obviously, Eq. (19) satisfies the least-square requirement.According to the least-square algorithm, the solution can be written as

where ΔE= [Δe1,Δe2,...,Δek]T; J+=(JT·J)-1·JTis the pseudo inverse matrix of J. Hence, the calculating process for the pose adjustment vector of the ceramic core in the wax pattern can be summarized as follows:
(1) Sample a series of crucial points from the surface of the ceramic core,and acquire their wall-thickness errors and corresponding inward unit vectors along their wallthickness directions with the method presented in Section 3.1;
(2) Calculate the pose adjustment vector Δq*of the ceramic core with Eq. (20).
4. Locating compensation of ceramic core

Fig.17 Measuring process of trial wax pattern and ceramic core by a CMM.
As mentioned above,the wax pattern of a hollow turbine blade is formed through a wax injection process, which involves using a series of locating and clamping rods to localize and immobilize a ceramic core within a metal die, and then injecting a wax-based material into the die cavity.Although the pose optimization can significantly reduce the wall-thickness errors of the wax pattern, its implementation still relay on length adjustments of the locating rods, as shown in Fig. 8. So, the task of this section is to establish a locating compensation method that can map the pose adjustment vector Δq*of the ceramic core to length adjustment magnitudes of the locating rods.

Fig. 18 Modeling errors of trial wax pattern.
In general, the top of a locating rod is a spherical surface, as shown in Fig. 9. Supposing that the initial position of the sphere center is G0and the unit vector in length direction of the locating rod is τ, the length adjustment magnitude of the locating rod can be calculated with following procedures:
Step 1: Transform the nominal CAD model of the ceramic core with the pose adjustment vector Δq*.
Step 2: Calculate the distance s0between the sphere center and the transformed surface of the ceramic core, and then determine the searching direction. If s0-r ≥0, where r is the radius of the spherical surface of the locating rod, set the searching direction: ρ=τ; otherwise, set the searching direction: ρ=-τ.

Fig. 19 Distribution of wall-thickness evaluation points.

Fig. 20 Wall-thickness errors of trial wax pattern.
Step 3:Set a searching increment Δl and execute the following iteration process:
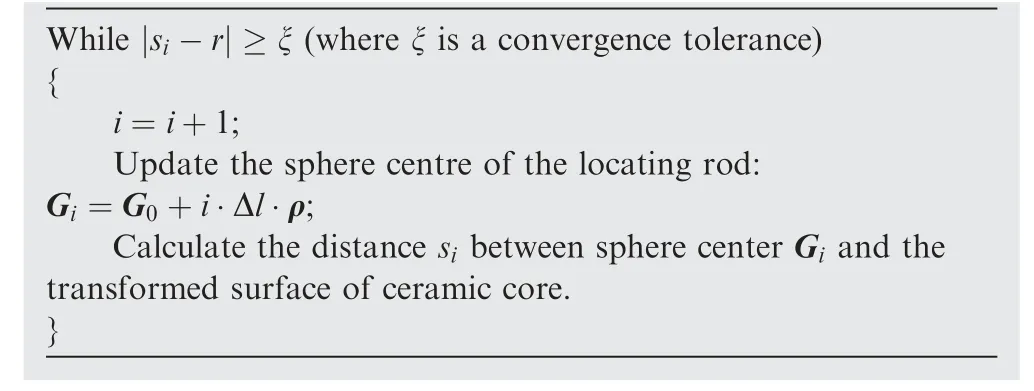
The length adjustment magnitude of the locating rod can be finally expressed as ΔD=i·Δl.
In this study, the locating rod is connected to the wax pattern die through a screw head, which ensures that the locating rod can move along the length direction. Thus, selecting a datum plane on the metal die, the length adjustment of the locating rod can be determined with a height gauge, as shown in Fig. 10.
5. Case study and discussion
5.1. Modeling precision evaluation
In this study, a wax pattern with a height of 138.7 mm and a width of 72.9 mm was used as an example to verify the effectiveness of the model reconstruction method presented in Section 2.As shown in Fig.11,the wax pattern was inspected by a cone-beam computed tomography system, where the X-ray source is Y.TU 450-D02 from Yxlon and the flat panel detector is PaxScan 2520 from Varian.After optimization,the measurement accuracy of this system can reach ±0.01 mm.
Firstly, by utilizing this ICT scanner, five cross-sectional images of the trial wax pattern were obtained. Fig. 12 shows the contour points extracted from these scan images, where it can be found that limited by the detection depth of the ICT canner and hollow structures of the ceramic core,the contour data in some areas cannot be collected. Afterward, ten sectional curves were extracted from the corresponding cross sections of the nominal CAD models. Considering that these nominal sectional curves underwent the same transformation process in this study,the following just uses the contour points highlighted in Fig. 12 as an example to demonstrate effectiveness of the rigid transformation and the subsequent deformation adjustment.
Fig. 13(a) shows the initial geometric relationship between the highlighted contour points and the corresponding nominal sectional curve.After a rigid transformation and a subsequent deformation adjustment, the sectional curve has been close enough to the contour points, as shown in Fig. 13(b). Moreover, the distances between the contour points and the sectional curve were also calculated. After the curve transformations, the maximum distance was reduced from the initial 0.7475 mm to 0.0095 mm. In fact, such a distance has already met the matching precision requirement.

Fig. 21 Wall-thickness errors of wax pattern after pose optimization of ceramic core.

Table 1 Pose adjustment vector of ceramic core.

Fig. 22 Layout of locating rods.
For comparison, two other sectional curves were given in this study. Fig. 14 shows the sectional curve fitted with leastsquares method,where it can be found that due to lack of measurement points at leading edge and blade body,the curve can no longer represent the shape of the ceramic core. Besides,using the contour points and the nominal sectional curve shown in Fig. 13(a), another sectional curve was generated based on the 2D non-rigid registration method.23However,because deformation control is not a major concern in this method, the curve also shrinks at the leading edge, as shown in Fig. 15. From the above comparison test, it can be found that the proposed method has a better deformation restraint capacity, which can prevent a large deformation during the curve transformation. Finally, by interpolating the transformed sectional curves with different heights, the parametric surfaces of the wax pattern and the internal ceramic core were reconstructed, as shown in Fig. 16.
In order to evaluate modeling precision of the reconstructed surfaces shown in Fig.16,the trial wax pattern and the internal ceramic core were also inspected by a coordinate measurement machine (CMM), as shown in Fig. 17. On each cross section shown in Fig.12,100 measurement points were collected from the surfaces of the wax pattern and the ceramic core, respectively. Then, by registering these measurement points onto the reconstructed surfaces with the ICP algorithm, the distances between them were calculated.Actually,these distances can be regarded as modeling errors. As shown in Fig. 18, the maximum modeling errors of the trial wax pattern and the ceramic core are 0.010 mm and 0.011 respectively, which do not exceed the modeling tolerance: -0.015 to +0.015 mm.The results demonstrate that the parametric surfaces generated with the proposed method can accurately represent the internal and external contours of the wax pattern, and can be used for the wall-thickness error evaluation.
5.2. Verification for wall-thickness compensation strategy
In this study, 100 points were selected from the reconstructed surface of the ceramic core to perform the wall-thickness compensation strategy, as shown in Fig. 19. Firstly, based on the numerical method proposed in Section 3.1, the wall-thickness errors of the trial wax pattern at these points were calculated,where the maximum value is+0.453 mm as shown in Fig.20.Afterward,focusing on eliminating these wall-thickness errors,the pose adjustment vector of the ceramic core was obtained,as shown in Table 1. Then, by transforming the reconstructed surface of the ceramic core with the pose adjustment vector,the wall-thickness errors at these points were recalculated.Fig. 21 shows the final results where it can be found that the maximum value is -0.037 mm, and compared with the trial wax pattern without pose optimization, it is reduced by 91.8%.This result proves the validity of the pose optimization method presented in Section 3.2.

Table 2 Length adjustments of locating rods of ceramic core.
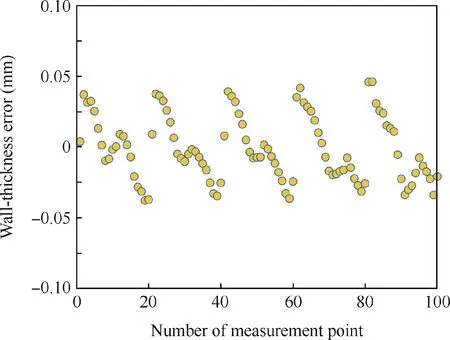
Fig. 23 Wall-thickness errors of wax pattern with locating compensation.
As shown in Fig. 22, the ceramic core was located by six locating rods in the wax pattern die.By using the method proposed in Section 4, the length adjustment magnitudes of the locating rods were calculated, as shown in Table 2. After adjusting the length of the locating rods,the ceramic core with outer wax removed was relocated into the wax pattern die.Thus, a new wax pattern can be formed. Inspecting it with the ICT canner, the wall-thickness errors at the points shown in Fig. 19 were recalculated, where the maximum value is+0.046 mm and bigger than the estimated error -0.037 mm,as shown in Fig. 23. This is because the adjustment error cannot be completely eliminated through a screw head. But, if compared with the wax pattern without locating compensation, this value has also been reduced by 89.9%. In fact, such a wall-thickness error has already met the tolerance requirement:-0.05 to+0.05 mm.This result indicates that the locating compensation method is effective, which can guide the adjustments of locating rods in practice.
Consequently,from the above analysis,it can be found that by the use of the wall-thickness compensation strategy proposed in this paper, the wall-thickness errors of the wax pattern can be greatly reduced.
6. Conclusions
(1) Based on the ICT technique and the curve matching algorithms,a model reconstruction method is developed in this paper, with which the parametric surfaces of an actual wax pattern and its internal ceramic can be generated. A modeling precision verification is also given,where it can be found that the model errors of the reconstructed parametric surfaces did not exceed the precision tolerance: -0.015 to +0.015 mm. This result indicates that the parametric surfaces generated with the above method are precise enough to be used for the wallthickness error evaluation of the wax pattern.
(2) In order to eliminate the wall-thickness errors of the wax pattern caused by the error sources, a wall-thickness error evaluation method and a pose optimization method are developed. By using them, the optimal pose of the ceramic core in the wax pattern can be determined.
(3) Considering that the pose optimization of the ceramic core eventually falls into the length adjustment of the locating rods, a locating compensation method is also developed in this paper,which can map the pose adjustment vector of the ceramic core to length adjustment magnitudes of locating rods. From the verification result, it can be found that by adjusting the length of the locating rods, the maximum wall-thickness error of the wax pattern was reduced by 89.8%, which further demonstrates the effectiveness of the proposed compensation strategy.
(4) In this study, the length of the locating rod is adjusted through a screw head.Since manual adjustment is easily affected by human factors, it is difficult to use this way to achieve the desired accuracy.In the future,to further improve the localization accuracy of ceramic core, an automatic adjustment mechanism will be developed for the locating rods.
Acknowledgements
This study was co-supported by the National Natural Science Foundation of China (Nos. 51475374 and 51505387) and the Fundamental Research Funds for the Central Universities(No. 3102015ZY087).
杂志排行

CHINESE JOURNAL OF AERONAUTICS的其它文章
- Special Column of BWB Civil Aircraft Technology
- Assessment on critical technologies for conceptual design of blended-wing-body civil aircraft
- Exploration and implementation of commonality valuation method in commercial aircraft family design
- Effects of stability margin and thrust specific fuel consumption constrains on multi-disciplinary optimization for blended-wing-body design
- Nacelle-airframe integration design method for blended-wing-body transport with podded engines
- On developing data-driven turbulence model for DG solution of RANS