Breast Lump Recognition Algorithms Based on Ultrasound Radio-Frequency Signals
2019-09-25YANYuCAIXiaoweiZHUWeiCAIRunqiuWUYiyun
YAN Yu,CAI Xiaowei,ZHU Wei,CAI Runqiu,WU Yiyun*
1.School of Computer Science and Engineering,Nanjing University of Science and Technology,Nanjing 210094,P.R.China;
2.Affiliated Hospital of Nanjing University of Chinese Medicine,Nanjing 210029,P.R.China
Abstract: A method for evaluating the benign and malignant breast tumors based on radio-frequency(RF)data was explored by extracting the characteristic parameters of breast ultrasound RF signals. The breast biopsy data were used as the reference data for judging the lump benign or malignant. The extracted ultrasound RF data were reconstructed and segmented by computer aided method to obtain the breast tumor region of interest(ROI)and its characteristic parameters(entropy and standard deviation). The characteristic parameters were statistically analyzed to evaluate the relationship between characteristic parameters and benign or malignant breast tumors. The results indicate the entropy and standard deviation of normal region is much higher than that of lump region,which shows that the standard deviation and entropy characteristic parameters of ultrasonic RF signals are meaningful in the diagnosis of breast tumors. The proposed method provides a new direction for computer-aided diagnosis of benign and malignant breast tumors.
Key words: ultrasound radio-frequency signal;breast lump;signal processing;standard deviation;entropy
0 Introduction
Breast tumor is an extremely common tumor lesion that jeopardizes the health of women. So far,no studies have shown the exact cause of breast tumors. Early diagnosis and grading are crucial for breast tumors. Breast ultrasound and breast biopsy are the main means to evaluate the benign and malignant breast tumors. Although breast biopsy is the gold standard for tumor evaluation,positive predictive values(PPVs)are achieved lowly(38.0%[1])when using the BI-RADS classification criteria to identify benign and malignant,while the sensitivity is very high(98.4%[1]). This situation results in a large number of benign biopsy results (60%—80%[1]),and unnecessary biopsy increases the pain and expense of the patient. Therefore,it is necessary to improve the ultrasound diagnosis for enhancing specificity and reducing unnecessary biopsy.
Ultrasound imaging uses the ultrasonic beam to scan the human body. It distinguishes different tissues by receiving,processing and reflecting the difference in acoustic characteristics of the reflected signals. Images of various tissue components of the human body are obtained in this way. Ultrasound images also show the organ interface and the internal tissue. With the use of ultrasound images,doctors can identify the lesions from normal tissues,and conduct further diagnosis[2-3]. The diagnosis of breast tumor is based on B-mode ultrasonic images,which are transformed from original radio-frequency signals. To get a clearer image,the region of interest(ROI)area is enhanced and the background noise is suppressed during the transforming period, but some usable information is lost inevitably[4](as shown in Fig.1). On the other hand,breast ultrasound diagnosis mainly comes from the doctor's qualitative evaluation of breast tissue and muscle tissue structure around the breast. The diagnosis results are related to the doctor's experience,level,status and other factors. So it is likely to be influenced by subjective factors[5]. According to statistics,the accuracy of conventional two-dimensional ultrasound diagnosis is only from 69% to 75%[6]. In this case,an auxiliary diagnosis based on the complete original signal is urgently needed. In order to minimize the influence of doctors'subjectivity and imaging factors,we should find a more accurate and quantitative method for ultrasonic diagnosis. It is necessary to perform characteristic analysis from the source of the signal,that is,the ultrasound radio-frequency(RF)signal.
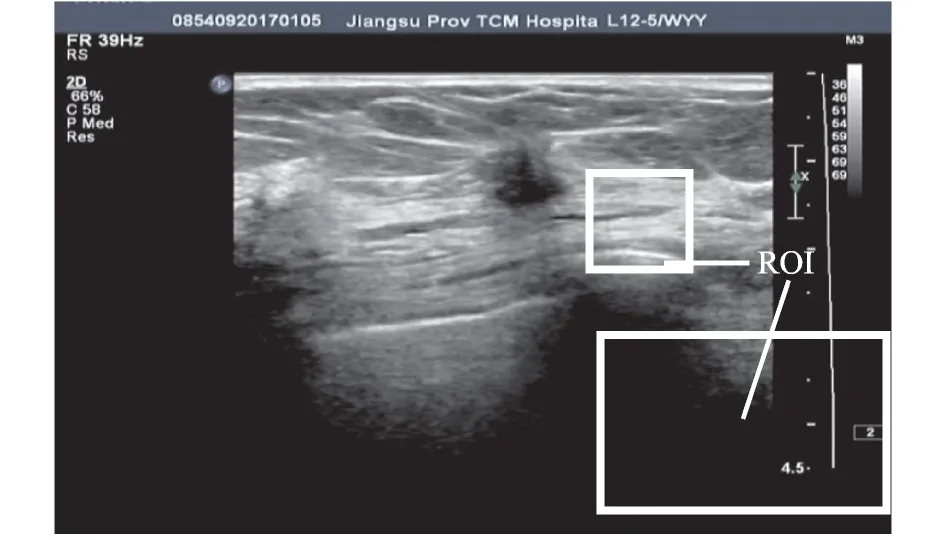
Fig.1 A typical ultrasonic image of breast tumor
RF signal is the original signal that reflects the tissue irradiated by ultrasound[7]. By extracting and processing RF signals,the differences between normal and diseased areas can be quickly and accurately summarized,making diagnosis easier. Masotti et al.[8]used RF ultrasound local characterization parameter analysis method to determine the prostate tissue in vitro. Moradi et al.[9]proposed a new method for the diagnosis of prostate cancer using ultrasound RF signals. Liu et al.[10]used time domain,frequency domain analysis method and pattern recognition technology to explore a new quantitative method for fatty liver grading. The recognition rate of fatty liver reached 86.7%. However,it is rarely involved in the identification of benign and malignant breast tumors from an RF perspective. Considering that the breast ultrasound diagnosis relies on the naked eye and it is strongly affected by subjective judgment,breast biopsy data are used as reference data for judging benign and malignant tumors in this paper. The characteristic parameters of breast ultrasound RF signal are extracted by computer aided method. We quantitatively evaluate the relationship between characteristic parameters and benign or malignant lesions,with analyzing and evaluating the algorithms based on the experimental results.
1 Methods
1.1 Feature algorithm extraction
Processing the ultrasound RF signals requires extraction of the RF signal in a readable manner.The extraction of the ultrasound RF signals is carried out with the use of the open background database of the ultrasonic diagnostic system VINNO 70.We wrote a RF data function program and ran the program with MATLAB. The derived hexadecimal data are converted and rearranged into a decimal numerical matrix. Each of the numerical points corresponds to the pixel of the same row and column coordinates in the ultrasound image,and the magnitude of the numerical point reflects the intrinsic gray value of the corresponding ultrasound image pixel without image enhancement,that is,the formed numerical matrix is a two-dimensional representation of the ultrasound image without processing[11]. Since there is no image enhancement,the ultrasound image indicated by the numerical matrix is rarely used in the current ultrasound clinical diagnosis,especially the physician's ultrasound image visual judgment. But for signal analysis and processing,the numerical matrix,containing the most comprehensive and undistorted ultrasound information,is suitable for algorithm compilation to get the clinical significance of the parameters. The subject of ultrasound feature extraction of breast tumors is the original RF data of normal breast tissue and breast tumor. In this study,the RF signal and image are combined to extract the characteristic parameters of the RF signal in the breast tumor ROI. The specific process is shown in Fig.2.
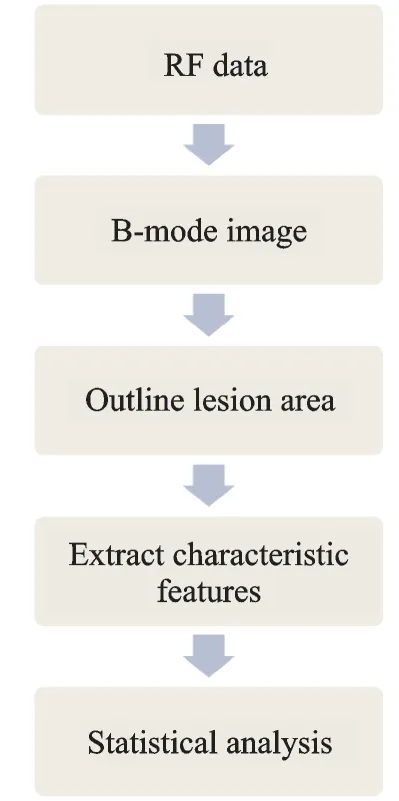
Fig.2 Schematic diagram of RF data processing
First,the ROI is selected. To ensure its accuracy,the artificial segmentation method used in this study is a relatively simple target object-based contour extraction method. The image segmentation tool used is the ImageCorp software,and it is written by the research group based on MATLAB R2016b,as shown in Fig.3.
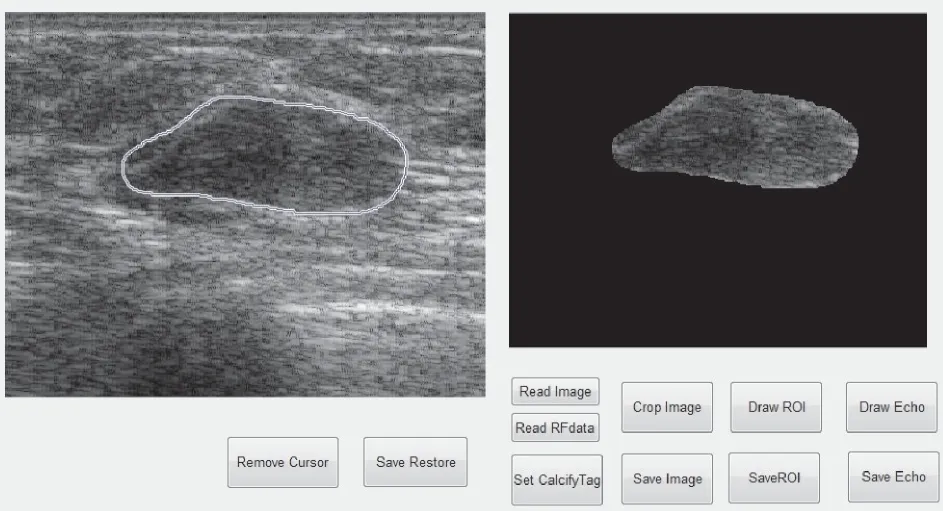
Fig.3 Interface of software“ImageCorp”
The ROI is saved into a 100*100 standard size for later feature extraction. The sampling error is,where n is the sampling number. In this case n is 100*100=10 000. The sampling error is 1%,making the statistical reliability 99%. Then we use MATLAB to extract the standard deviations and entropies of the lump area and normal area for statistical analysis.
1.2 Standard deviation and entropy
The standard deviation σ represents the degree of dispersion between the sample elements in the mathematical statistics,and is defined as the arithmetic mean square of the differences of the elements xiand the sample mean μ in the sample. The size of the standard deviation σ reflects the uniformity of the sample elements,shown as

The entropy of the statistical sample S is defined as the sum total of all possible states of the sample elements of the system,the entropy value Nnis the number of possible states in the nth state,and for signal analysis and processing the entropy reflects the number of elements with the same numerical value in the numerical matrix. The entropy values reflect the degrees of confusion in statistical samples,shown as

In the analysis of the standard deviation and entropy of the sample,the distal region and the region adjacent to the skin surface are removed. Due to the severe attenuation of the ultrasonic signal at the distal end of the far field,the signal noise accumulation,and the acoustic interference in the vicinity of the skin surface area and the actual incomplete coupling,the data of the far field area and the skin adjacent area will increase the uncertainty of the statistical fluctuation. In this paper,the far field region end and the adjacent region are defined as the values of 1 500 and 100,so the value of the region locates in the vertical coordinate range [100,1 500],as shown in Fig.4.
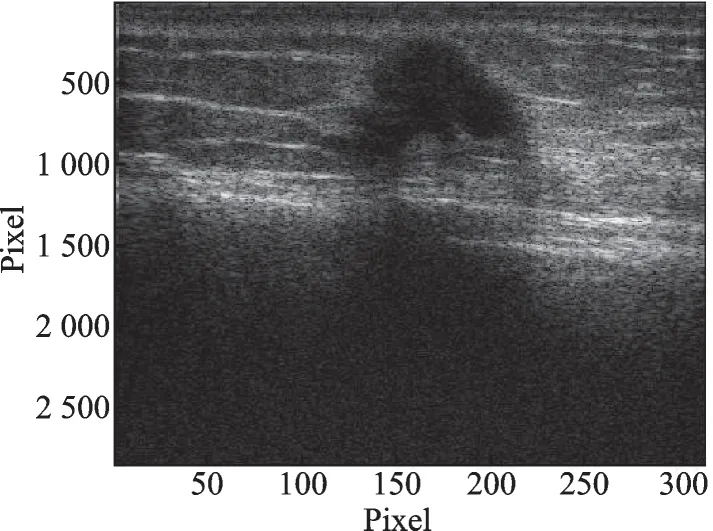
Fig.4 Image representation of the ultrasound RF data matrix
2 Results
In this study,the RF data of 100 patients with breast tumors are collected. All patients had biopsy diagnosis as gold standard,including 50 benign tumors and 50 malignant tumors,respectively. Fig.5 shows a typical malignant breast tumor and its pathological photomicrograph.
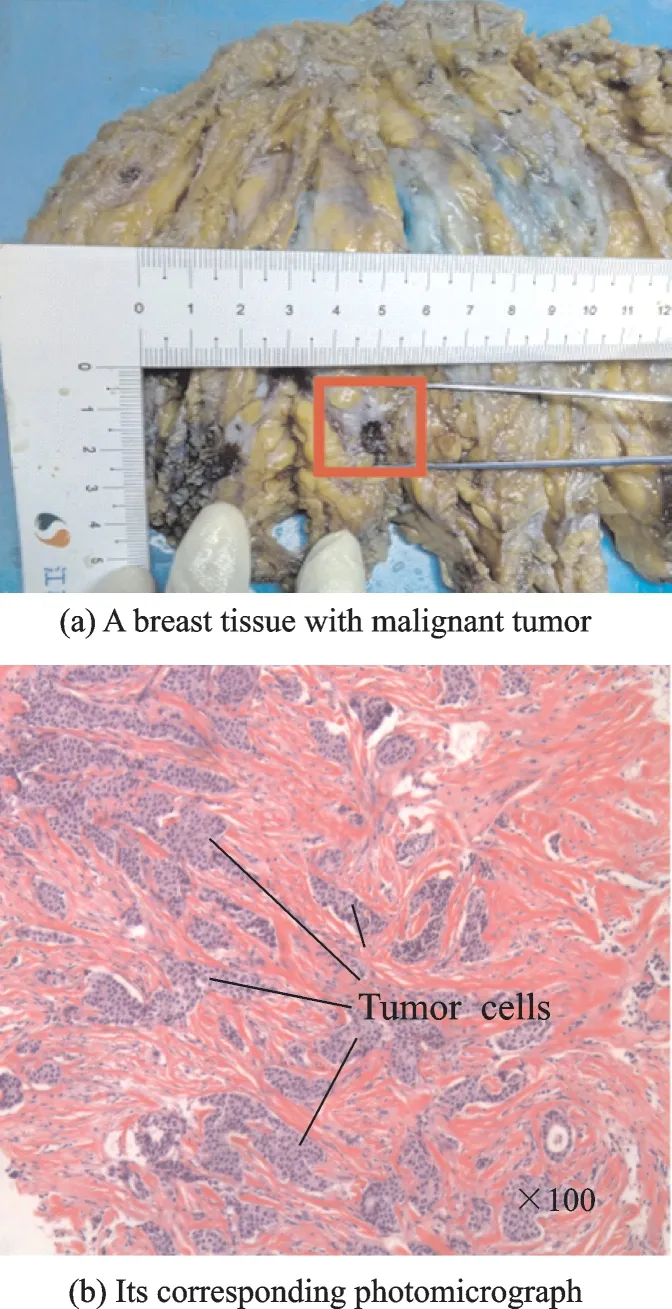
Fig.5 A typical malignant breast tumor and its photomicrograph
The benign mass area(normal area)is determined by the boundary recognition algorithm[12].The algorithm outlines the mass,uses the judgment program to read the boundary coordinates,and intercepts the lump area. The standard deviation(Stdv)of benign and malignant tumors is then calculated,respectively. The standard deviation and entropy of benign lump and malignant tumor areas are shown in Figs.6,7.
From Fig.6 we can see that the standard deviations of normal tissues are higher than those of tumor areas. The standard deviations of the normal areas are concentrated in the range of[163,178],and the standard deviations of the tumor areas are concentrated in the range of[60,143]. From Fig.7 we can see clearly that the entropies of normal tissues are higher than those of tumor areas. The entropies of the normal areas are concentrated in the range of[6.7,6.9],and the entropies of the tumor areas are concentrated in the range of[4.0,4.9].
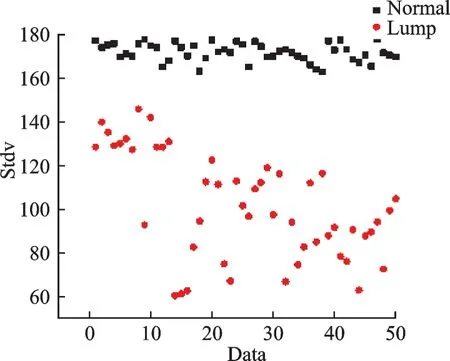
Fig.6 Standard deviations of the ultrasound RF data
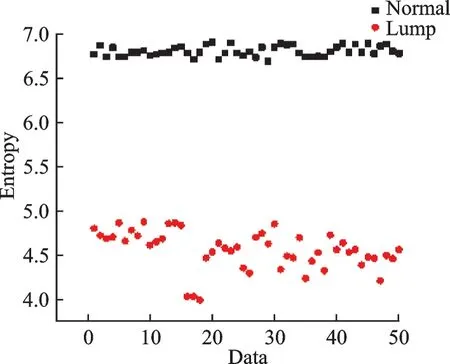
Fig.7 Entropies of the ultrasound RF data
In summary,when analyzing the ultrasonic RF signal,it is found that by comparing the standard deviation and entropy of the normal tissue and the lesion area,the difference between the benign and malignant tumors can be clearly distinguished. Both benign and malignant tumors have a certain interval concentration on the standard deviation and entropy parameters. The value of the normal area is higher than that of tumor area,which is consistent with the morphological characteristics of the cells. At the same time,we found that when comparing the standard deviation between the tumor area and the normal area,the average difference is 40%,which has a high clinical value. In the entropy algorithm,the values of normal regions are more concentrated and the values of tumor regions are more dispersed.Both algorithms have their own advantages and disadvantages,all of which help to aid diagnosis.
3 Discussion
Considering that the structure of human body is extremely complex and different organs and different tissues have different acoustic characteristics,there is also a significant difference between the acoustic impedances of the normal cell areas and the lesion areas. So when the ultrasound is exposured to human body,the two areas will have different refraction, scattering and attenuation coefficients.These lead to the differences in the images,which mainly come from two points:(1)The normal cells have regular morphologies and sizes. The ratio of the nucleus to the whole cell is stable,and in each nucleus,chromatins distribute evenly. In contrast,tumor cell volume significantly increases and the morphologies of tumor nucleuses vary from each other. There may be multinuclear,binuclear,macronucleus and other circumstances,because tumor cells are out of normal system regular control. So the nucleo-cytoplasmic ratio of tumor cells is much larger(Fig.5(b)).(2)The normal cells have contact inhibition. Normal cells locate inside human bodies neatly,once they contact with each other to a dense structure they will no longer split. But tumor cells have no contact inhibition,and they amplify disorderly and rapidly in vivo. Even if tumor cells accumulate into groups,they can still continue to split,leading to the formation of tumors.
These characteristics of tumors are consistent with the characteristics of the data presented in this paper. Because of the loss of contact inhibition of the tumor cells,they show a more agglomerated state. Therefore the tumor area occupies larger space than the normal area,which makes the response of the whole region to the ultrasound signal more consistent,and the standard deviations and the entropies of tumor regions much smaller in the images.
4 Conclusions
In this study,we propose a method to identify the benign and malignant tumors by extracting the characteristic parameters:standard deviation and entropy of the ultrasound RF signal of the breast tumor. The experimental results show that the standard deviation and entropy can clearly distinguish benign and malignant tumors. It can be used as an early screening and auxiliary judgment for breast tumors,because the ultrasound RF signal is quite different between normal tissue and diseased area. In the subsequent practical clinical application,RF parameter generation program is considered to be added to the ultrasound image scanning module. The ROI region is manually selected during the image scanning process,and the RF parameter is directly generated by the ultrasound diagnostic instrument to assist the doctor in diagnosis.
杂志排行
Transactions of Nanjing University of Aeronautics and Astronautics的其它文章
- Performance Analysis and Power Allocation for Cooperative SSK System with Receive Correlation in Rayleigh Fading Channel
- Retro-reflective Beamforming Technique with Applications in Wireless Power Transmission
- A 60 GHz Phased Array System Analysis and Its Phase Shifter in a 40 nm CMOS Technology
- Design of Power Amplifier for mmWave 5G and Beyond
- MoM-PO/SBR Algorithm Based on Collaborative Platform and Mixed Model
- Low-Complexity DOA Estimation of Noncircular Signals for Coprime Sensor Arrays
