Variation Diagnosis and Regional Comparison of Different Intensity of Rainfalls and Their Contribution to Total Rainfall in China in the Context of Global Warming
2019-09-19FengKONG
Feng KONG
School of Public Policy and Management of Tsinghua University, Beijing 100084, China; Center for Crisis Management Research, Tsinghua University, Beijing 100084, China; China Meteorological Administration Training Centre, Beijing 100081, China
Abstract Using the data of 545 meteorological stations in 1961-2015, according to the rainfall intensity classification standard issued by the China Meteorological Administration, the rainfall events were divided into six intensities: light rain, moderate rain, heavy rain, torrential rain, downpour and heavy downpour. The latter three were recorded as total torrential rain, and all the six were recorded as the total rainfall. In terms of the interannual rainfall and rainy days, the whole China was regarded as an object. Firstly, the annual rainfall and rainy day of different intensity of rainfalls of 545 stations in 1961-2015 were calculated. Then, the variation trend of rainfall and rainy days was calculated. Finally, the variation trend of contribution of different intensity of rainfalls and rainy days to total rainfall and rainy days were diagnosed. It obtained the following results. (i) The light rain in China was declining from 1961 to 2015, and the trend values of light rain and rainy days were -411.44 mm/yr and -136.99 d/yr, respectively. Heavy rain and total heavy rainfall showed an increasing trend, with rainfall and rainy day trends of 127.02 and 463.94 mm/yr and 7.93 and 4.24 d/yr, respectively. The total rainfall showed a "hockey" phenomenon of "first rise, then decline", and the trend values of rainfall and rainy days were 204.29 mm/yr and -95.81 d/yr, respectively. Except the northern region, the rainfall in most parts of China was dominated by increasing trends and was moving towards extremes. (ii) In terms of rainfall contribution rate, the contribution of light rain to total rainfall showed a declining trend, and the trend values of rainfall and rainy day contribution were both -0.11%/yr. The contribution of other intensity rainfalls to total rainfall showed an increasing trend. The contribution of torrential rain to the total torrential rain showed a declining trend. The contribution trends of rainfall and rainy days were -0.06% and -0.03%/yr, respectively. The contribution of downpour and heavy downpour to total torrential rain showed an increasing trend, indicating the intensity of torrential rain in China is increasing. Although the contribution rate of different intensity of rainfalls to total rainfall was different in different areas of China, the contribution rate of heavy rainfall to total rainfall in most areas showed an increasing trend. (iii) Through comparing the rainfall and rainy days of six different intensity of rainfalls, it can be found that China’s heavy rainfall events are increasing and the rainfall intensity is developing towards extremes.
Key words Rainfall classification, Rainfall and rainy days, Variation trend, Rainfall contribution rate, Heavy downpour, China
1 Introduction
In the observation and evaluation research of climate change, the variation in different intensity of rainfalls is receiving wider attention from all walks of life[1-3]. According to theIPCCFifthAssessmentReport(AR5), there is different degree of variation in rainfall of many parts of the world, with the frequency of heavy rainfall events increasing, and this trend is expected to increase further with the global warming[4]. Whether extreme rainfall, as a type of event in rainfall events, has significantly affected the overall rainfall process is still under further study. While paying attention to the increase of extreme rainfall events, the variation characteristics of other different intensity of rainfalls are also one of the scientific issues that need to be paid attention to in the research of climate change and disaster risk[3, 5-6].Rainfall is an important part of the global climate and water cycle. In the context of global warming, different intensity of rainfalls have different degrees of variation trend and fluctuation characteristics, which exert a significant influence on the regional climate, ecosystem and human settlements in different regions[7-9]. At present, the academic circles pay more attention to the study of torrential rain that causes floods. Due to the concentrated rainfall period, the rainfall intensity is very large and the range is wide, such torrential rain often causes flood disasters in some areas, which seriously affects industrial and agricultural production. The research on torrential rain that causes floods mainly analyzed the formation conditions and development process of torrential rain from the perspective of meteorology. However, few scholars started the research from the perspective of climatology, the distribution characteristics of torrential rain and its interannual and interdecadal variations[12], and analysis was even less on the contribution rate of torrential rain to total rainfall from the perspective of different intensity of rainfalls[13]. In the context of global warming, both the average intensity of extreme heavy rainfall and value of extreme heavy rainfall showed an increasing trend, and the extreme heavy rainfall events tend to increase, especially in the Yangtze River basin, the process of heavy rainfall is obviously increasing[14]. For areas with increased total rainfall, the heavy rainfall and heavy rainfall events are likely to increase at a greater rate, and regional rainfall studies in the United States of America, Canada, and Japan have confirmed these conclusions[3-4]. Studies have shown that the variation trend of total rainfall in China is not obvious, the number of rainy days is significantly reduced, while the rainfall intensity is increasing[15]. On the regional scale, the annual rainfall in North China tends to decline, the value of extreme heavy rainfall and the average intensity of extreme heavy rainfall also tend to decline, and the frequency of torrential rain events is significantly reduced[16]. The total rainfall in the west of western regions tends to increase, and there is no significant change in the value of extreme heavy rainfall and the intensity of extreme heavy rainfall, but the torrential rain events tend to become frequent[17]. Besides, the annual rainfall and extreme heavy rainfall in the Yangtze River basin and the south of the Yangtze river tend to increase, both the value of extreme heavy rainfall and intensity of heavy rainfall events are increased, and the extreme heavy rainfall events are increased[18]. In the middle and lower reaches of the Yangtze River and the coastal areas of South China, the increase in annual rainfall is mainly caused by the increase in rainfall intensity, while the decline in annual rainfall in northern China is mainly due to the decrease in the number of rainy days and increase in the intensity of rainfall[19]. The increase in rainfall in western China is mainly caused by the combination of rainy days and rainfall intensity[20-21]. For the middle and lower reaches of the Yangtze River, the variation trend of annual total rainfall is not obvious, but the total rainfall in different seasons shows a significant declining (spring) and increasing (summer) trend[22]. In terms of the number of rainy days, in the middle and lower reaches of the Yangtze River, except the summer, the number of rainy days in other seasons and years was significantly reduced, and the sudden decline in the number of annual rainy days occurred in 1977-1978. The increase in annual rainfall intensity is mainly due to the increase in the contribution of torrential rain to total rainfall, and the increase in the contribution of torrential rain to total rainfall is due to its contribution to the number of rainy days, because the variation of intensity of torrential rain itself is not significant[23-25].
In summary, on the one hand, studies about different intensity of rainfalls focus on one aspect of rainfall or rainy days, and there is still no common understanding in the academic circle[26-31]. On the other hand, the academic circle paid more attention to a certain intensity of rainfall, especially the variation of extreme rainfall, and few scholars touched upon the overall situation of rainfall. The increase in rainfall is not necessarily caused by an increase in rainfall intensity, but may be caused by an increase in the number of rainy days[3-4]. Therefore, it is not sufficient to study only the change of rainfall, but should also pay attention to the number of rainy days, the variation of rainfall intensity and the situation of extreme rainfall, so as to have a more comprehensive understanding of the characteristics of rainfall variation. Based on the existing research status, according to the rainfall intensity classification standard issued by the China Meteorological Administration, we studied the six different intensity of rainfalls: light rain, moderate rain, heavy rain, torrential rain, downpour, and heavy downpour. We analyzed the interannual variation trends of these six intensity of rainfalls from 1961 to 2015. Besides, we diagnosed the interannual variation of the contribution of six different intensity of rainfalls to total rainfall, and discussed the contribution of the torrential rain, downpour, and heavy downpour to the interannual variation of the total torrential rain. The conclusions of this paper are of great significance for understanding the temporal and spatial patterns of rainfall and the variation characteristics and rules of water resources in China during the past six decades in the context of global climate change, and are expected to provide an important scientific basis for the detection, evaluation and early warning of extreme rainfall events.
2 Data and methods
2.1 Data sourceAccording to the IPCC AR5 report, the global climate change will show interannual and interdecadal differences due to various scale factors. Short-term climate trend is sensitive to the choice of start and end years and generally will not reflect long-term climate change, thus the climate change research is generally based on 30 or longer years of data. The rainfall data used in this study were selected from the daily value data set of the surface climatic data of China Meteorological Science Data Sharing Service Network. According to the principle of keeping the most stations as much as possible and ensuring the continuous observation time, the time series used in the study was determined to be 1961-2015, and the relevant data were verified. For the missing data, the adjacent station values of the missing station or adjacent years were used. The added mean value filled the missing day value, and the ratio of the interpolation data to the total data was less than 0.5%. After the above check was completed, referred to the existing research results. The stations with daily value missing more than 1% of the 60-year value were excluded, the station with daily value missing less than 60-year value was used, and the decadal value of this station was used to fill the missing day value of the station, and finally obtained 545 rainfall observation stations and the station distribution is shown in Fig.1.
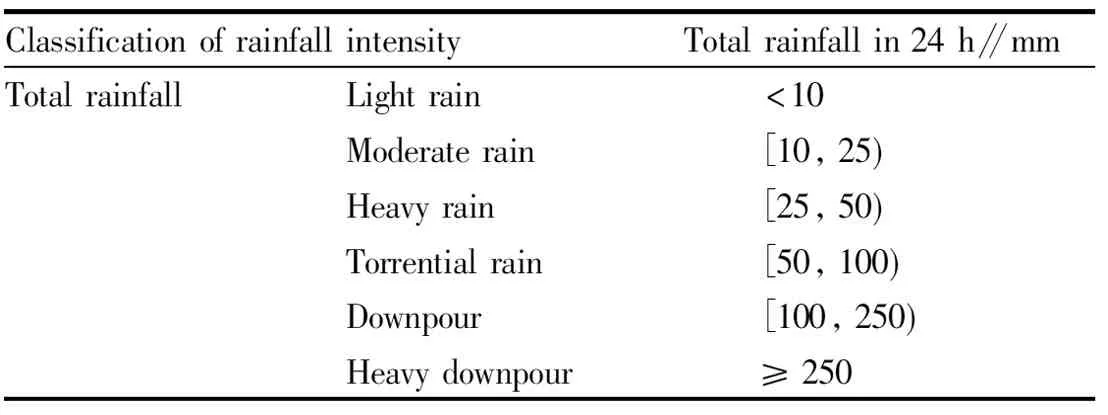
2.2 Calculation methodsAccording to the rainfall intensity classification standard issued by the China Meteorological Administration, the rainfall events were divided into six intensities: light rain, moderate rain, heavy rain, torrential rain, downpour and heavy downpour (Table 1). The latter three were recorded as total torrential rain, and all the six were recorded as the total rainfall. This study does not include hail and snowfall. First, we regarded China as a whole, and calculated the sum of different intensity of rainfalls and number of rainy days of all stations in China and the seven geographical regions in 1961-2015, and then used the linear trend method to study the variation trend of different intensity of rainfalls and number of rainy days in the seven geographical regions (Fig.1).
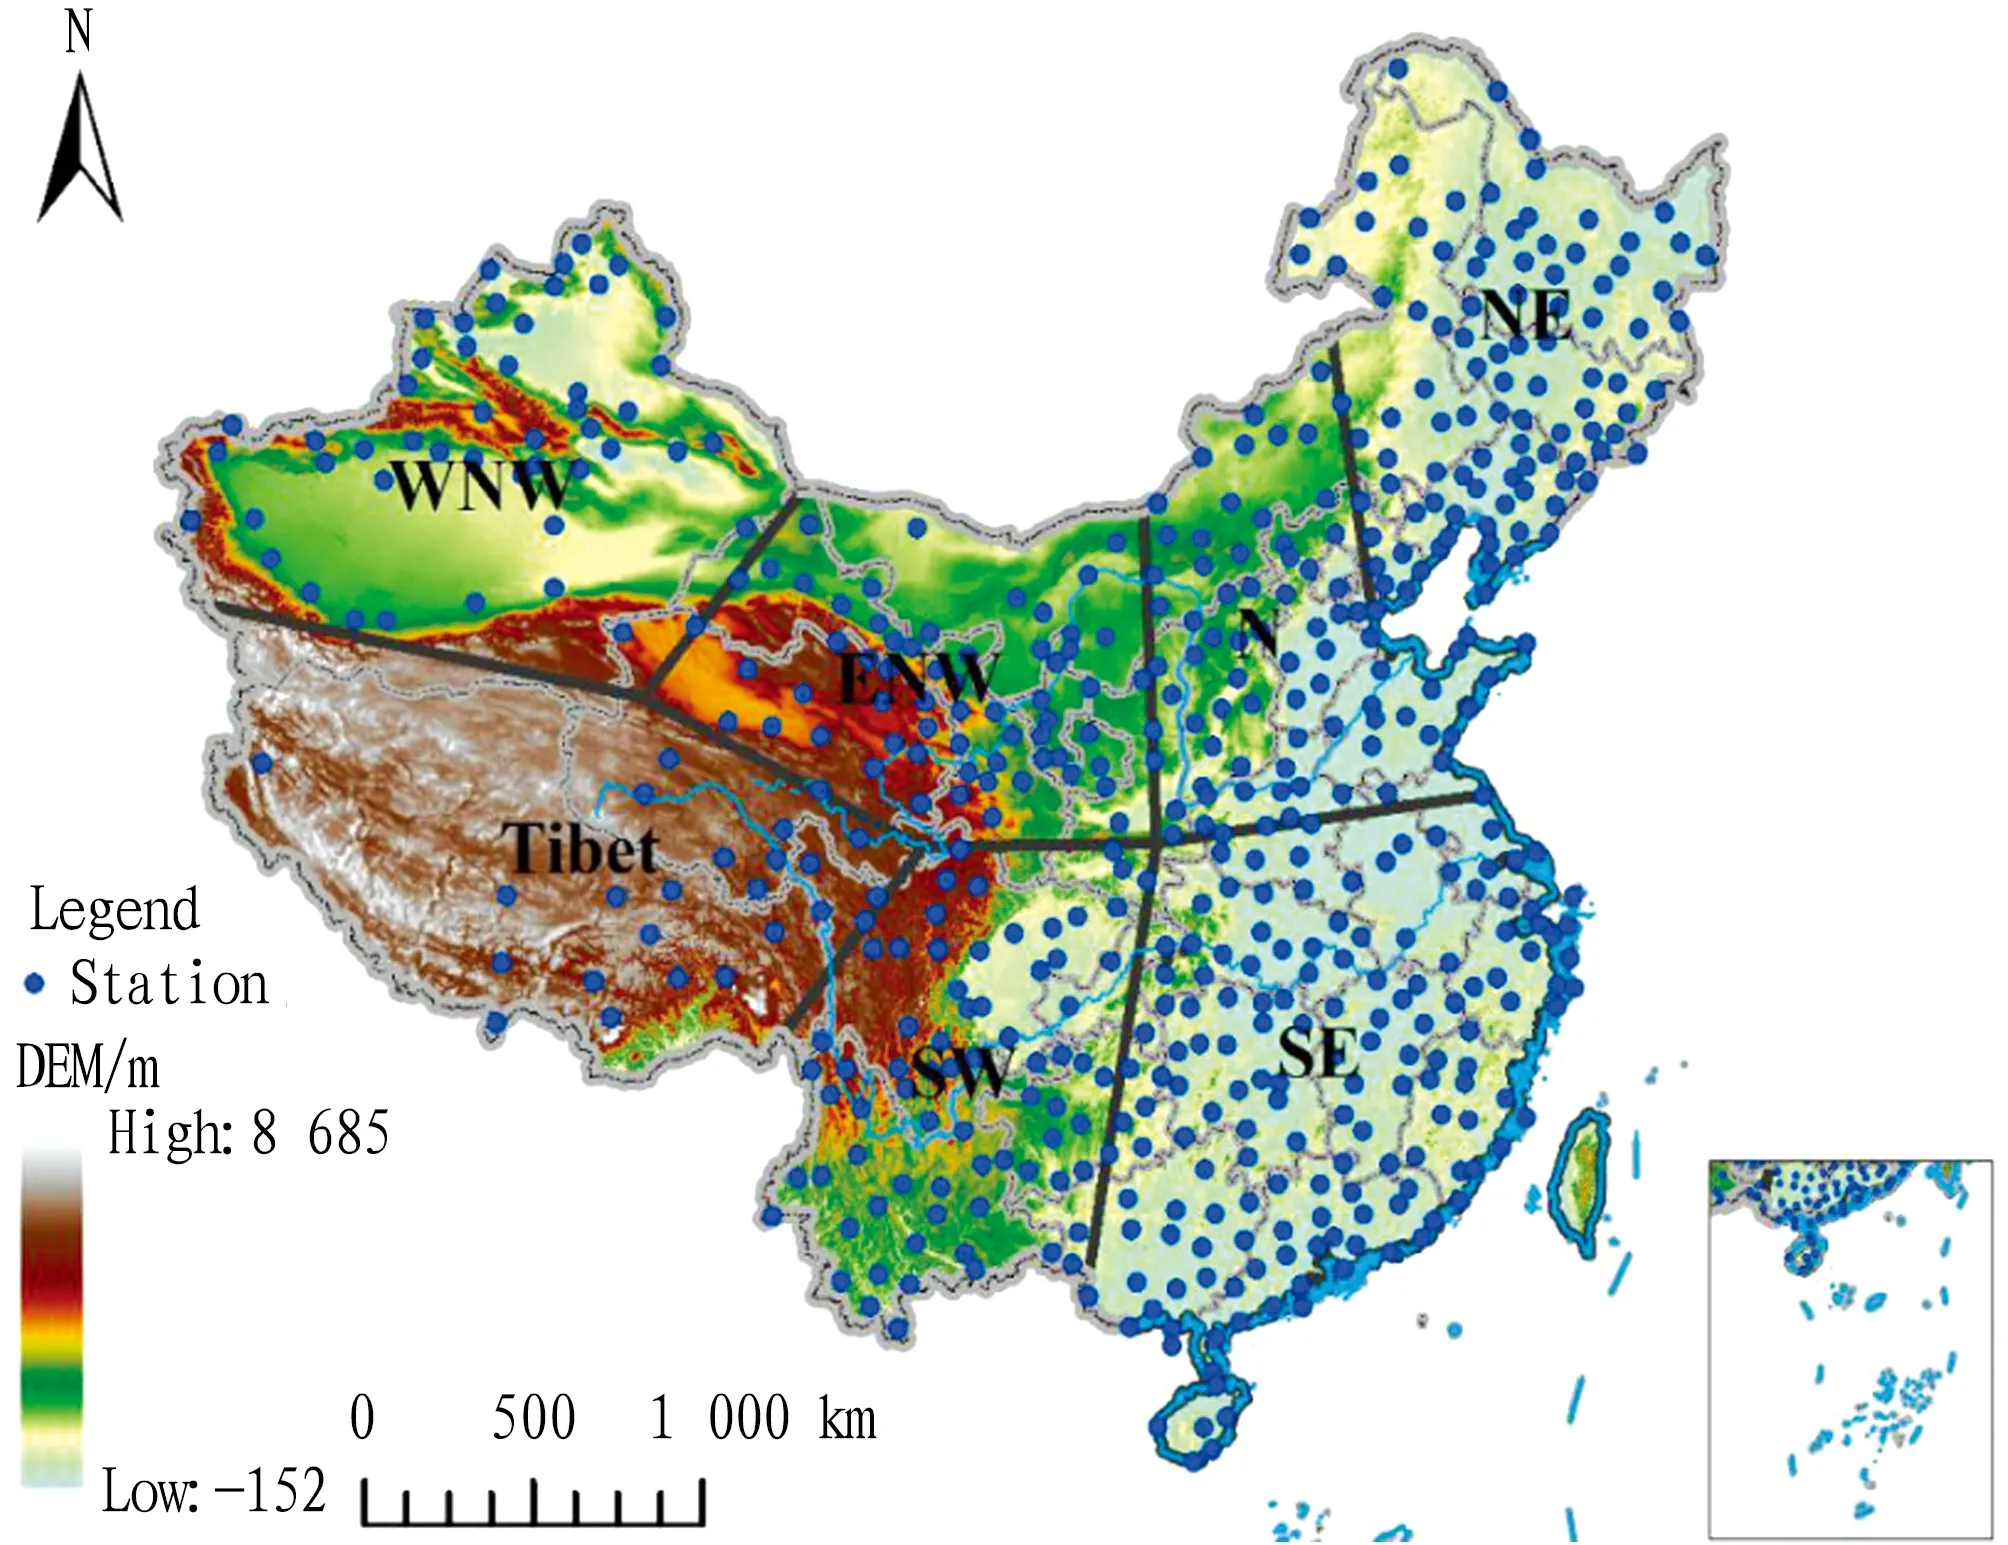
Fig.1 Spatial distribution of China’s digital elevation, seven geographical regions and meteorological stations
Besides, we used the ratio of different intensity of rainfalls and number of rainy days to the total rainfall and total rainy days as the contribution of different intensity of rainfalls to total rainfall. In addition, we used the linear trend method to calculate the variation trend of the contribution of different intensity of rainfalls to total rainfall in China and the seven geographical regions, and carried out theFtest to conduct significance test. TheFtest is usually used to test whether the linear relationship between the independent variable and the dependent variable is significant and is widely applied in geographical and meteorological statistics[17, 28, 31].
Table 1 Criteria for classification of rainfall intensity issued by China Meteorological Administration
ClassificationofrainfallintensityTotalrainfallin24h∥mmTotalrainfallLightrain<10Moderaterain[10,25)Heavyrain[25,50)Torrentialrain[50,100)Downpour[100,250)Heavydownpour≥250
3 Results and analysis
3.1 Diagnosis of variation of different intensity of rainfalls
In 1961-2015, China’s different intensity of rainfalls showed different variation trends in fluctuations, and the fluctuation amplitudes varied greatly in different periods, as shown in Fig.2.
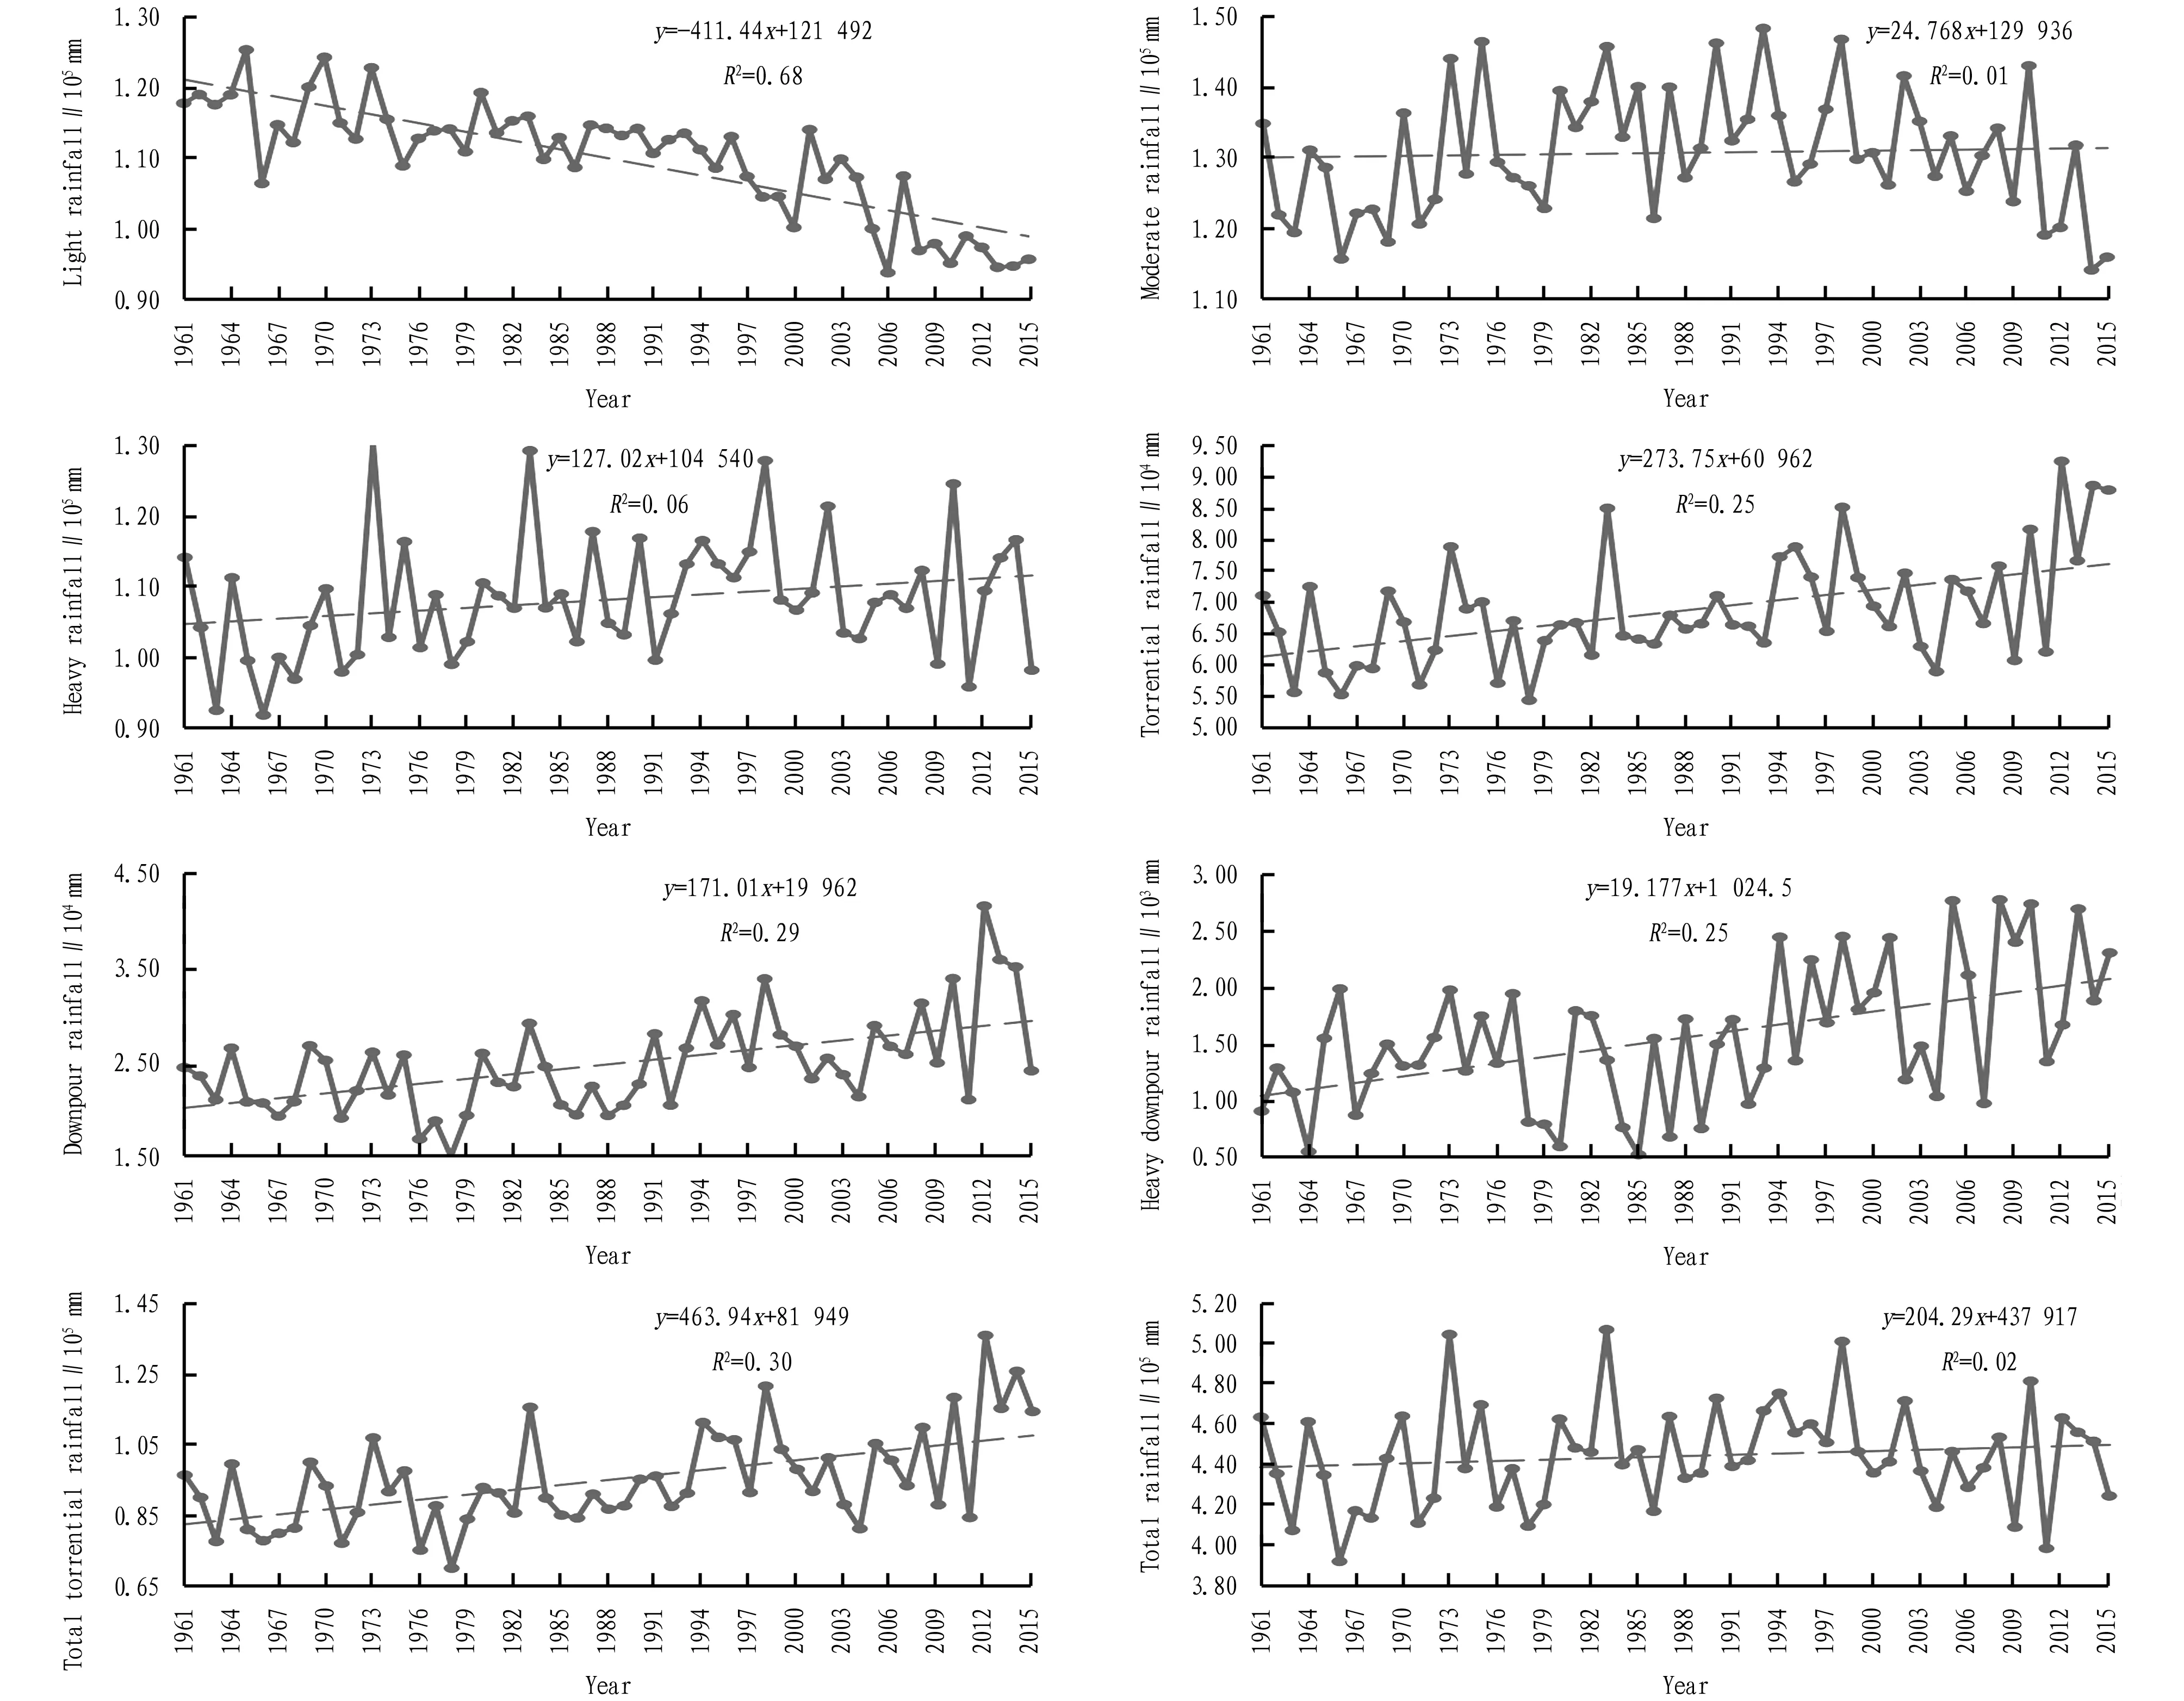
Fig.2 Variation of different intensity of rainfalls in China in 1961-2015
The light rain and rainfall showed a relatively stable decline trend in the fluctuations in 1961-2015, with a trend value of -411.44 mm/yr, which passed the significance test at 0.05 level. The rainfall of moderate rain showed an increasing trend in 1961-1990, and a declining trend in 1991-2015; it showed a slight increasing trend in 1961-2015, with the trend value of 24.77 mm/yr, which did not pass the significance test at 0.05 level, and the interannual fluctuations of moderate rainfall were larger than that of light rainfall. The heavy rain rainfall showed an increasing trend in the fluctuations, the trend value was 127.02 mm/yr, failed to pass the significance test at 0.05 level, the heavy rain rainfall showed an increasing trend in 1961-1998, and showed a slight declining trend in 1999-2015. The rainfall of torrential rain, downpour, and heavy downpour and total torrential rain showed an increasing trend in 1961-2015, and the trend values were 273.75, 171.01, 19.18 and 463.94 mm/yr, respectively, all passed the significance test at 0.05 level. The total rainfall showed an increasing trend in 1961-2015, with a trend value of 204.29 mm/yr, which passed the significance test at 0.05 level. In 1961-1996, it showed an increasing trend, while in 1999-2015, it showed a declining trend. Through comparing the rainfall with different intensities, it can be found that the rainfall of light rain is declining, and the heavy rain and torrential rain are increasing. Among them, the moderate rain, heavy rain and total rainfall showed the "hockey" phenomenon of "first rise and then fall".
From the seven geographical regions, except for the heavy downpour rainfall in the northeast region, the other intensities of rainfall increased in different degrees (Table 2). In the northern region, the rainfall of different intensities is mainly a declining trend. Except the rainfall of light rain showing an increasing trend, the rainfall of other intensities showed different degree of declining trend. In the east and west of northwest, and Tibet, the rainfall of different intensities mainly showed an increasing trend. Except for the rainfall of torrential rain in the east of northwest of China and Tibet, the rainfall of other intensities showed a declining trend in different degrees. The total rainfall and light rainfalls in the southwestern region showed a declining trend, and the rainfall above the torrential rain increased in different degrees. Except for the heavy downpour rainfall in the southeastern region, the rainfall of other intensities increased in different degrees. Through comparison, it can be known that the rainfall of different intensities in western China, Tibet and southeastern China are mainly dominated by the increasing trend, while the northern region is dominated by the declining trend. The rainfalls of different intensities in different regions of China show different variation characteristics.
Table 2 Variation of different intensity of rainfalls in China in 1961-2015

Rainfalltrend∥mm/yrNortheastNorthEastofNorthwestWestofNorthwestTibetSouthwestSoutheastLightrain74.69∗20.0935.36∗51.13∗43.41∗-39.24∗115.84Moderaterain28.30-1.7112.82∗19.11∗23.31∗-61.27∗43.89Heavyrain1.09-11.03∗1.485.353.44-10.99∗1.69∗Torrentialrain4.51∗-9.68∗-0.650.45-0.162.177.00∗Downpour5.08-5.58∗1.730.000.316.64∗7.89∗Heavydownpour-1.20-1.960.000.000.001.46-1.86Totaltorrentialrain8.39∗-17.22∗1.090.450.1610.27∗13.02∗Totalrainfall112.47∗-9.88∗50.76∗76.04∗70.32∗-101.22∗174.44∗
Note:*denotes that it passed the significance test at 0.05 level.
In 1961-2015, the rainy days and rainfall of different intensities in China were similar, showing different degree of variation trend in fluctuations (Fig.3). The number of rainy days of light rain in 1961-2015 showed an declining trend in fluctuations, the trend value was -133.99 d/yr, which passed the significance test at 0.05 level; in 1961-1990, the declining trend weakened, while in 1991-2015, the declining trend was relatively significant. The number of rainy days of moderate rain showed an increasing trend in 1961-2015, the trend value was 29.02 d/yr, which passed the significance test at 0.05 level. It should be noted that the increase in the rainy days of moderate rain in 1961-1992 was significant, while it slightly declined in 1993-2015. The rainy days of heavy rain showed an increasing trend in fluctuations in 1961-2015, and the trend value was 7.93 d/yr, which passed the significance test at 0.05 level. Besides, the fluctuation amplitude of rainy days of heavy rain was greater than that of light rain and moderate rain. The rainfall of torrential rain, downpour, and heavy downpour and total torrential rain showed an increasing trend in 1961-2015, and the trend values were 3.18, 0.99, 0.07 and 4.24 d/yr, respectively, all passed the significance test at 0.05 level. The number of rainy days of total rainfall showed a declining trend in 1961-2015, the trend value was -95.81 d/yr, which passed the significance test at 0.05 level. The number of rainy days of total rainfall showed a slight increase in 1961-1990 and showed a significant increasing trend in 1991-2015. Through comparison, it can be found that the number of rainy days of light rain showed a declining trend, while that of heavy rain and torrential rain showed an increasing trend. Among them, the number of rainy days of the moderate rain and total rain showed a "hockey"phenomenon of "first rise and then fall".

Fig.3 Variation of number of rainy days of different intensity of rainfalls in China in 1961-2015
From the seven geographical regions, the number of rainy days of different intensity of rainfalls in northeast, northwest, and Tibet showed an increasing trend by different degrees (Table 3). The number of rainy days of different intensity rainfalls in the northern region showed a trend of "both end increasing and middle declining". In other words, the number of rainy days of moderate rain, heavy rain and torrential rain showed a declining trend in different degrees, while the number of rainy days of other intensity of rainfalls showed an increasing trend by different degrees. On the whole, the number of rainy days of total torrential rain in northern region showed a declining trend, while the total rainy days showed an increasing trend. The number of rainy days of different intensity rainfalls in southwestern and southeastern regions showed a trend of "both end division". In other words, the number of rainy days of weak rainfalls showed a declining trend, while that of heavy rainfalls showed an increasing trend. The number of rainy days of total torrential rain showed an increasing trend, while that of total rainfall showed a declining trend. Through comparative analysis, it can be known that the number of rainy days of heavy rainfalls in southern region of China increased, while that of different intensity of rainfalls in northeast, northwest, and Tibet showed an increasing trend, the number of rainy days of moderate intensity rainfalls in north China declined, and that of heavy rainfalls and light rain also declined.
Table 3 Variation of number of rainy days of different intensity of rainfalls in China in 1961-2015

Rainydaystrend∥mm/dNortheastNorthEastofNorthwestWestofNorthwestTibetSouthwestSoutheastLightrain52.8313.0723.9931.4521.06-18.69-21.72Moderaterain2.03-0.100.871.331.60-3.80-1.10Heavyrain0.06-0.290.070.170.11-0.362.24Torrentialrain0.08-0.15-0.020.010.000.001.34Downpour0.04-0.030.010.000.000.040.71Heavydownpour0.00-0.010.000.000.000.000.04Totaltorrentialrain0.12-0.180.000.010.000.042.10Totalrainfall55.0312.4924.9332.9522.77-22.81-18.48
3.2 Contribution of different intensity of rainfalls to total rainfallWe used the ratio of different intensity of rainfalls to the total rainfall as the contribution of different intensity of rainfalls to total rainfall. In 1961-2015, the contribution of light rain to total rainfall showed a declining trend in fluctuations (Fig.4), and the trend value was -0.11%/yr, which passed the significance test at 0.05 level. In 1961-2015, the contribution of moderate rain to total rainfall showed a slight declining trend in fluctuations, which did not pass the significance test at 0.05 level. Compared with the light rain, the fluctuation amplitude of contribution of moderate rain to total rainfall was greater. In 1961-2015, the contribution of heavy rain, torrential rain, downpour, and heavy downpour, and total torrential rain to total rainfall showed an increasing trend, with the trend values of 0.02%, 0.06%, 0.04%, 0.01% and 0.10%/yr, respectively, except for heavy rain, all other passed the significance test at 0.05 level. Through comparison, it is found that the contribution of light rain and moderate rain to total rainfall showed a declining trend, while the contribution of heavy rain and torrential rain to total rainfall showed an increasing trend.
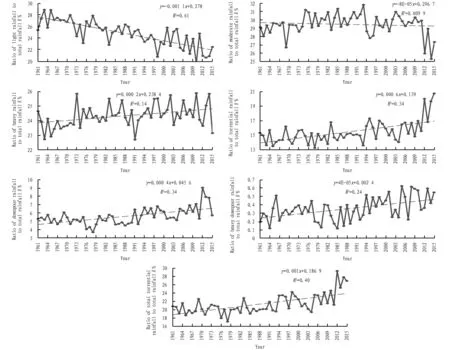
Fig.4 Variation of different intensity of rainfalls to total rainfall in China in 1961-2015
From the seven geographical regions, the contribution rate of light rain and moderate rain to total rainfall in northeast, Tibet, and southwest showed a declining trend (Table 4), while the contribution rate of other intensity of rainfalls to total rainfall showed an increasing trend by different degrees. For the southeastern region, only the contribution rate of light rain to total rainfall showed a declining trend, while that of other intensity of rainfalls showed an increasing trend by different degrees. These indicated that the the contribution rate of light rains to total rainfall declined. For the northern region, the contribution rate showed a trend of "both end increasing and middle declining". Specifically, the contribution rate of light rain and rain above the downpour showed an increasing trend, while the contribution rate of other intensity of rainfalls showed a declining trend. The situation in the east and west of northwestern region was similar to northern region, showing the trend of "both end increasing and middle declining", especially, the contribution rate of total torrential rain showed an increasing trend. In summary, the contribution rate of heavy rainfall in most parts of China has increased.
Table 4 Variation of contribution rate of different intensity of rainfalls to total rainfall in China in 1961-2015

Rainfallproportiontrend∥%/10yrNortheastNorthEastofNorthwestWestofNorthwestTibetSouthwestSoutheastLightrain-0.21∗0.090.030.05-0.04-0.26∗-0.39∗Moderaterain-0.14∗-0.02-0.02-0.02-0.11-0.13∗0.02Heavyrain0.12∗-0.05-0.02-0.060.060.050.06Torrentialrain0.09-0.06∗0.010.020.070.18∗0.27∗Downpour0.13∗0.030.000.010.020.11∗0.03Heavydownpour0.010.010.000.000.000.010.01Totaltorrentialrain0.23∗-0.020.010.030.090.30∗0.31∗
Note:*denotes that it passed the significance test at 0.05 level.
Similar to the contribution of different intensity rainfalls to total rainfall, the contribution of different intensity rainfall to total rainfall and number of rain days in China in 1961-2015 also showed different degree of variation in fluctuations (Fig.5). In 1961-2015, the contribution of light rain to number of total rainy days showed a declining trend in fluctuations, with trend value of -0.11%/yr, which passed the significance test at 0.05 level. The contribution of moderate rain to the total rainfall and rainy days showed an increasing trend in the fluctuations, with a trend value of 0.08%/yr, which passed the significance test at 0.05 level. In 1961-1990, it showed a significant increase trend, and in 1991-2015, the variation trend was not significant. The contribution of heavy rain, torrential rain, downpour, and heavy downpour and total torrential rain to the number of total rainy days showed an increasing trend in fluctuations, with the trend values of 0.02%, 0.01%, >0.01%, >0% and 0.01%/yr, all passed the significance test at 0.01 level. Through comparison, it can be found that the contribution of different intensity rainfalls in China to the total rainfall and rainy days is developing towards extremes.

Fig.5 Variation of different intensity of rainfalls to number of total rainy days in China in 1961-2015
From the seven geographical regions, the contribution rate of light rainfalls to number of total rainy days in northeastern, Tibetan, southwestern and southeastern regions showed a declining trend, the contribution rate of heavy rainfalls, especially total torrential rainy days showed an increasing trend (Table 5). In east and west of northwestern regions, except the contribution rate of moderate rainy days and heavy rainy days showing a declining trend, the contribution rate of other intensity of rainfalls showed an increasing trend of different degrees. It is worth noting that except for the contribution rate of light rainy days in the northern region, the contribution rate of other intensity rainfalls and rainy days showed a declining trend, which is very likely to aggravate the process of drought in the northern region. Except for the northern region, the contribution rate of total torrential rainy days in other regions showed an increasing trend.
Table 5 Variation of contribution rate of different intensity of rainfalls to number of total rainy days in China in 1961-2015

Rainydaysproportiontrend∥%/10yrNortheastNorthEastofNorthwestWestofNorthwestTibetSouthwestSoutheastLightrain-0.060.080.020.01-0.02-0.34-0.33Moderaterain-0.02-0.01-0.02-0.02-0.04-0.08-0.11Heavyrain0.02-0.02-0.01-0.020.020.33-0.08Torrentialrain0.03-0.030.010.010.030.090.32Downpour0.02-0.010.000.020.010.020.16Heavydownpour0.01-0.010.000.000.00-0.020.04Totaltorrentialrain0.06-0.050.010.030.040.090.52
3.3 Contribution of different intensity of torrential rain to total torrential rainFurther, we used the ratio of different intensity torrential rains to total torrential rainfall as different intensity torrential rains as the contribution to total torrential rainfall. In 1961-2015, the contribution of torrential rain to total torrential rainfall showed a declining trend in fluctuations (Fig.6), trend value was -0.06%/yr, which did not pass the significance test at 0.05 level. The contribution of downpour and heavy downpour to the total torrential rainfall showed an increasing trend in the fluctuations, with trend values of 0.05% and 0.01%/yr, respectively, and none of them passed the significance test at 0.05 level. Through comparison, it is found that in different intensity of torrential rains, the contribution of downpour and heavy downpour to total torrential rainfall showed an increasing trend, while the contribution of torrential rainfall to total torrential rainfall showed a declining trend.
From the seven geographical regions, the contribution rate of downpour to total torrential rainfall in east and west of northwestern region showed a declining trend (Table 6), while the contribution rate of other intensity of torrential rains to total torrential rainfall showed an increasing trend. For the northeastern, northern, Tibetan, southwestern, and southeastern regions, except for the contribution rate of torrential rainfall showing a declining trend, the contribution rate of other intensity of torrential rains showed an increasing trend, especially in southeastern region.
Similar to the contribution of different intensity of torrential rains to total torrential rainfall, we used the ratio of different intensity torrential rains to the number of total torrential rainy days as the contribution of different intensity torrential rains to the number of total torrential rainy days (Fig.7). In 1961-2015, the contribution of torrential rain to the number of total torrential rainy days showed a declining trend in fluctuations, with the trend value of -0.03%/yr, which did not pass the significance test at 0.05 level. The contribution of downpour and heavy downpour to the number of total torrential rainy days showed an increasing trend in the fluctuations, with trend values of 0.03% and >0%/yr, respectively, and none of them passed the significance test at 0.05 level. The above comparison indicated that the number of rainy days in China is developing towards extremes. In all the seven geographical regions, the contribution rate of different intensity of torrential rains to the number of total torrential rainy days is similar to that of different intensity of torrential rains to the total torrential rainfall (Table 6).
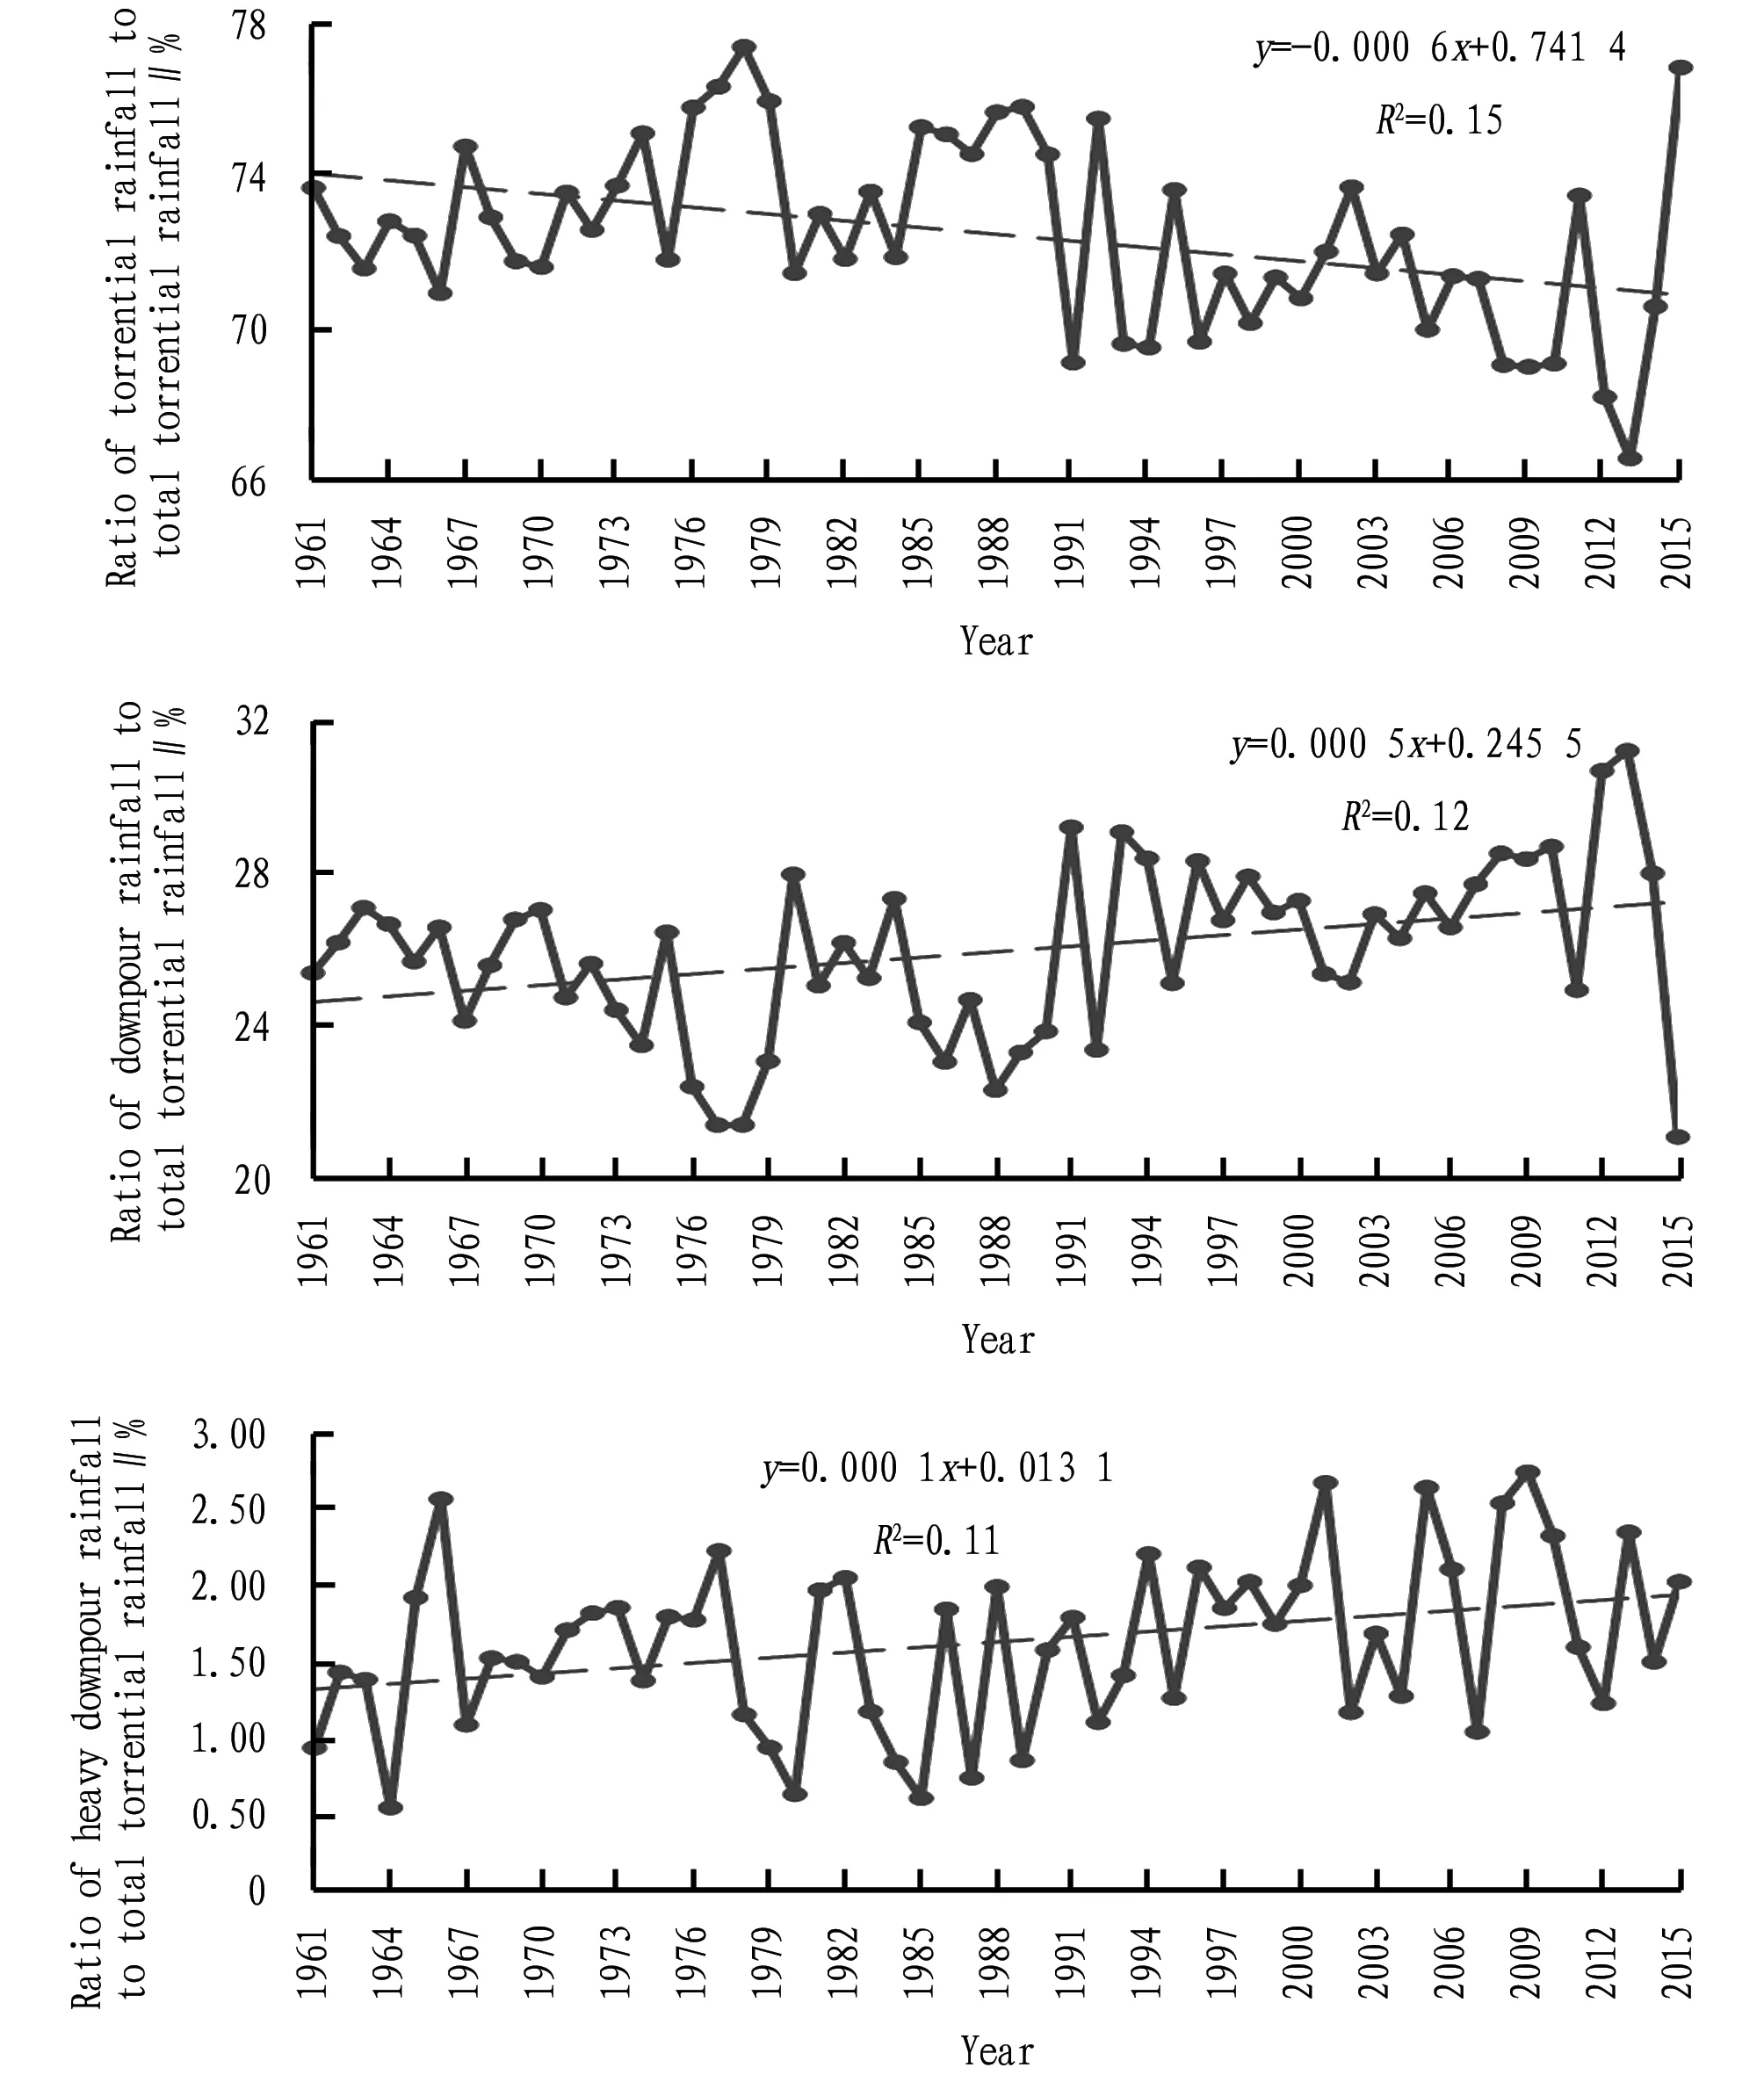
Fig.6 Variation of contribution of different intensity of torrential rainfalls to total torrential rainfall in China in 1961-2015
Table 6 Variation of contribution rate of different intensity of torrential rainfalls and number of rainy days to total torrential rainfall and number of total rainy days in China in 1961-2015

Type∥%/10yrTorenfialrainlevelNortheastNorthEastofNorthwestWestofNorthwestTibetSouthwestSoutheastRainfallproportiontrendTorrentialrain-0.24∗-0.31∗0.010.05-0.21∗-0.39∗-0.61∗Downpour0.23∗0.28∗-0.01-0.050.19∗0.30∗0.49∗Heavydownpour0.010.030.000.000.020.090.12∗RainydaysproportiontrendTorrentialrain-0.15∗-0.12∗0.010.01-0.13∗-0.30∗-0.63∗Downpour0.090.08-0.01-0.010.11∗0.22∗0.37∗Heavydownpour0.060.040.000.000.020.080.26∗
Note:*denotes that it passed the significance test at 0.05 level.
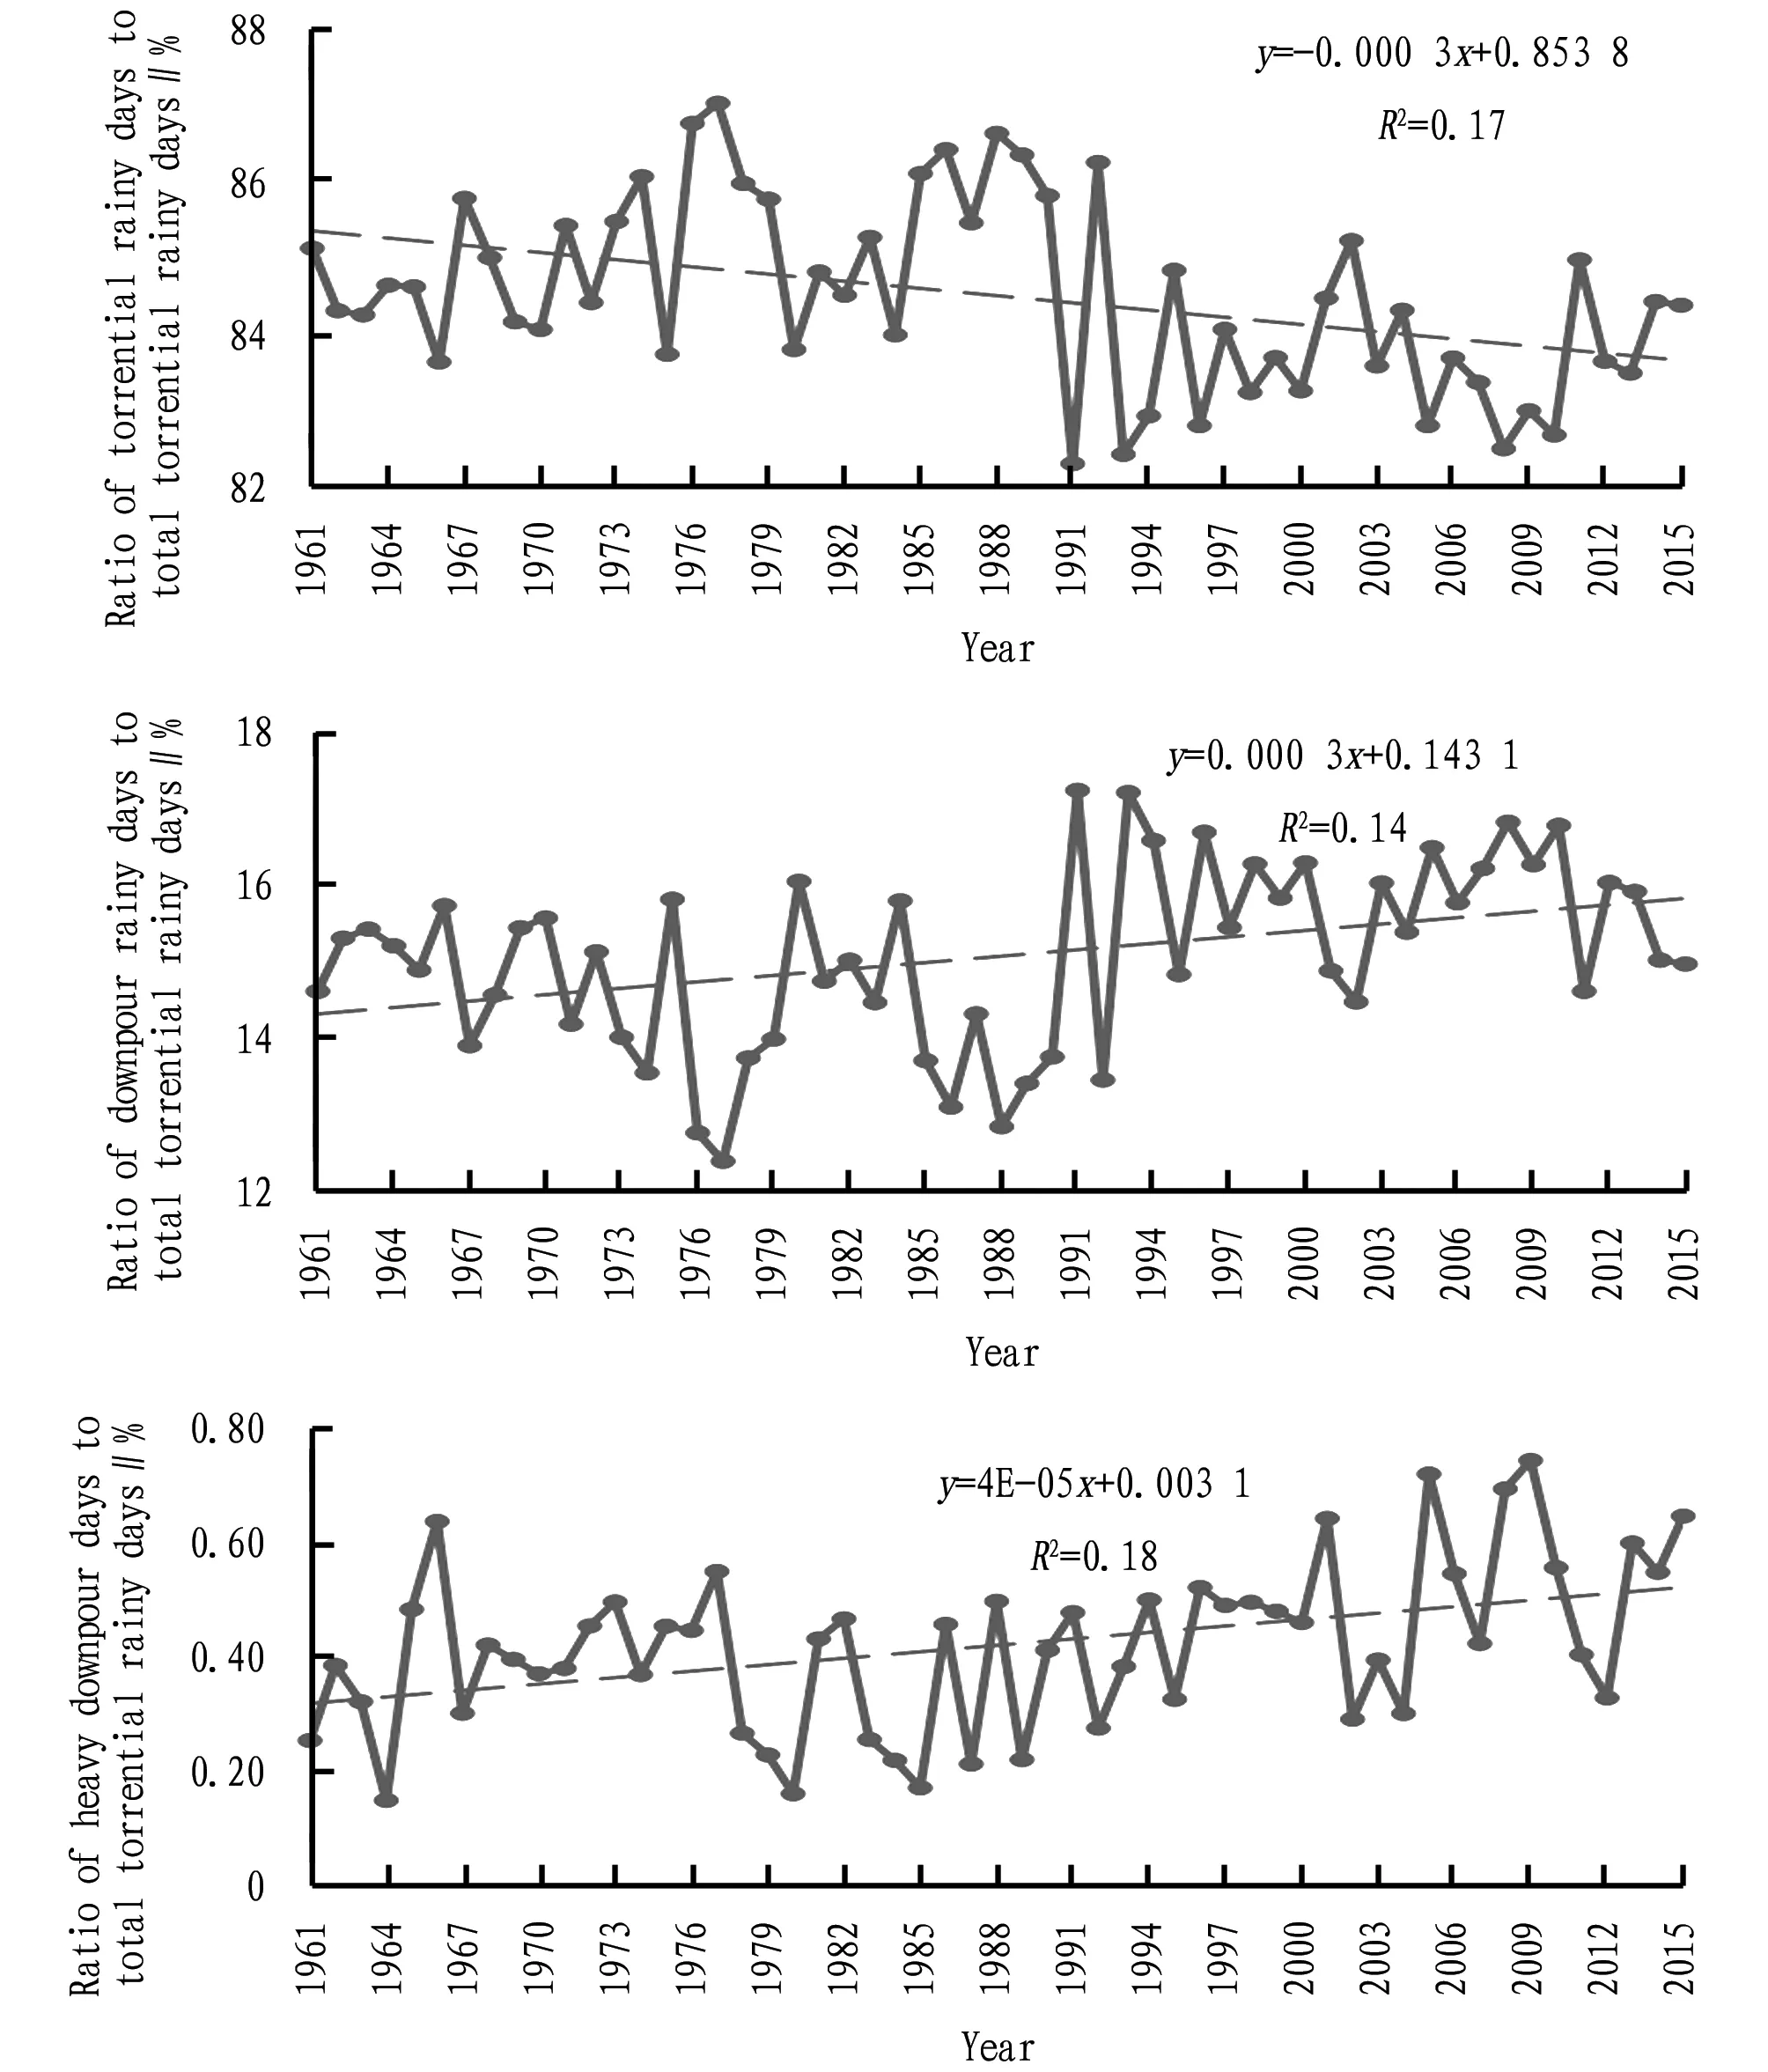
Fig.7 Variation of contribution of different intensity of torrential rainy days to the number of total torrential rainy days in China in 1961-2015
4 Conclusions and discussions
4.1 ConclusionsIn summary, the data of 545 meteorological stations were used to diagnose the variation trend of different intensity of rainfalls in China in 1961-2015 and its contribution to total rainfall. The following main conclusions were obtained.
(i) In 1961-2015, the different intensity of rainfalls in China showed a different variation trend in fluctuations. In 1961-2015, the rainfall of light rain showed a declining trend, with the trend value of -411.44 mm/yr; the rainfall of moderate rain, heavy rain, torrential rain, downpour, and heavy downpour, total torrential rainfall, and total rainfall showed an increasing trend, with the trend values of 24.77, 127.02, 273.75, 171.01, 19.18, 463.94 and 204.29 mm/yr, respectively. Among them, the moderate rain, heavy rain and total rainfall showed the "hockey" phenomenon of "first rise and then fall". In 1961-2015, the light rainfall and the number of days of light rain showed a declining trend, with the trend values of -136.99 and -95.81 d/yr, respectively. The number of rainy days of moderate rain, heavy rain, torrential rain, downpour, and heavy downpour, and the number of total torrential rainy days showed an increasing trend, with the trend values of 29.02, 7.93, 3.18, 0.99, 0.07 and 4.24 d/yr, respectively. Among them, the number of rainy days of moderate rain and the number of total rainy days showed a "hockey" phenomenon of "first rise and then fall". The rainfall of different intensities and number of rainy days in western China, Tibet and, southwestern, and southeastern regions mainly showed an increasing trend, and the rainfall and number of rainy days of heavy rains showed an increasing trend; in northern region, the rainfall and number of rainy days showed a declining trend; the rainfall in China is developing towards extremes.
(ii) In 1961-2015, the contribution of different intensity of rainfalls to total rainfall in China showed a different variation trend in fluctuations. In 1961-2015, the contribution of light rain to total rainfall showed a declining trend, with the trend value of -0.11%/yr. The contribution of moderate rain to total rainfall showed a slight declining trend. The contribution of heavy rain, torrential rain, downpour, and heavy downpour, and total torrential rain to total rainfall showed an increasing trend, with the trend values of 0.02%, 0.06%, 0.04%, 0.01% and 0.10%/yr, respectively. In 1961-2015, the contribution of light rain to the number of total rainy days showed a declining trend, with trend value of -0.11%/yr. The contribution of number of days of moderate rain, heavy rain, torrential rain, downpour, and heavy downpour and total torrential rain to the number of total rainy days showed an increasing trend in fluctuations, with the trend values of 0.08%, 0.02%, 0.01%, >0.01%, and >0%/yr, respectively. The contribution rate of different intensity of rainfalls to total rainfall was different in different regions of China, the contribution rate of heavy rainfall to total rainfall in most areas showed an increasing trend.
(iii) In 1961-2015, the torrential rain in China was developing towards extremes. In 1961-2015, the contribution of torrential rain to total torrential rainfall showed a declining trend, with trend value of -0.06%/yr. The contribution of downpour and heavy downpour to the total torrential rainfall showed an increasing trend in the fluctuations, with trend values of 0.05% and 0.01%/yr, respectively. In 1961-2015, the contribution of number of torrential rainy days to the number of total torrential rainy days showed a declining trend, with trend value of -0.03%/yr. The contribution of downpour and heavy downpour to the number of total torrential rainy days showed an increasing trend in the fluctuations, with trend values of 0.03% and >0%/yr, respectively, In most regions of China, the contribution rate of high intensity torrential rainfall to total torrential rainfall showed an increasing trend.
4.2 Discussions and prospects
4.2.1Discussions on the three attributes of rainfall events. Rainfall, rainy days and rain intensity are three essential and inseparable attributes of rainfall events. These three attributes contain important information on the occurrence and development of rainfall. Through in-depth study of these three attributes, it is helpful for enhancing the understanding of the rainfall and its physical mechanisms and climate background. From the holistic perspective, rainfall, rainy days and rain intensity of rainfall events do not exist independently of each other. If these three are separated and analyzed independently, some important information about rainfall can be obtained, but such information is still based on the single feature of rainfall, frequency or intensity, and only contains information on one attribute of the rainfall event, instead of containing the overall information of the rainfall event, thus it is impossible to comprehensively grasp the characteristics of the variation of rainfall. If there is no significant change in rainfall in a certain region, but the intensity of rainfall increases and the frequency of extreme rainfall increases, then possibility of flooding will increase. Therefore, it is necessary to systematically study the variation of characteristics of at least two attributes of rainfall, such as rainy day and rain intensity for different intensity rainfall events.
4.2.2Determination and impact diagnosis of different rainfall patterns. Rainfall includes process rainfall, convective rainfall and topographic rainfall. Process rainfall includes rainfall resulted from typhoon and other cyclones and weather processes[10]. Taking cyclone rainfall as an example, most regions of China are situated in the temperate zone, which belongs to the north-south airflow intersection area, and the cyclone rainfall is extremely developed. The proportion of cyclone rainfall in all regions is greater than 60%; in central China and north China, it even exceeds 80%; in the northwestern region, it is still up to 70%. Most of the cyclones in China occur in the east of the plateaus. In the north, there are Mongolian cyclones, northeastern low pressure and the Yellow River cyclone. After the cyclone is formed, it generally moves towards northeast to the sea. The famous plum rain in the south of Yangtze River is caused by the exchange of polar air masses and tropical marine air masses in June and July. Convective torrential rain is not only affected by natural factors, but also by local strong human activities and urbanization processes[20]. Different rain patterns characterize different rainfall processes, and the underlying physical processes and genetic mechanisms are also different. Therefore, the determination of different rain patterns in rainfall research is of great significance for studying the different intensity of rainfall and its contribution to total rainfall.
4.2.3Study on natural and human factors of different intensity rainfall variation trends and fluctuation characteristics. With the extending of the influence of human activities in the breadth, intensity and depth, the specific rainfall process is increasingly affected by both natural factors and human activities[3-4]. Therefore, it is necessary to focus on the effects of natural factors and human activities on different intensity of rainfalls, especially the relative contribution of natural factors and human activities to variation of different intensity of rainfalls. Different rain patterns show different trends. Through this study, we found that the rainfall of light rain is declining, while the rainfall of heavy rain and torrential rain is increasing significantly. What are the factors that affect different patterns of rainfall? Which rain patterns are significantly affected by natural factors? Which rain patterns are significantly affected by human factors? As to the long-term low-frequency trend and short-term high-frequency fluctuation characteristics of different intensity of rainfalls, what factors affect the two characteristics of different intensity of rainfalls on different time and spatial scale? These problems are not only one of the important topics in the regional rainfall research, but also one of the main aspects of regional climate zoning and impact research.
4.2.4Multi-data, multi-method and multi-scale diagnosis of contribution of different intensity of rainfalls. Almost all changes in climatic factors show multiple levels of evolution, so it is important to study the variation characteristics of climatic elements in a multi-scale manner[22]. Rainfall activity has significant interdecadal, interannual, seasonal, and intraseasonal oscillations[26]. It is still necessary to conduct in-depth and systematic research on a multi-scale. The existing rainfall research has achieved some results to some extent, but it has not reached the consensus of the academic circle. It is still necessary to use multiple resolutions of rainfall data from different sources to diagnose trends and fluctuations in different intensity of rainfall using international and domestic methods. In particular, the diagnosis of the contribution rate of rainfall with different intensities to total rainfall can reflect the dynamic variation characteristics of regional rainfall patterns. Therefore, it is necessary to establish rainfall scale and spatio-temporal variation data platforms of different scales, including multi-scale statistical models and multi-scale climate models to evaluate the impact of variation of different intensity rainfalls in China on regional climate change, ecosystems and human settlements, so as to provide a scientific basis for flood disaster prevention, water resources management and ecological environment management.
杂志排行
Asian Agricultural Research的其它文章
- Difference of Regional Benefits after Linking Newly-added Cropland Quotas with Amount of Land Used for Construction Based on Targeted Poverty Alleviation: A Case Study of Xinjiang
- Study on the Poverty Alleviation Model of Internet+Agricultural Industry: Taking Anhua Dark Tea Industry as an Example
- Ecological Compensation-assisted Relocation in Extreme Poverty-stricken Counties in China’s Ecologically Vulnerable Areas: Taking Dongchuan District of Yunnan Province as an Example
- Outdoor Domestication Cultivation and Survival Mechanism for Tissue Culture Seedlings of Paeonia suffruticosa
- Inhibition Effects of Salvianolic Acid M and Rosmarinic Acid in Salvia deserta Schang on Human Aldose Reductase
- Effects of Microbial Pesticides on Prevention and Control of Cucumber Downy Mildew
