Effect of Austenite Stability on Work-hardening Behavior of QLT-processed 9Ni Steels
2019-09-12,,,
, , ,
(State Key Lab of Metal Matrix Composites, School of Materials Science and Engineering, Shanghai Jiao Tong University, Shanghai 200240, China)
【Abstract】 Considerable amount of reversed austenite (RA) was obtained on a 9Ni steel by quenching, lamellaring and tempering treatment. In order to investigate the effects of RA on deformation behaviors, three kinds of tensile tests was designated, i.e. room temperature test (RT), immersed in liquid nitrogen and then room temperature test (LRT), and liquid nitrogen temperature test (LT). The stability of RA was analyzed by in-situ electron back-scattered diffraction and the volume fraction of RA was measured by saturation magnetization. The differential Crussard-Jaoul analysis was used to correlate RA stability with work-hardening behaviors of the steel. It is proved that the great combination of strength and ductility of the 9Ni steel is attributed to the sustained and considerable amount of RA transformation at cryogenic temperature.
【Key words】 QLT treatment; 9% Ni steel; work-hardening behavior; differential Crussard-Jaoul analysis
1 Introduction
The transportation or storage of liquefied natural gas (LNG) calls for the demand of structural materials which can maintain excellent mechanical properties at cryogenic temperature[1]. 9Ni (9% Ni) steels are widely used in these LNG projects. An elaborate heat treatment process consisting of direct quenching, larmellarizing and tempering (QLT) is developed for the steel[2]. The larmellarizing step which means relatively low temperature intercritical (α+γ) quenching is aimed to allow the formation of reversed austenite (RA).
The presence of RA is generally considered-responsible for the excellent cryogenic mechanical properties[1, 3]. The explanation usually comes from three aspects: effective grain refinement, carbides retardation[2,4-5]by the precipitation of RA, and the transformation-induced plasticity (TRIP) effect during deformation[6]. Moreover, RA stability with the associated TRIP effect is the main factor for the work hardening behavior. Generally, the RA stability can be classified as thermal stability and mechanical stability. The thermal stability is mainly related to the composition and morphology of austenite[7]. Experiments showed that the RA obtained from QLT process can retain even after quenched at liquid nitrogen[5,8], which is attributed to the RA absorption of austenite stabilizing elements during the QLT process, e.g. C, Ni, Mn. As for mechanical stability, it is determined by the stress state as well as its thermal stablity[3, 7]. Despite the very high RA thermal stability in QLT-processed 9Ni steels, RA still can transform to martensite during deformation especially at cryogenic temperature.
Recently, the workon QLT-processed 9Ni steels is mainly focused on probing the optimal heat treatment parameters[1,4,9]. However, how the RA stability affects mechanical properties still needs discussion. In this work, the differential Crussard-Jaoul analysis[10-12](denoted as DC-Jafterwards) is adopted to analyze the work-hardening behavior of the 9Ni steels in combination with RA transformation results. The RA thermal stability is assessed by in-situ electron back-scattered diffraction (EBSD) analysis and the RA volume fraction change during deformation is quantified by saturation magnetization method.
2 Experimental Procedure
Thechemical composition of the studied 9Ni steel is listed in table 1. Tensile test specimen with the thickness of 1.2mm and gauge size of 5mm×16mm were machined from the as-received steel plate along the rolling direction and then for the QLT heat treatment (shown in Fig.1). The abbreviation “WQ” and “FC” in Fig.1 means water quenching and furnace cooling. The A1(austenite-perlite transfor-mation temperature) and A3(austenite-ferrite transfor-mation temperature) temperature shown in Fig.1 was measured by thermal expansion experi-ment. The heat treatment parameters were selected to retain a considerable amount of RA. After etching with 4% nital solution, microstructures were characterized by optical microscopy (OM) and scanning electron microscope (SEM). The EBSD analysis was also conducted to characterize microstructure and depict thermal stability of RA. The step size for EBSD is 100nm.

Table 1 Chemical composition in weight percent (wt.%) of the 9Ni steel

Fig.1 Schematic representation of the QLT heat treatment with selected parameters. A1 and A3 temperature are measured by thermal expansion experiment. The abbreviation “WQ” and “FC” mean water quenching and furnace cooling
Tensile specimens were tested by a Zwick universal testing machine (BTC-T1-FR020 TN.A50) with a strain rate of 0.5 mm/min. In order to understand the contributions of RA to the mechanical properties of 9Ni steel under cryogenic temperature, three kinds of conditions were designed for the tensile tests:tested always at room temperature (RT), immersed in liquid nitrogen for 20 minutes and then tested at room temperature (LRT) and tested always at liquid nitrogen temperature (LT). The LRT sample was designated to ensure all the thermally unstable RA had transformed before tensile test. The volume fraction of RA before and after tension were quantified via saturation magnetization measurements (PPMS-9T (EC-II)).
3 Experimental results
3.1 Microstructure of 9Ni steel
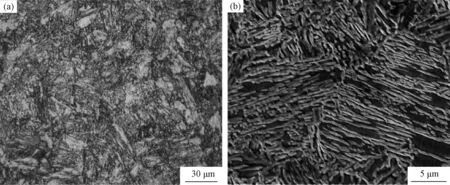
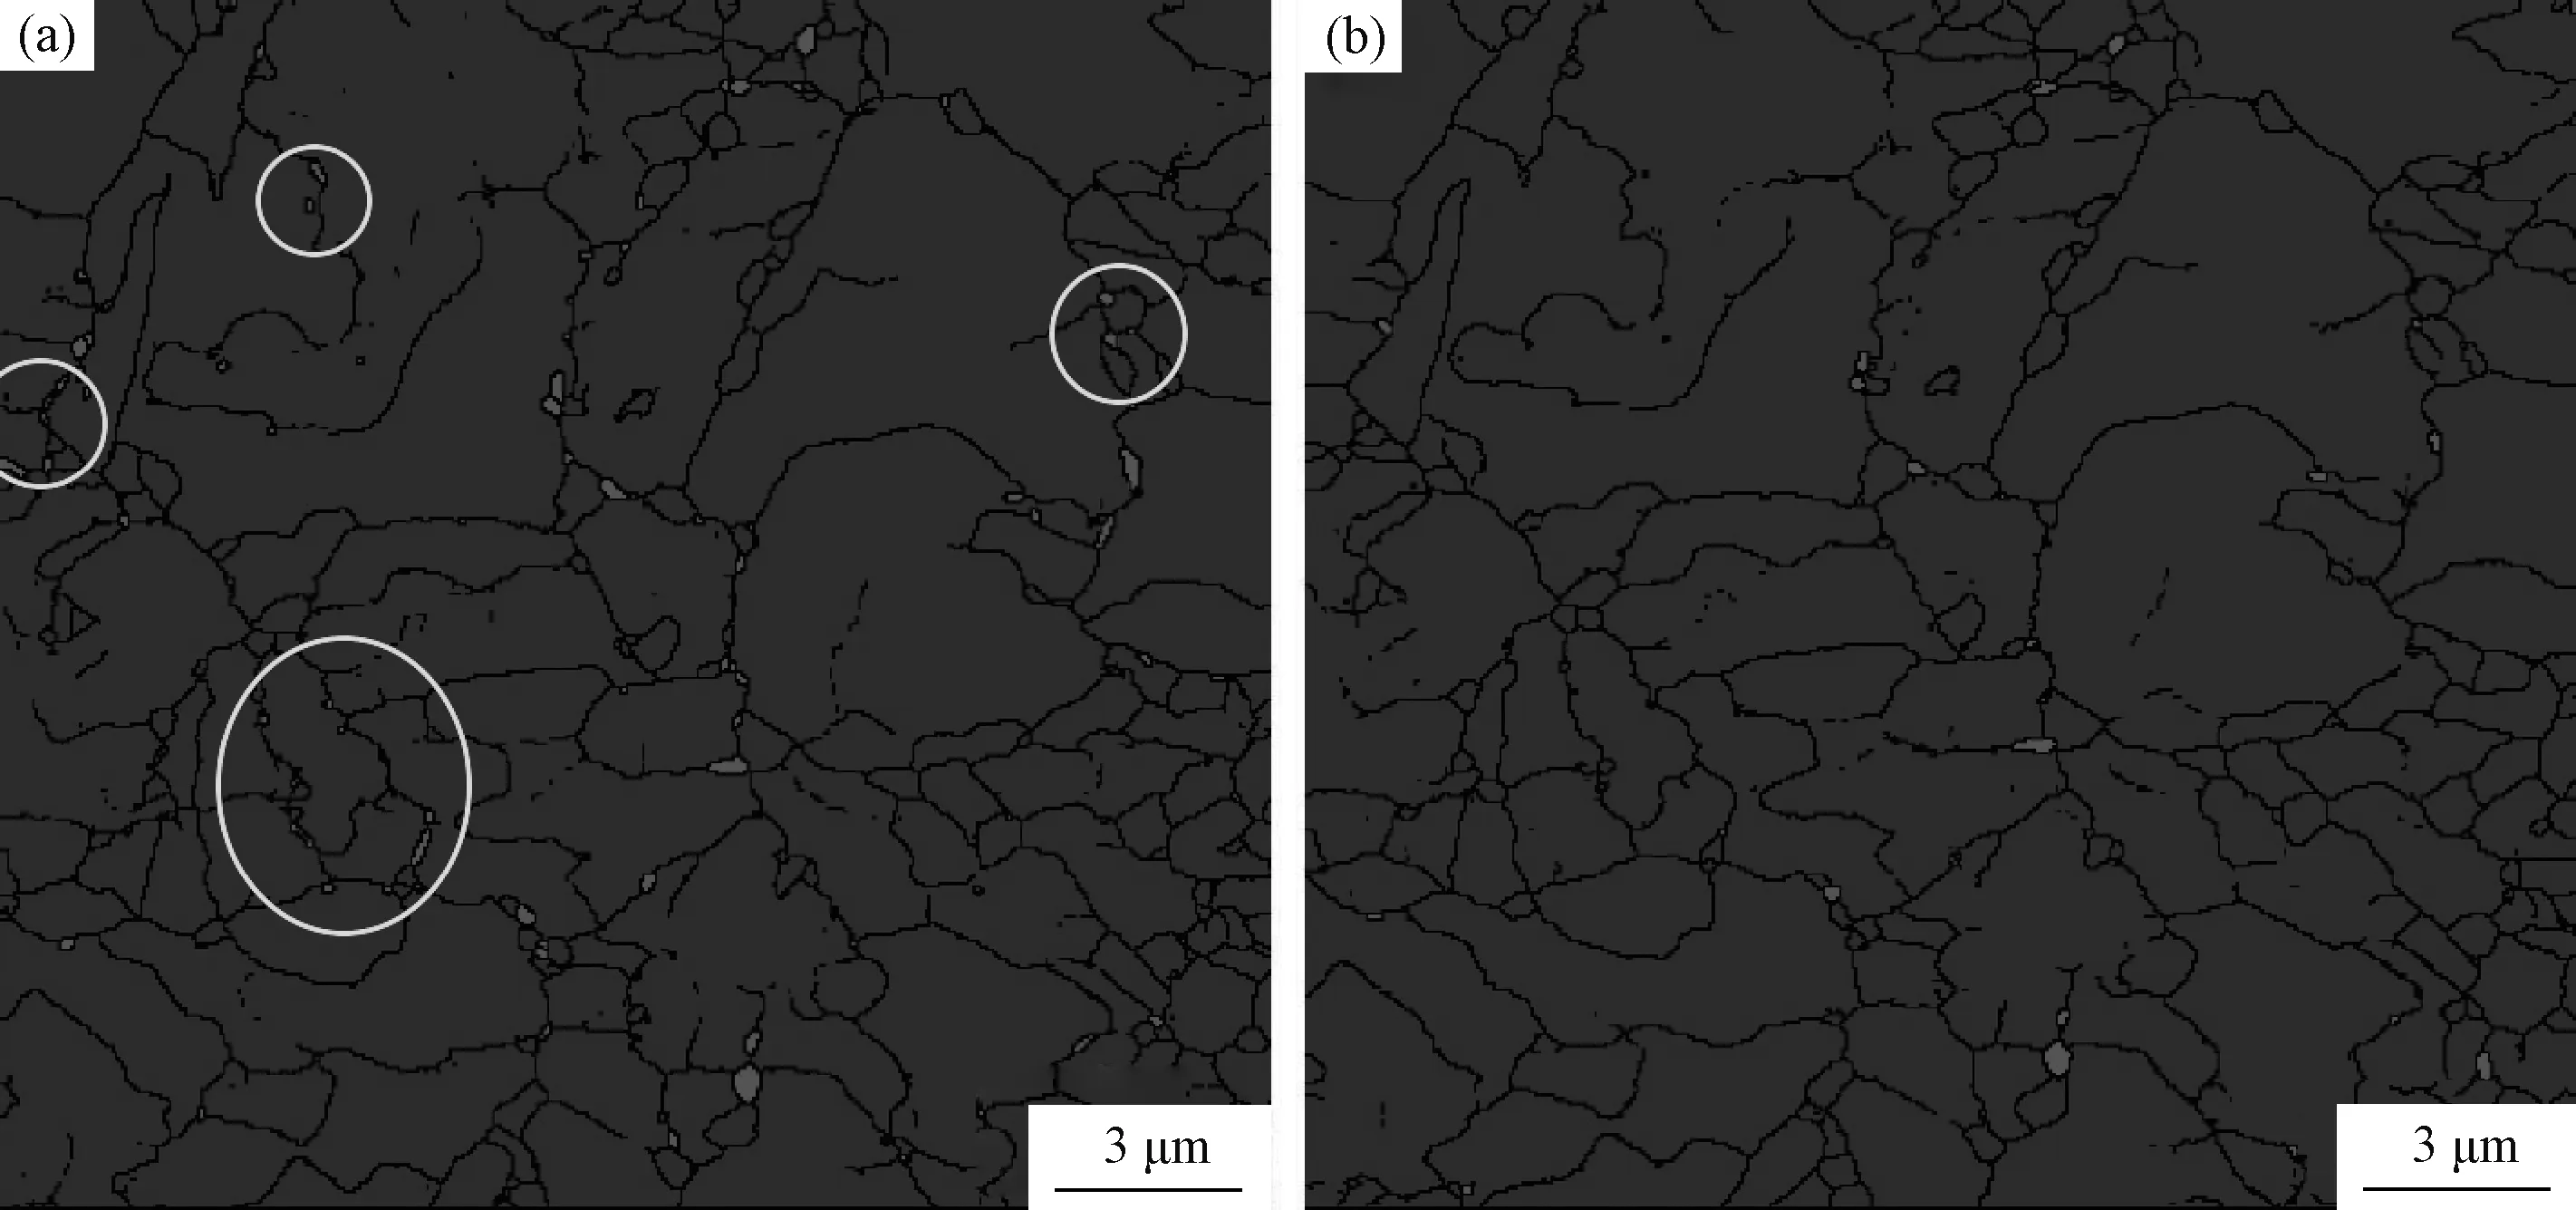
Fig.2 shows the OM and SEM images of the QLT-treated 9Ni steel. From the optical microscopy (Fig.2(a)) it can be seen that the lamellar microstructure consists of mainly tempered martensite and needle-like pro-eutectoid ferrite. The alternate bright and dark lath of martensite presented in Fig.2(b) is considered due to the heterogeneous distribution of alloying elements[1]. The RA is difficult to be identified with a low magnification. Fig.3(a) shows the EBSD map of the QLT-treated 9Ni steel at room temperature. It is reported that generally the RA in QLT-treated high nickel steel precipitates either at prior austenite grain boundaries in granular shape or along martensite laths in film-like morphology[13-14]. The RA (red phase) shown in these EBSD all exhibit a granular shape and the grain size is below 0.6μm. However, the film-shaped austenite has not been found here, which is due to the EBSD step size limitation.

Fig.2 Microstructures the 9Ni steel after QLT treatment (a) OM; (b) SEM

Fig.3 EBSD pictures show the same zone of QLT-treated microstructure, FCC-structured RA is denoted in red while BCC-structured matrix is in blue (a) without cryogenic treatment; (b) after quenched in liquid nitrogen for 20 minutes
Thermal stability of RA can be qualitatively analyzed by the EBSD pictures. Fig.3(b) shows the microstructure of the same sample in Fig.3(a) but suffered a cryogenic treatment (in liquid nitriogen for 20 minutes). It can be seen that the RA which is circled in yellow in Fig.3(a) has transformed to martensite after the cryogenic treatment. It can be deduced that the thermal transformation is independent of RA grain size, which is different from RA mechanical stability, i.e. generally the smaller the grain size, the higher the mechanical stability will be[12].
3.2 Mechanical properties
The engineering stress-strain curves of RT, LRT and LT samples under uniaxial tensile test are shown in Fig.4(a). It can be seen that there exhibits a yielding platform in all three curves and the RT and LRT curves almost coincide. With decreasing tensile temperature to LT, the QLT-treated 9Ni steel shows a remarkable improvement of strength and plasticity. The ultimate tensile strength (UTS) and uniform elongation (UEL) of LT test are almost 2 times of those of RT test. All mechanical properties of the three tests including the yield strength (YS) and total elongation (TL) are listed in table 2.

Table 2 Summary of mechanical properties of three tests
Fig.4(b) presents the corresponding relationship of work-hardening rate (dσT/dεT) versus true strain εT. Part of the true stress-strain curves are also presented in dash line for better understanding of the deformation behavior. Fig.4(b) shows that after yield point elongation, the LT specimen has a higher work-hardening rate level than those of RT and LRT. Generally, the intersection of true stress curve and work-hardening rate curve is considered as UEL[6]. The deformation instability always starts from UEL point[14], which is accompanied with the accelerated drop of work-hardening rate after UEL. During the uniform deformation stage, the LT test almost maintain a high work-hardening rate until UEL, while RT and LRT tests show a linear decline of work hardening rate until UEL. The common serration phenomenon of work hardening rate curves in TRIP-assisted steels also appears herein, and the fluctuation extent of LT is greater than those of RT and LRT. One explanation of the serration is due to the discontinuous TRIP effect[15].

Fig.4 Mechanical properties of three samples (a) engineering stress-strain curves; (b) work-hardening rate versus true strain relationship, part of true stress-strain curves is presented in dash line
3.3 RA volume change
Fig.5 shows the change of RA volume fraction before and after the three tensile tests. The RA transformation ratio is only 5.2% when the QLT-processed 9Ni steel are quenched to LNT, which implies that the RA obtained after QLT process has a high thermal stability. In the case of LT test, it actually underwent a cryogenic treatment before tensile test because it takes about 10 minutes to cool the specimen to liquid nitrogen temperature. Therefore, the initial RA volume fraction of both LRT test and LT test can be set as the same. After tensile tests, RA volume fraction reduction of LT test is significantly larger than RT and LRT test, where mechanical induced RA transformation ratio in RT and LT sample is around 25% and 77%, respectively.

Fig.5 Changes of RA volume fraction before and after tensile tests
3.4 Fractographs
Tensile fractographsof RT and LT specimen are shown in Fig.6. The fracture surface of RT test (Fig.6(a)) is characterized by equiaxed dimples with various sizes. Dimple is the typical feature of ductile fracture and its formation is usually considered due to void-nucleating particles[4]. Fracture morphology of LT presented in Fig.6(b) shows a mixture of brittle and ductile fracture type. The bright small facets indicates the brittle cleavage fracture while the red arrow in Fig.6(b) represents the dimple. Therefore, the LT sample can maintain some ductile fracture mode even at 77K, which leads to good cryogenic strength-ductility combination.

Fig.6 Fractographs of the tensile specimen (a) RT; (b) LT, the arrow shows the dimple
4 Discussion
It is believed that the TRIP effect plays a significant role in 9Ni steel especially with a considerable amount of RA[6]. The TRIP effect is closely associated with RA stability and the RA stability can be grouped into thermal and mechanical stability. The deformation behavior of the 9Ni steel is also discussed by the DC-Jtechnique in combination with RA transformation results[16-20].
4.1 RA stability
The thermal stability of RA in high nickel steels is well discussed by Fultz et.al[8, 21-22]. During tempering stage, austenite stabilizing elements, e.g. C, Mn and Ni will segregate out of the matrix to the precipitated RA. Due to a high diffusion rate, carbon diffusion is considered to reach the equilibrium for 1 hour of tempering at 500℃. For the maximum estimation, carbon concentration in RA can only reach the weight percent of 0.27wt% due to mass conservation law. The diffusion efficiency of elements with larger atomic size are lower and the mean diffusion length of Ni in α-iron after 1 hour tempering at 600℃ was reported only 1μm[5]. Therefore, to make an exaggerating estimation that the Ni and Mn concentration in RA is 3 times of the matrix, the calculation of Ni and Mn composition in RA is 25.6 wt.% and 1.5 wt.%, respectively. The interpretation of martensite transformation temperature Ms in terms of chemical composition is given by the following equation:
MS=834-474WC-33WMn-17WNi
(1)
WhereWxis the weight percent of element X and theMSis in Kelvin. Consequently, the minimum estimation ofMSof RA is 221K. However, RA change ratio after cryogenic treatment (77K) is only 5.2% (from 13.5% to 12.8%). Therefore, the thermal stability improvement of RA in 9Ni steel is ascribed not only to the chemical composition but also to the energy required to accommodate the transformation strain from FCC to BCC[8, 22].
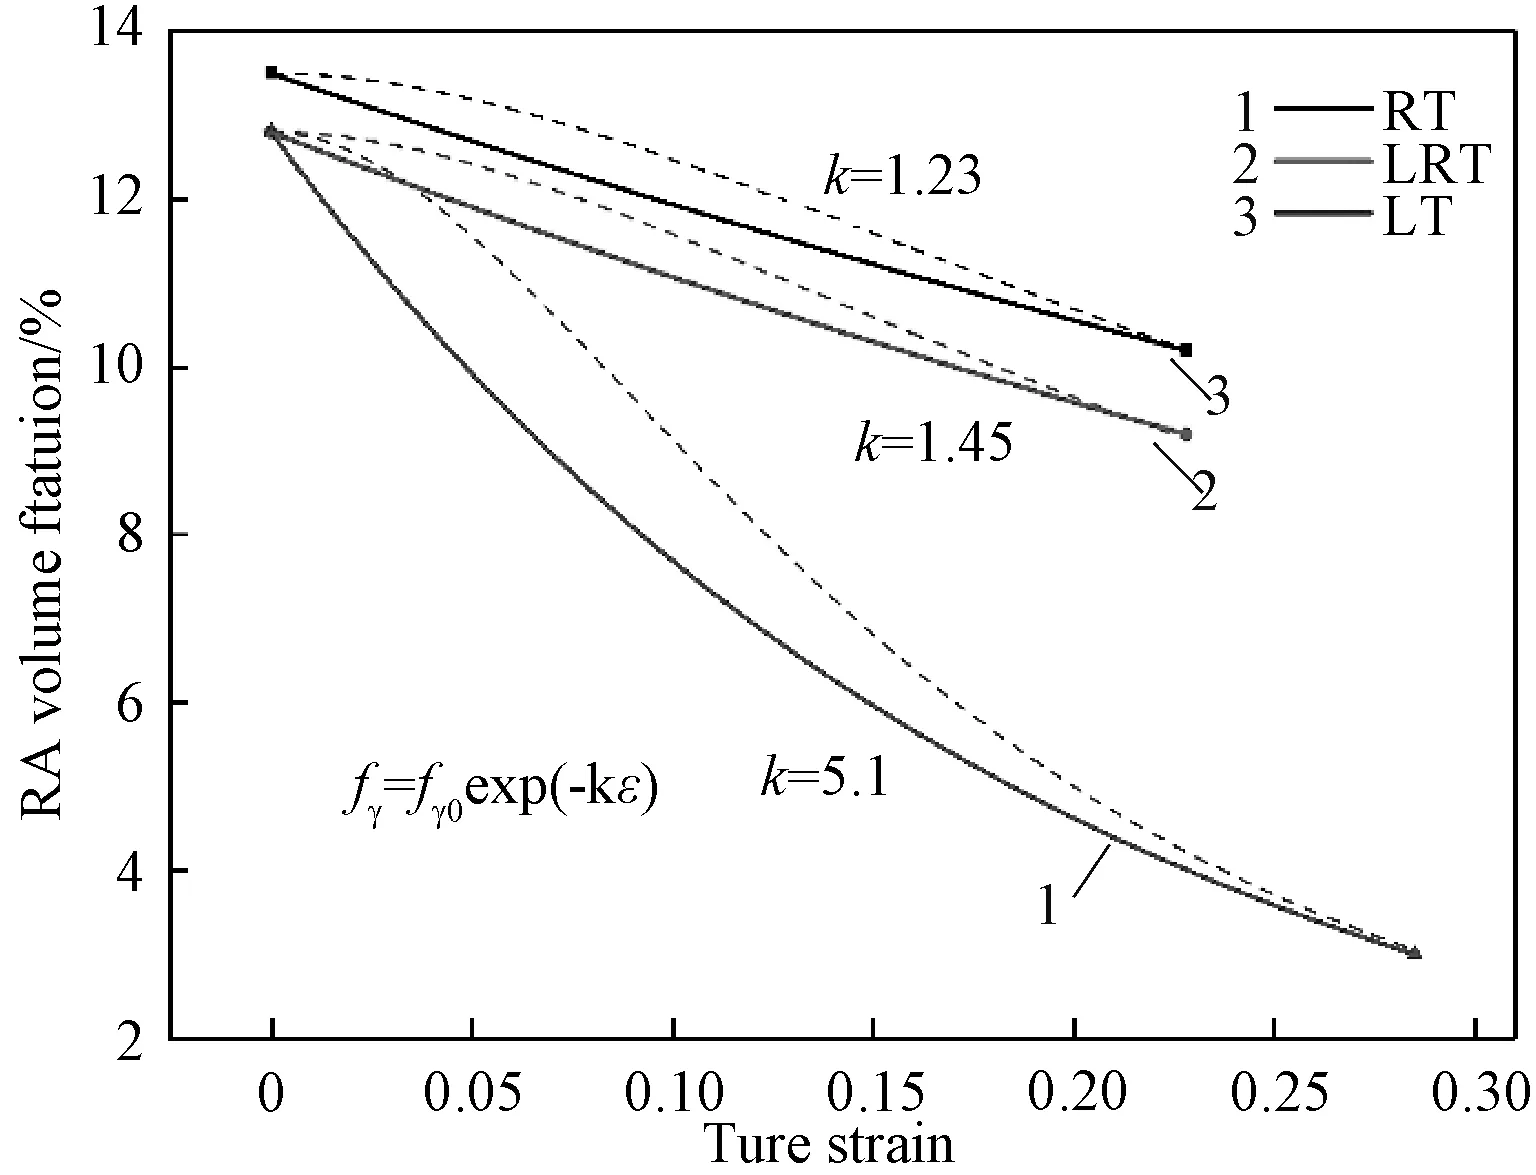
The mechanical stability of RA is usually described bythe relationship of RA transformation versus plastic strain. An exponential function is used to quantify the relationship[15]:
fγ=fγ0exp(-kε)
(2)
wherefγandfγ0are the austenite fraction at strain ε and the initial austenite fraction, respectively,kis the index of RA stability and the larger k suggests lower stability. The relationship curves are depicted in Fig.7 and the generally reported sigmoid[23]curves are also fitted with dash lines. It can be seen that the LT sample has the highest k value hence the lowest mechanical stability. It is evident that temperature decreasing can lower the critical energy for RA transformation.

Fig.7 Plot of RA reduction versus true strain relationship depicted by the exponential function
4.2 Deformation behavior analyzed by the DC-J technique
Under cryogenic temperature,a higher strength is always observed accompanied by a lower ductility. However both the strength and ductility increase greatly in the QLT-processed 9Ni steel. This phenomenon is mainly attributed to the remarkable TRIP effect under cryogenic temperature. The transformation of RA to martensite can increase the work hardening ability of steels hence delay necking[6, 24]. The DC-Janalysis is widely adopted to correlate the microstructure with the multistage work-hardening behavior[10-11, 17-19].
The DC-Janalysis is based on the assumption that the true stress-strain relationship fits to the empirical Ludwik equation:
σ=σ0+mεn
(3)
Whereσ0and m are material constants and n is the work hardening exponent. Differentiation of equation (3) toεyields:
ln(dσ/dε)=ln(mn)+(n-1)lnε
(4)
where ln(dσ/dε) and lnεmeet the linear relationship with the slope K=n-1. After yield point elongation, the DC-Janalysis results are shown in Fig.8. The slopes and stage transition points denoted as engineering strain are shown in the figure.

Fig.8 DC-J analysis curves of three samples (a) RT; (b) LRT; (c) LT
The deformation behavior for RT and LRT samples can be separated as four stages as shown in Fig.6(a) and (b). After yield point elongation, there comes a steep slopefollowed by three declining stages. The slopes of stage Ⅱ and Ⅲ are larger than stage Ⅰ. It is worth noting the third transition point ε3of these three specimens all correspond well to UEL. Therefore the drastic decline of work-hardening rate in stage Ⅳ is attributed to plastic deformation instability. In stage Ⅰ, it is generally believed that work-hardening behavior is due to homogeneous deformation of soft ferrite[16-17]. As shown in Fig.2, the acicular ferrite has fine size and is surrounded by tempered martensite. The glide of dislocation in ferrite at the early deformation stage cause dislocation piling up at the boundaries. As discussed in twinning-induced plasticity steel[18]and TRIP-assisted steel[19], the increase of the DC-Janalysis slope usually results from strengthening factors such as mechanical twining and RA transformation to hard martensite. Therefore, the deflection of slope in stage Ⅱ is believed due to the TRIP effect. According to the similar analysis in DP steels[16, 17], deformation behavior in stage Ⅲ may be co-deformation of ferrite and martensite.
For the case of LT test, the deformation behavior can be divided into three stages. The first steep slope in room temperature tests disappears. The positive slope value in stage Ⅰ (KⅠ=0.38) yields the work-hardening exponent n greater than 1, which is hardly existed in tensile tests at room temperature. Under cryogenic temperature, evidently the critical energy for RA transformation decreases. The easy RA transformation at early deformation is the reason for vanishing of the first steep slope in RT and LRT tests. According to Fig.5, RA change ratio at LT tension is 76.6%. The significant TRIP effect compared to RT test contributes to the positive slope in stage Ⅰ. The strain interval of stage I in LT test is larger than that of stage Ⅱ in RT and LRT test. This phenomenon manifests that RA transformation occurs in a wide strain regime of LT test eventhough it is of lower stability. The sustained TRIP effect also results in almost constant work hardening rate until UEL in LT test, which leads to a good ductility even at the temperature of LNT[25].
5 Conclusion
The effects of RA to tensile properties of the QLT-processed 9 Ni steel is analyzed by the DC-Jtechnique. Based on experiments and analysis, the following conclusions can be drawn.
1.After QLT process with the selected heat treatment parameters, a comparable amount of RA (around 13 vol. %) has been obtained in the 9 Ni steel. Under LT tension, the steel presents an excellent combination of strength and ductility (UTS: 1091.7MPa and UEL: 22.5%).
2.The thermal and mechanical stability of RA under room temperature tests are very high, RA transformation ratio by cryogenic treatment and tensile test is only 5.2% and around 25%. For LT condition, 76.6% of RA has transformed after tensile test.
3.With the DC-Janalysis, deformation behavior of RT and LRT sample can be divided into 4 stages while 3 stages for LT sample. The longer strain interval and positive slope of stage I in LT sample is due to the sustained and significant TRIP effect under cryogenic temperature, which is also attributed to the high strength and good ductility of the 9 Ni steel.
