Using Urban Landscape Trajectories to Assess Fragmentation in Mountainous Coastal Areas: A Case Stud
2019-09-10FangjunLIAOXiaomingWANG
Fangjun LIAO Xiaoming WANG
Abstract Rapid urbanization in mountainous coastal areas causes dramatic changes in land use and land cover (LUCC) for their geographic location. To understand changes in landscape trajectories in such regions, we examined temporal and spatial changes in urban landscapes in Shenzhen, China, a city that has undergone rapid urbanization in recent decades, and investigated the drivers of landscape pattern evolution at different scales from LUCC data from 1985, 1995, 2005, and 2015. The results show that the landscape of Shenzhen has changed dramatically over the 30 years from 1985 to 2015. The proportion of forest area decreased from 50.81% to 37.81%, while the proportion of construction land increased from 17.83% to 48.28%. The changes in the landscape patterns in Shenzhen were driven mainly by human activity. This study is one of the first to assess landscape dynamics of the rapid urbanization from the angle of mountainous coastal area, which plays an important role in the land use and city regulation of the global coastal mountains.
Key words Mountainous coastal region; Urban landscape; Landscape trajectory; Fragmentation effect; Driving factors; Shenzhen
Orogenesis in coastal regions causes rapid uplift and erosion[1], resulting in coastal mountain ranges, island arcs, and complex mountain landscapes. Urbanization has been an important feature in human societies since the 20thcentury[2]. Coastal cities have advantages over inland cities because of, among other factors, their geographic location, access to natural resources[3]. As urbanization has intensified, mountain ranges that were previously continuous have been divided, farmland has been converted to builtup areas, and natural habitats have disappeared[4]. The spatial configurations of urban landscapes are increasingly illogical, and the number of ecological islands has increased, with environmental consequences such as decreased natural resources and biodiversity, increased environmental pollution, and modifications to the hydrological cycle, the combination of which has a marked impact on quality of life and compromises sustainable development[5]. Detailed investigations of the nature of change in landscape patterns during urbanization, and the factors that drive this change, form the basis for the logical organization and planning of urban spatial resources[6]and can support the sustainable development of city areas[7-8].
The spatial configurations of landscapes, which include the type, quantity, spatial distribution, and arrangement of landscape composition units, are normally described by landscape patterns[9-10]. Changes in landscapes over time are also referred to as landscape dynamic changes and include corresponding changes in landscape structure, function, and spatial patterns[11-13]. Temporal changes in landscape patterns have farreaching effects on the structure and function of ecosystems[14-16]. Consequently, they are the topic of many studies of landscape ecosystems[17]. Quantitative research into landscape patterns, including studies of landscape patterns and dynamic change, has gradually developed since the 1980s, owing in part to the availability of remote sensing data for different time periods[18-20].
Urban areas, which show the most rapid changes in surface landscapes, have been the subject of many recent studies of landscape pattern dynamics[21-23]. The importance of the various factors that drive the process of landscape evolution varies over different spatial scales[24-25]. Fragmentation refers to disturbances from natural or anthropogenic factors that increase the complexity of landscapes. In this process, the landscape changes from a single, homogeneous continuous whole to a complex, heterogeneous, discontinuous mosaic of patches[26-27]. Landscape fragmentation varies according to the structure, function, and ecological processes of landscapes[28]. Increased fragmentation of urban landscapes disrupts natural habitats, simplifies species composition, and changes energy flows and nutrient cycling, with consequences for the provision of services to urban ecosystems and the sustainable development of cities[5,29].
Shenzhen is a mountainous coastal city in China that has experienced rapid urbanization since economic reforms in the 1980s. Over a period of 30 years, villages and farmland have all but disappeared, and Shenzhen, once a fishing community, has been transformed into a highly urbanized modern city[30]. Many researchers have studied the landscape of Shenzhen[8,28,31-34]. To date, however, few studies have considered how landscape fragmentation has been influenced by the mountains along Shenzhens coast. In this study, using remote sensing and geographic information system (GIS) technologies, we examined changes in the spatial patterns of landscapes and landscape characteristics in Shenzhen over the 30 years from 1985 to 2015, based on analyses of classified remote sensing images and measurements of landscape patterns. We also use quantitative and qualitative methods to investigate the factors and mechanisms that drive changes in the evolution of landscape patterns at different scales.
Study Area and Study Method
Study area
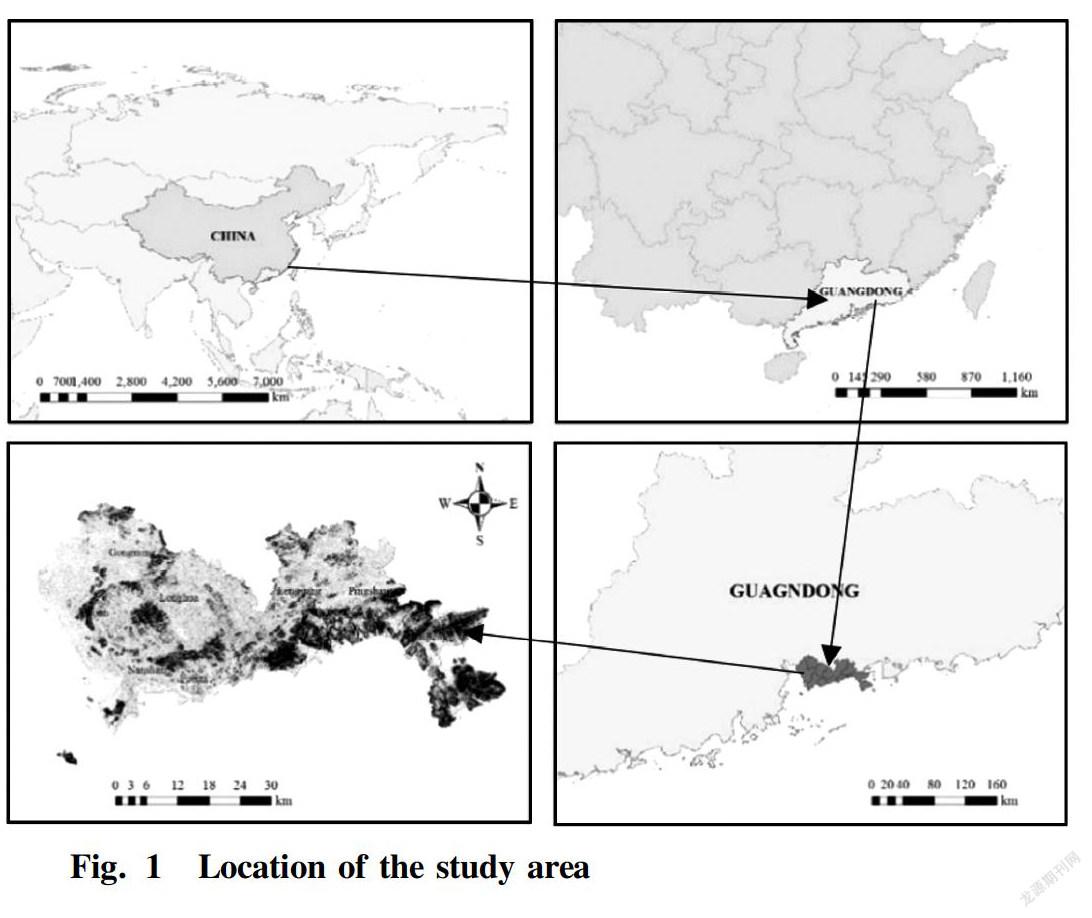
Shenzhen is located in the coastal area of southern China (113°45′44″–114°37′21″E, 22°26′59″–22°51′49″N), bordered by Daya Bay to the east, the mouth of the Pearl River Delta to the west, and Dongguan and Huizhou to the north. It is separated from the special administrative region of Hong Kong by the Shenzhen River (Fig. 1). Shenzhen is elongate eastwest and covers a total area of 1 952 km2. The landscape is variable, with areas of high elevation in the south and east, and lower areas in the north and west. Hills account for the largest proportion of the area of the city, followed by plains. Shenzhen has a South Asian tropical marine climate, an average annual temperature of 22.4 ℃, an average annual rainfall of 1 948 mm, and experiences frequent typhoons during summer[37]. Vegetation is dominated by tropical and subtropical flora.
Shenzhen was assigned city status in 1979 and a Special Economic Zone was established in 1980. The citys advantageous location, largescale industrialization, and urbanization have been the major drivers of economic development since the economic reforms of the 1980s. Over a 10year period from the mid1980s to the mid1990s, Shenzhen was rapidly transformed from a traditional rural area to a highly urbanized, cosmopolitan metropolis.
Study method
We used Landsat TM satellite images from 1985, 1995, 2005, and 2015 (satellite orbits path121/row44, path122/row44) as the main source of data for our study. We also used the most recent land use and topographic (ArcInfo format, 1∶50 000) maps of Shenzhen and data from field investigations.
Landscape remote sensing classification and interpretation
We classified the landscape using the method most commonly used in China[38]. We categorized the study area into eight land types: forest, swamp, farm, orchard, grassland, water, construction land, or unused land (Fig. 1). We preprocessed the images by radiometric calibration and geometric correction, and adopted the Landsat band reassembly method. By combining supervised classification and artificial visual interpretation methods within remote sensing image processing and GIS software, we generated information about the main landscape types for three different periods.
We investigated the evolution of landscape patterns from landscape pattern metrics calculated within ArcGIS and FRAGSTATS software. Used extensively in ecology, landscape pattern metrics condense information about landscape patterns and landscape dynamic changes, and provide insights into the composition, spatial configuration, and dynamic change processes in landscape patterns[39]. We quantified a range of landscape pattern metrics, including the percentage of each landscape type, patch density, mean patch area, largest patch index, and mean Euclidean nearest neighbor distance using FRAGSTATS 3.4 and Excel. These commonly used and easytocalculate metrics are frequently used in landscape pattern analysis and are described in detail elsewhere[40-43].
Analysis of landscape trajectory and drivers
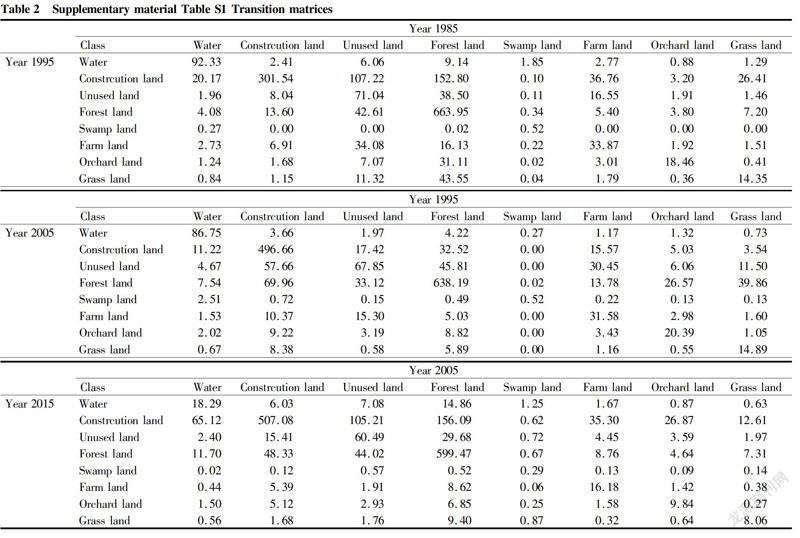
Landscape trajectories are generally determined from transition matrices in a twostep process[44]. We based the landscape trajectory on the remote sensing data from the four different years and employed three time periods: 1985–1995, 1995–2005, and 2005–2015. The landscape transition matrix (see the Appendix) analysis was carried out using IDRISI Selva software[45]. Landscape transition matrices show the transformed region and the areas that change from one landscape type to another in a given area.
The landscape trajectory can be classified as natural or humaninfluenced. A natural trajectory includes natural regeneration, natural succession, and expansion of natural cover on abandoned land. Humaninfluenced trajectories include, among others, urbanization, conversion of forests to farms, conversion of grasslands to farms or pastures, and conversion of pastures to farms. The function and structure of landscapes are generally changed irreversibly[46]. While natural and human factors have significant effects on the overall structure, spatial patterns, and patch characteristics of urban landscapes, the impacts of human activities are greatest[47]. Overall, the proportions of forest land and construction land showed the greatest change in Shenzhen. However, changes in these landscape types may have been restricted by natural ecological factors. Changes in the landscape trajectory were driven mainly by rapid economic growth and industrialization.
Results and Analysis
Landscape trajectory
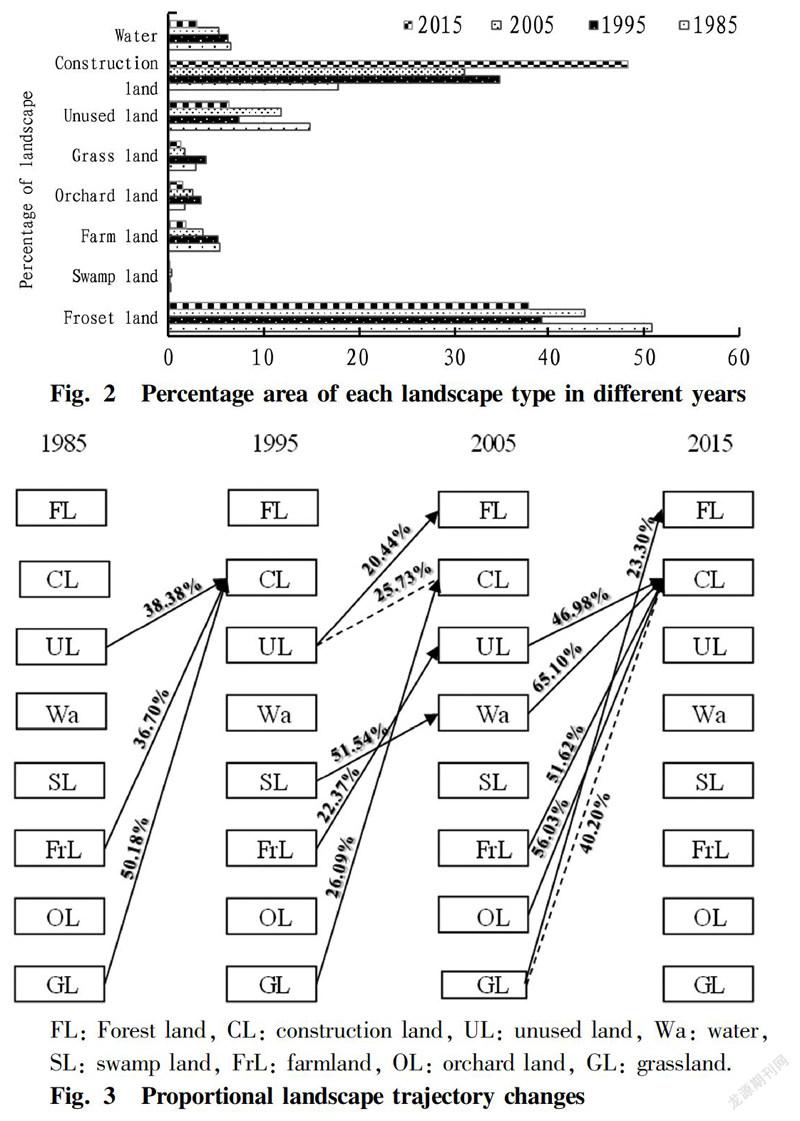
The percentage areas of landscape types changed by varying amounts over the study period (Fig. 2). The large increase in construction land and decreases in other land use types dominated the changes, with particularly large declines in the forest area. Land previously used for other purposes, especially forest land, was converted to construction land. There were monotonic decreasing trends in farmland (from 5.33% to 1.82%) and water (from 6.58% to 2.96%). The areas of other land use types showed fluctuating trends. Construction land increased sharply from 1985 until 1995 and from 2005 until 2015, but decreased only slightly from 1995 until 2005. Over the whole study period, it increased from 17.83% to 48.28% of the total land area, and was the landscape component that changed most. Changes in forest land contrasted with the changes in construction land. Forest land dominated urban landscapes in the early part of the study period but was gradually transferred to construction land because of urban expansion. The areas of other land use types followed a common pattern, showing an increased early in the study period, then a decreased in the middle part of the period, then an increase and finally a decrease, reflecting largescale construction in the early period, followed by excavation, expansion, merging, and gradual absorption into urban constructed land or other landuse types in the later period. Construction land dominated the entire landscape structure in the later part of the study period, followed by forest land.
The various landscape trajectories (Fig. 3) show that conversion of grassland (50.18%), unused land (38.38%), and farmland (37.60%) to construction land accounted for the greatest changes in landscape trajectory between 1985 and 1995. Between 1995 and 2005, the greatest changes were from swamp land to waterbodies (51.54%), grassland to construction land (26.09%), unused land to construction land (25.73%), unused land to forest land (20.44%), and from farmland to unused land (22.37%). Conversion of water bodies (65.10%), orchard land (56.03%), farmland (51.62%), unused land (46.98%), and grassland (40.2%) to construction land, and of grassland (23.3%) to forest land accounted for the greatest changes from 2005 to 2015.
Fragmentation trajectory of landscape levels
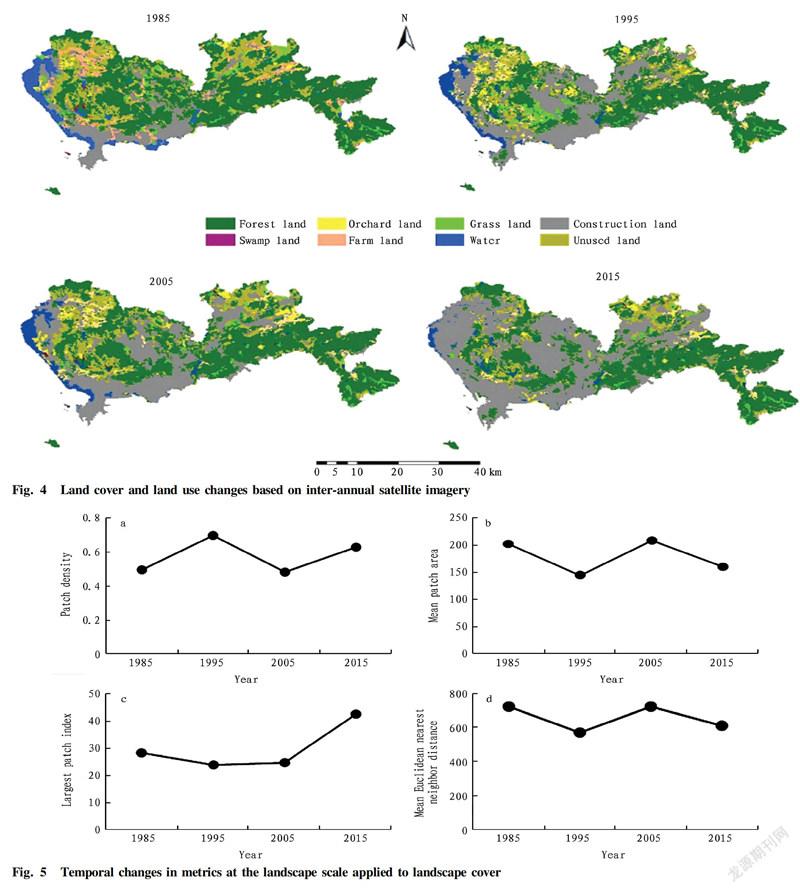
At the landscape scale, the landscape metrics initially fluctuated, but eventually showed obvious fragmentation. Over the 30year period from 1985 to 2015, the patch density first decreased, then increased, and then decreased again, with an overall increase of 21.04%. The average patch area increased, decreased, and then increased again, with a decrease of 21.04% from 2005 to 2015. The highest patch density increased by 33.48% from 2005 to 2015. The mean Euclidean nearest neighbor distance decreased, then increased, and then decreased again, with a decrease of 15.99% from 2005 to 2015.
Fragmentation trajectory of landscape types
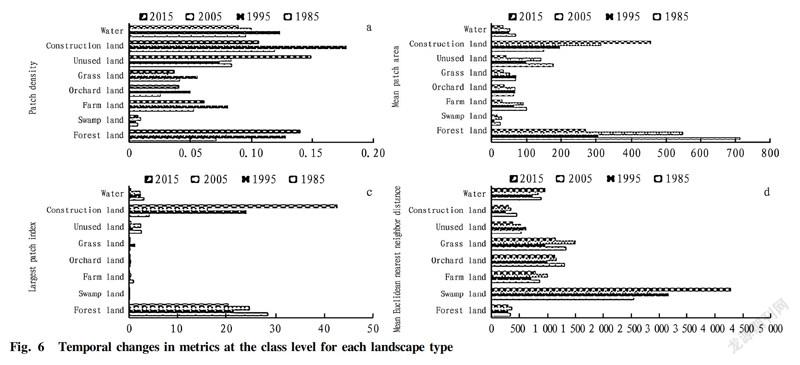
Over the study period, the landscape composition did not change, but the proportions of the different landscape types changed considerably. In addition, the increases and decreases in the areas of each landscape component varied over time. The patch density of the various landscape components (Fig. 6) also increased and decreased by different amounts over time. The changes were greatest in construction land, followed by forest land and unused land, and the increased density in construction land from 1985 to 1995 was much greater than the corresponding increases in the other landscape types. Forest land and unused land showed the greatest increases in patch density in 2015. The mean patch areas of forest land, construction land, and unused land changed most. The patch area of construction land trebled between the early and late parts of the study period. The change in the mean patch area of forest land fluctuated in the early part of the study period, but then decreased sharply in the later part, and was onethird of the area in the early study period. The mean patch area of unused land fluctuated. The change in the largest patch area was greatest for construction land, and the land use patch of unused land gradually decreased. The patch area and connectivity of forest land decreased, and, once the largest patch area, contrasted until it was much smaller than that of the construction land. The mean Euclidean nearest neighbor distance of landuse types fluctuated over time and changed least for forest land and construction land. The neighbor distance between swamp lands was large compared with other landscape types, and decreased gradually with time.
Discussion
Changes in land use and land cover, and their effects on the landscape
The changes described above reflect the dramatic changes in landscape patterns in Shenzhen over the 30 years from 1985 until 2015, since the economic reforms of the 1980s. While humaninfluenced landuse types grew significantly, natural landcover types contracted, causing a decrease in the natural purification and maintenance capacity of the ecological environment. Over the past three decades, the urban landscape trajectory has shown clear changes across the entire landscape structure of Shenzhen. Because of urban expansion and the construction of highways, large areas of forest land have been broken into smaller patches that were gradually absorbed by the city. Land use types such as water bodies and swamp lands originally accounted for relatively small proportions of all landscape types, but became separated into smaller plots with greater distances between them. Conversely, the surface area of construction land increased, and the fragmented patches of construction land expanded continually and finally merged, showing a tendency of spatial centralization. This eventually caused the average patch area to decrease, while the number of patches, the largest patch area, and the mean distance between patches decreased.
The composition of the different components showed similar changes. During the early part of the study period, shortly after the beginning of economic reforms, the area and density of construction land increased dramatically and accounted for a greater proportion of area than other land use types, which shows that changes in construction land had a strong influence on landscape ecology. Over time, the other landscape types became increasingly fragmented and decreased in area, and the natural elements of the landscape declined sharply, to the degree that Shenzhen is now a highly urbanized landscape where nature and culture are combined.
Factors driving trajectory changes
The evolution of urban landscape patterns reflects the influence of various drivers at different levels and scales. Previous studies have shown that the landscape of an entire city generally changes under policydriven landscape evolution. The natural drivers with the greatest influence on the urban landscape pattern are terrain and geomorphology.
With the development of the city, Shenzhen has endorsed a series of policies. In August 1980, Shenzhen was declared a Special Economic Zone[46], and the overall planning of its spatial structure was conducted within an emerging policy framework. The first policy, the Overall Plan of the Shenzhen Special Economic Zone, was prepared in 1982, under which singlecore cities were developed into multicenter cities. From the 1980s to the mid1990s, the first phase of the Overall Plan of the Shenzhen Special Economic Zone (1986–2000) was completed. The revised plan for the mid1990s to the early 21stcentury (1996–2010) was completed in 1996. In this plan, the Special Economic Zone was placed in the center, with developmental axes radiating from the west, center, and east as a basic skeleton. Two belts, to be developed in the south and north between 2010 and 2020, were added to the 2010 plan to form a "three axes, two belts" urban agglomeration.
With changes in population in response to these policies, the proportion of construction land area increased and the proportions of other landuse types decreased. Largescale land developments increased from 1992, and large tracts of land were developed irrationally and subsequently lay idle, so that the supply of development land in the later period was controlled by a policy to absorb current stock rather than increase its supply. Consequently, as villages become more affluent and industries develop in villages, urbanization levels increase and large areas of farmland are converted to industrial land to meet the need for land for infrastructure, industry, and housing.
In mountainous regions, topography and other natural ecological factors are important constraints on the proportions of, and changes in, landscape types. Shenzhen is characterized by mountains and peninsulas along its southeast coast (Fig.1). The main mountains of Shenzhen, consisting of low mountains and high hills, are in this southeast coast area. Historically, this region has been dominated by forest land, with relatively little change between landscape types. Various landscape types experienced great change in the central and western lowelevation and gentlysloping plain areas as urbanization intensified. The transfer matrix indicates that construction land increased mainly at the expense of cultivated land, with transfers mainly between garden land and construction land.
Spatial patterns in dynamic landscapes
The landscape and classlevel metrics confirm that spatial patterns were modified when the land cover changed. The landscapelevel metrics show that the degree of landscape fragmentation fluctuated with time. During the initial period of establishment in Shenzhen, with the ‘opening up’, human activity increased sharply, and the degree of fragmentation increased. The degree of fragmentation then eased in the middle part of the study period, only to increase again in the later part, reflecting expansion of the suburbs that have contributed to the growth of the main area of Shenzhen.
While the fragmentation indexes of various landscape components changed considerably over the study period, the changes were not random, but were consistent with policy, and reflect the largescale development of land. The transfer matrix shows that construction land was sourced mainly from farm land at the beginning of the study period, followed by grass land, and then wood land; and land for gardens was also sourced from wood land.
Class analysis shows that an increase in plaque numbers is associated with a reduction in the average plaque size, leading to debris and habitat loss (Echeverría et al., 2006). As agricultural land becomes increasingly fragmented, it is not conducive to intensive agriculture, meaning that the regulation function provided by the farm land ecosystem is directly weakened. Landscape connectivity decreases when wood land is divided by roads.
Conclusions
This study has shown that the landscape of Shenzhen has changed completely over the last 30 years. It has been transformed rapidly from an agricultural landscape into a developed modern city, facilitated by a large decrease in the area of forest land and a corresponding increase in construction land. The urban landscape pattern in Shenzhen has evolved in response to the combined effects and intensities of various factors. The main drivers of this landscape pattern evolution differed from the micro to macroscale, with natural ecological conditions imposing constraints on overall structural changes in the landscape, and policy changes being an important driver.
Acknowledgements
Special thanks are given to the Fairylake Botanical Garden, Shenzhen, for purchasing the digital data from the Institute of Geographic Sciences and Natural Resources Research, Chinese Academy Sciences.
References
[1] GENG W, ZHANG X, WEN Z, et al. A review on response of arccontinent collision in coastal range, eastern Taiwan Island[J]. Geological Review, 2013, 59: 129-136.
[2] PLATT RH, ROWNTREE RA, MUICK PC. The ecological city: Preserving and restoring urban biodiversity[M]. Massachusetts: University of Massachusetts Press, 1994.
[3] ZHOU C. Ten major advantages of coastal cities in China[J]. International trade, 1984, 10: 30-32. (in Chinese)
[4] NAGENDRA H, MUNROE DK, SOUTHWORTH J. From pattern to process: landscape fragmentation and the analysis of land use/land cover change[J]. Agriculture, Ecosystems & Environment, 2004, 101:111-115. (in Chinese)
[5] GRIMM NB, FAETH SH, GOLUBIEWSKI EN, et al. Global change and the ecology of cities[J]. Science, 2008, 319:756-760.
[6] LI W, WANG Y, PENG J, et al. Landscape spatial changes in Shenzhen and their driving factors[J]. Chinese Journal of Applied Ecology, 2004, 15:1403-1410. (in Chinese)
[7] WICKHAM JD, RIITTERS KH, WADE TG, et al. A national assessment of green infrastructure and change for the conterminous United States using morphological image processing[J]. Landscape and Urban Planning, 2010, 94: 186-195.
[8] LIU M, HU Y, ZHANG W, et al. Application of landuse change model in guiding regional planning: A case study in Huntaizi River Watershed, Northeast China[J]. Chinese Geographical Science, 2011, 21: 609-618. (in Chinese)
[9] FORMAN RTT. Land Mosaics: The Ecology of Landscapes and Regions[M]. Cambridge: Cambridge University Press, 1995.
[10] WU J. Landscape Ecology: Patter, Process, Scale[M]. Beijing: Higher Education Press, 2000. (in Chinese)
[11] BAI W, ZHANG Y, BAO W. Landscape patterns and dynamics in the upper reaches of the Dadu River[J]. Journal of Natural Resources, 2003, 18: 76-80. (in Chinese)
[12] HE X, ZHAO Y, HU Y, et al. Landscape Changes from 1974 to 1995 in the Upper Minjiang River Basin, China[J]. Pedosphere, 2006, 16: 398-405.
[13] LIU W, MA Y, HU H, et al. A quantitative analysis on the landscape pattern change in Menglun, Xishuangbanna, China[J]. Acta Ecological Sinica, 2006, 26: 3088-3097. (in Chinese)
[14] GUSTAFSON EJ. Quantifying landscape spatial pattern: What is the state of the art[J]. Ecosystem, 1998, 1:143-156.
[15] PARCERISAS L, MARULL J, PINO J, et al. Land use changes, landscape ecology and their socioeconomic driving forces in the Spanish Mediterranean coast (EI Maresme County, 1850-2005)[J]. Environmental Science & Policy, 2012, 23:120-132.
[16] LI M, ZHOU Z. Positive and negative ecosystem services evaluation and its spatial pattern analysis on urban landscape: A case study of Xian City[J]. Acta Geographica Sinica, 2016, 1: 1215-1230. (in Chinese)
[17] TURNER MG. Spatial and temporal analysis of landscape patterns[J]. Landscape Ecology, 1990, 4: 21-30.
[18] NAGAIKE T, KAMITANI T. Factors affecting changes in landscape diversity in rural areas of the Fagus crenata forest region of central Japan[J]. Landscape and Urban Planning, 1999, 43: 209-216.
[19] ZHOU Z. Landscape changes in a rural area in China[J]. Landscape and Urban Planning, 2000, 47: 33-38.
[20] CHANG Y, BU R, HU Y, et al. Dynamics of forest landscape boundary at Changbai Mountain[J]. Chinese Journal of Applied Ecology, 2004, 15:15-20. (in Chinese)
[21] CHEN C, HU F, ZHANG L. Landscape pattern of Nanjing urbanrural ecotone[J]. Chinese Journal of Applied Ecology, 2003, 14: 1363-1368. (in Chinese)
[22] PAN J, SU Y, HUANG Y, et al. Land use and landscape pattern change and its driving forces in Yumen City[J]. Geographical Research, 2012, 31: 1631-1639. (in Chinese)
[23] BAUS P, KOVA U, PAUDITOVB E, et al. Identification of interconnections between landscape pattern and urban dynamicsCase study Bratislava, Slovakia[J]. Ecological Indicators, 2014, 42: 104-111.
[24] ZENG H, GUO Q, YU H. Spatial analysis of artificial landscape transform in Fenggang Town, Dongguan City[J]. Acta Ecological Sinica, 1999, 19: 298-303. (in Chinese)
[25] SHI PJ, CHEN J, PAN Y. Land use change mechanism in Shenzhen City[J]. Acta Geographic Sinca, 2000, 55: 151-160.
[26] BENNETT AF, SAUNDERS DA. Habitat fragmentation and landscape change[M]. Oxford: University Press Oxford University Press, 1995.
[27] GULINCK H, WAGENDORP T. References for fragmentation analysis of the rural matrix in cultural landscapes[J]. Landscape Urban Planning, 2002, 58: 137-146.
[28] WU JG. Urban sustainability: an inevitable goal of landscape research[J]. Landscape Ecology, 2010, 25:1-4.
[29] IRWIN EG, BOCKSTAEL NE. The evolution of urban sprawl: Evidence of spatial heterogeneity and increasing land fragmentation[J]. Proceedings of the National Academy of Sciences of the United States of America, 2007, 104: 20672-20677.
[30] YE M, WANG Y, PENG J, et al. Land use efficiency and regional differentiation in Shenzhen City[J]. China Resources Science, 2008, 30:401-408. (in Chinese)
[31] WU J, ZENG H, LIU Y. Landscape ecological connectivity assessment of Shenzhen City[J]. Acta Ecologica Sinica, 2008, 28:1691-1701. (in Chinese)
[32] BU X, WANG Y, SHEN C, et al. Influence of landforms of on the land use dynamics in Shenzhen City[J]. Geographical Research, 2009, 28:1011-1021.
[33] LIU Z, WANG Y, PENG J, et al. Urban Water Landscape Fragmentation and the Change of Ecological Values in Shenzhen[J]. Acta Scientiarum Naturalium Universitatis Pekinensis, 2010, 46: 286-292.
[34] WU R, WEN X, ZHAO H, et al. Dynamic analysis and prediction of green space landscape based on the RS and GIS in Shenzhen special economic zone[J]. Journal of Beijing Forestry University, 2010, 32:42-47. (in Chinese)
[35] LIU Z, WANG Y, PENG J, et al. Using ISA to analyze the spatial pattern of urban land cover change: A case study in Shenzhen[J]. Acta Geographica Sinica, 2011, 66:961-971. (in Chinese)
[36] WU J, LIU H, HUANG X, et al. Dynamic evaluation on landscape connectivity of ecological land: A case study of Shenzhen, Guangdong Province of South China[J]. Chinese Journal of Applied Ecology, 2012, 23:2543-2549. (in Chinese)
[37] Shenzhen Land Resources. Urban Planning and Land Management Bureau of Shenzhen City[M]. Beijing: Dadi Publishing House of China, 1998.
[38] CHEN BM, ZHOU XP. Explanation of current land use condition classification for national standard of the Peoples Republic of China[J]. Journal of Natural Resources, 2007, 22: 994-1003.
[39] ZHANG J, QIU Y, ZHENG F. Quantitative methods in landscape pattern analysis[J]. Journal of Mountain Science, 2000, 18: 346-352.
[40] HARGIS CD, BISSONETTE JA, DAVID JL. The behavior of landscape metrics commonly used in the study of habitat fragmentation[J]. Landscape Ecology, 1998, 13:167-186.
[41] GUSTAFSON EJ, CROW TR. HARVEST: Linking timber harvesting strategies to landscape patterns[M]. Cambridge: Cambridge University Press, 1999.
[42] ZHENG XQ, FU MC. Spatial analysis technology of landscape pattern and its application[M]. Beijing: Science and Technology Press, 2010. (in Chinese)
[43] MCGARIGAL KS, CUSHMAN SA, NEEL MC, et al. FRAGSTATS: Spatial pattern analysis program for categorical maps, 2002.
[44] PONTIUS RG, SHUSAS E, MCEACHERN M. Detecting important categorical land changes while accounting for persistence[J]. Agriculture, Ecosystem Environment, 2004, 101:251-268. (in Chinese)
[45] EASTMAN JR. IDRISI Selva. Clark University, Worcester, MA, 2012.
[46] SONG X, YANG G, YAN C, et al. Driving forces behind land use and cover change in the QinghaiTibetan Plateau: a case study of the source region of the Yellow River, Qinghai Province, China[J]. Environmental Earth Sciences, 2009, 59:793-801.
[47] NUSSER M. Understanding cultural landscape transformation: A rephotographic survey in Chitral, eastern Hindukush, Pakistan[J]. Landscape Urban Planning, 2001, 57: 241-255.
[48] SHENZHEN MUSEUM. The History of Shenzhen Special Economic Zone[M]. Beijing: China Statistics Press, 1980.
Editor: Yingzhi GUANG Proofreader: Xinxiu ZHU
杂志排行

农业生物技术(英文版)的其它文章
- Copyright Authorization Statement
- Optimization of Enzymatic Extraction of Sodium Chondroitin Sulfate From Bovine Nasal Bone
- Quality Analysis of Lycium ruthenicum Murr. from Different Producing Areas
- Optimization of Extraction Process of Anthocyanins from Selenium-enriched Purple Potato by Response Surface Methodology
- Research on Extraction and Purification Technology of Flavonoids from Quinoa (Cheuopodium quinoa) Le
- Effect of Different Processing Techniques on the Content of Total Alkaloids in Toddalia asiatica Lam.