Optimization of Enzymatic Extraction of Sodium Chondroitin Sulfate From Bovine Nasal Bone
2019-09-10JinmaoTANShunliXIAOAnTANGaoyuanZOUShuanghuiWANGYihongHUYizhiZHUChenzhongJINNaWUYunyunZHOU
Jinmao TAN Shunli XIAO An TAN Gaoyuan ZOU Shuanghui WANG Yihong HU Yizhi ZHU Chenzhong JIN Na WU Yunyun ZHOU
Abstract Taking bovine nasal bone as a raw material, the sodium chondroitin sulfate was extracted by enzymolysision adsorptionalcohol precipitation method, and the enzymolysis process was optimized. After single factor experiments, the response surface analysis was performed by software DesignExpert 8.0, and the optimal enzymolysis conditions were as follows: the trypsin concentration of 0.8%, the pH value of 9.0, the enzymolysis temperature at 52 ℃, and the enzymolysis time of 2.0 h. With this combination of conditions, the concentration of sodium chondroitin sulfate extract reached 11.3 g/L, the bovine nasal bone yield was 35%, and the finished product content was 92.5%, which provided guidance for industrial production.
Key words Sodium chondroitin sulfate; Trypsin; Photometric titration; Response surface methodology
Chondroitin sulfate A and chondroitin sulfate are abundant in bovine nasal bone[1-5]. Chondroitin is covalently linked to protein and exists in the form of proteoglycan[6-8]. By enzymolysis, chondroitin sulfate is separated from protein and dissolved in water[9-10]. The degree and speed of enzymolysis are critical, and directly related to the quality, yield and production efficiency of sodium chondroitin sulfate[11-12]. Based on the technology of Hunan Wuxing Biotechnology Co., Ltd., and photometric titration detection of chondroitin sulfate in European Pharmacopoeia EP8.0, fresh bovine nasal bone was used as a raw material to optimize the enzymolysis step by the response surface methodology[13-14].
Materials and Methods
Instruments, materials and reagents
Materials and reagents
Bovine nasal bone, commercially available; trypsin (≥4 000 u/g), Sichuan Quan Xin Xiang Sheng Biopharmaceutical Co., Ltd.; sodium chondroitin sulfate, Sigma; cetylpyridinium chloride, Sinopharm Chemical Reagent BeijingCo., Ltd.
Instruments
Electronic analytical balance AL104 (1/10 000), METTLER TOLEDO; PHS3C laboratory PH meter, INESA Scientific Instrument Co., Ltd.; automatic titrator G20, METTLER TOLEDO; centrifuge L530, Hunan Xiangyi Laboratory Instrument Development Co., Ltd.
Methods
The process of preparing sodium chondroitin sulfate included the steps of bovine nasal bone cleaning, enzymolysis, filtration, cation column, filtration, oxidation, centrifugation, alcohol precipitation, dehydration and drying to obtain sodium chondroitin sulfate. The process flow comes from the production process of Hunan Wuxing Biotechnology Co., Ltd. This study focused on the optimization of enzymolysis through single factor experiments and response surface analysis.
Single factor experiments
Enzymolysis: The stock solution was adjusted to pH 8.5-9.5 with 2 mol/L hydrochloric acid solution, and trypsin was added for enzymolysis. According to the factors affecting the enzymatic reaction, the single factor experiments were carried out on the trypsin concentration, enzymolysis time, enzymolysis temperature and pH value during trypsin hydrolysis to determine the optimal conditions for single factors.
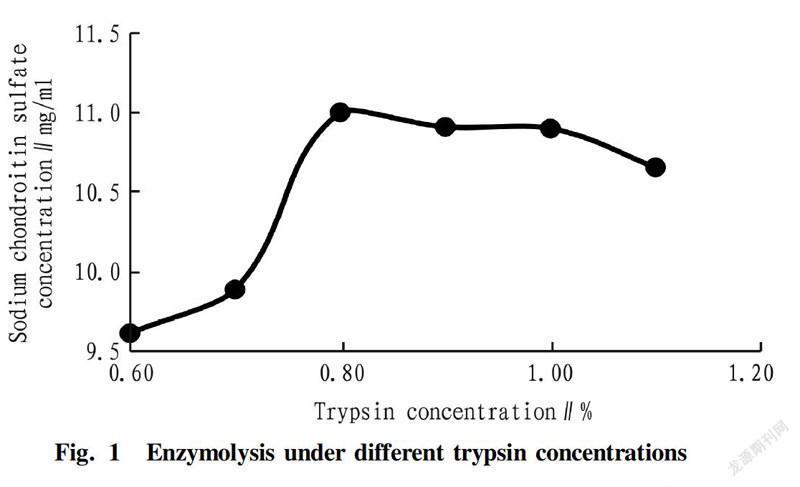
The experiment of trypsin concentration was carried out by setting the trypsin concentration to be 0.6%, 0.7%, 0.8%, 0.9%, 1.0% and 1.1% when fixing the enzymolysis time of 2 h, the enzymolysis temperature at 52 ℃ and the pH of 9.0. The effect of trypsin concentration on the concentration of sodium chondroitin sulfate is shown in Fig. 1.
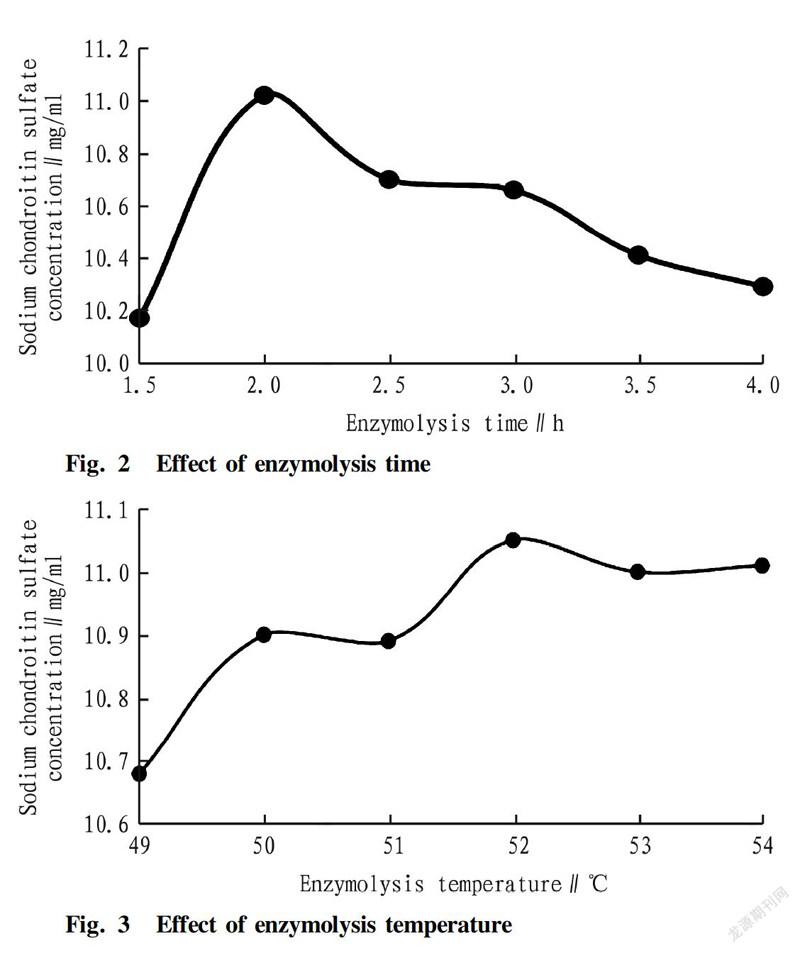
The effect of enzymolysis time on the purity of sodium chondroitin sulfate was investigated by performing enzymolysis for 1.5, 2.0, 2.5, 3.0, 3.5 and 4.0 h in the trypsin concentration of 0.8%at the enzymolysis temperature of 52 ℃ and the pH of 9.0, respectively. The effect is shown in Fig. 2.
The effect of enzymolysis temperature on the purity of sodium chondroitin sulfate was investigated by performing enzymolysis at 49, 50, 51, 52, 53 and 54 ℃ in the trypsin concentration of 0.8%for 2 h at the pH of 9.0. The effect is shown in Fig. 3.
Under the trypsin concentration of 0.8%, the enzymolysis time of 2 h and enzymolysis temperature of 46 ℃, the effect of pH on the purity of sodium chondroitin sulfate by setting the pH to be 8.5, 8.7, 8.9, 9.1, 9.3 and 9.5, respectively. The results are shown in Fig. 4.
Detection of sodium chondroitin sulfate concentration
According to the European Pharmacopoeia 8.0[6], the concentration of sodium chondroitin sulfate was calculated according to the standard titer by photometric titration. With hexadecylpyridinium chloride as a titration solution, titration was carried out by an automatic titrator at λ555 nm of a photometer.
Preparation of related solutions
Reference solution (a): The sodium chondroitin sulfate standard was prebaked to constant weight, dissolved in water and diluted to 100.0 ml. Test solution (a): The supernatant of the extract was filtered and centrifuged, and 5.00 ml was taken. Titration solution (a): A certain amount of hexadecylpyridinium chloride monohydrate (1.000 g) was diluted with water to 1 000 ml. Diluent: Certain amounts of potassium dihydrogen phosphate (297 mg), dipotassium hydrogen phosphate (492 mg) and Tween80 (polysorbate 80, 250 mg) were weighed into a 1 L beaker, dissolved in water to 1 000 ml, and adjusted to pH (7.0±0.2) with NaOH or H3PO4.
Preparation of standard curve
Standard control solution: Certain amounts of sodium chondroitin sulfate (Sigma) (0.06, 0.08, 0.10 and 0.12 g) were accurately weighed and dissolved in water to a volume of 100.0 ml, giving the 6, 8, 10 and 12 mg/ml standardsolutions, respectively. The concentration standard curve was then obtained (Fig. 5), giving the regression equation: y=0.153 7x+0.032 1, R2=1.
Determination of samples
A certain amount of the test solution (5.0 ml) was added into a titration beaker, into which 45 ml of the diluent was then added. The solution was photometrically titrated with an automatic titrator. The sodium chondroitin sulfate concentration in the sample was according to the standard curve.
Data processing
On the basis of the single factor experiments, fourfactor threelevel response surface analysis (five center points) was carried out. The experimental data obtained were subjected to multiple regression fitting using DesignExpert 8.0 software to determine the optimal conditions for enzymolysis[15-16].
Results and Analysis
The optimal conditions for enzymolysis were obtained by the single factor experiments as the trypsin concentration of 0.8%, the enzymolysis time of 2.0 h, the enzymolysis temperature at 52 ℃, and the pH of 9.1, and the corresponding sodium chondroitin sulfate concentration was 10.99, 11.02, 11.05 and 11.06 g/L, respectively.
The response surface method was used to optimize the factors affecting the concentration of sodium chondroitin sulfate in the enzymolysis and the interaction between the factors, that is, according to the BoxBenhnkens central composite design principle[4-5], a fourfactor threelevel experiment was carried out comprehensively on the basis of the results of the single factor experiments results by selecting the enzyme concentration, pH value, enzymolysis temperature and enzymolysis time as the four factors. The primary and secondary factors affecting the trypsin hydrolysis were analyzed by response surface methodology, and the optimal process conditions at this stage were obtained.
Based on the single factor experiments, the fourfactor and threelevel response surface analysis was carried out to determine the optimal conditions for the enzymolysis, and the experimental design and results are shown in Table 1 and Table 2, respectively.
The obtained experimental data were subjected to multiple regression fitting using DesignExpert 8.0 software to obtain a quadratic multiple regression equation of sodium chondroitin sulfate concentration to trypsin concentration, enzymolysis time, enzymolysis temperature and pH value. Sodium chondroitin sulfate (%)=11.26+0.08A+0.29B+0.10C-0.011D+0.16AB+0.27AC-0.13AD-0.000 9BC+0.11BD-0.004 6CD-0.42A2-1.09B2-1.43C2-0.17D2. The variance analysis of the regression model is shown in Table 3.
Variance analysis was performed to the regression model, and the model coefficients were tested for significance. As shown in table 3, the model P<0.000 1, indicated that the response regression model reached a very significant level; and the lack of fit P=0.337 4>0.05, which was not significant, indicated that the model had a good fitting degree and can be used for analysis and prediction of the enzymolysis. In addition, the P value can be used not only to test the significance of the model coefficients, but also to reflect the effects of variables and the interaction between variables. The smaller the P value, the more significant the effect. As can be seen from Table 3, the linear effects of trypsin concentration, enzymolysis time and enzymolysis temperature on the concentration of sodium chondroitin sulfate was significant (P<0.05), and the effect of pH on the concentration of sodium chondroitin sulfate was not significant. The interaction between trypsin concentration and enzymolysis temperature had a significant effect on the concentration of sodium chondroitin sulfate, while the interaction between trypsin concentration and pH value, pH value and enzymolysis temperature, pH and enzymolysis time, and enzymolysis temperature and enzymolysis time on sulfuric acid all had no significant effect on sodium chondroitin content.
Fig. 6 shows the response surface analysis of the interaction between trypsin concentration and enzymatic hydrolysis temperature. The response surface diagram is bellshaped, indicating that the interaction between trypsin concentration and enzymolysis temperature was significant.
The regression equation was solved by software DesignExpert 8.0, and the factors with the highest predicted value of sodium chondroitin sulfate were: the trypsin concentration of 0.85%, the pH at 8.98, enzymolysis temperature at 52.2 ℃, and the enzymolysis time of 2.20 h, with which the predicted sodium chondroitin sulfate was 11.3%. Considering the actual operation, the experimental conditions were corrected to the trypsin concentration of 0.8%, the pH of 9.0, the enzymolysis temperature at 52 ℃ and the enzymolysis time of 2.0 h. Under these conditions, the actual sodium chondroitin sulfate content was determined to be 11.31%by three parallel tests. The yield of sodium chondroitin sulfate from bovine nasal bone was 33%, and the finished product content was 92.5%, which was basically consistent with the predicted value with a small deviation. The regression equation can reflect the effects of various factors on the concentration of sodium chondroitin sulfate, which proves that the model is feasible to optimize the enzymolysis process during the extraction of sodium chondroitin sulfate.
Conclusions
Based on the single factor experiments, a quadratic multiple regression model of the relationship of sodium chondroitin sulfate purity (sodium chondroitin sulfate concentration) to trypsin concentration, pH value, enzymolysis temperature and enzymolysis time during the extraction of sodium chondroitin sulfate from bovine nasal bone was constructed by the response surface methodology. It was verified that the model had a high fitting degree, and is accurate and effective. The enzymolysis conditions were optimizedto be the trypsin concentration of 0.8%, the pH at 9.0, the enzymatic hydrolysis temperature at 52 ℃ and the enzymatic hydrolysis time of 2.0 h. It is shown that the response surface method is reliable for the optimization of enzymolysis process. This study can provide a theoretical and experimental basis for improvingthe production process and improving product yield and economicbenefit for sodium chondroitin sulfate production enterprises.
References
[1] XIONG SL, LI AL, JIN ZY. Properties of in vitro superoxide free radicalscavenging mechanism of chondroitin sulfate from pig laryngeal cartilage[J]. Food Science, 2008, 29(2): 362-365. (in Chiense)
[2] NAKANO T,PIETRASIK Z,OZIMEK, et al. Extraction,isolation and analysisof chondroitin sulfate from broiler chicken biomass [J].Process Biochemistry, 2012, 47(12): 1909-1918.
[3] LIU BC, XU ZL. Extracellular homogeneity[J]. Progress in Physiological Sciences, 1996, 27(3): 221-226. (in Chinese)
[4] ZHANG LY, LIU T, LIU SB. Study on the efficacy of two kinds of functional health food for the enhancing of bone density[J]. Journal of Navy Medicine, 2016, 37(6): 526-531. (in Chinese)
[5] ZHAO M. Cartilage proteoglycan and its role in osteoarthritis[J]. Basic and Clinical Medicine, 1997, 17(2): 93-98. (in Chinese)
[6] NAKANO T, PIETRASIK Z, OZIMEK, et al. Extraction, isolation and analysis of chondrootin sulfate fron broiler chicken biomass[J]. Process Biochemistry, 2012, 47(12): 1909-1918.
[7] LIU W. Advances in pharmacological studies of chondroitin sulfate[J]. China Pharmaceuticals, 2008,17(8): 64-68. (in Chinese)
[8] XU YZ, CHEN SP, SU JH, et al. Extraction of chondroitin sulfate from amur sturgeon and its antitumor activity[J]. Journal of Shanghai Ocean University, 2010, 19(4): 553-559. (in Chinese)
[9] XU CT, GUAN RZ, ZHENG J, et al. Studies on the optimized extration technique of the chondroitin sulfate from cartilage of cultured sturgeon[J]. Chinese Journal of Biochemical Pharmaceutics, 2009, 30(3): 154-161.(in Chinese)
[10] LIU W. Advances in pharmacological studies of chondroitin sulfate[J]. China Pharmaceuticals, 2008, 17(8): 64-66. (in Chinese)
[11] XU CT, GUAN RZ, ZHENG J, et al. Studies on the optimized extration technique of the chondroitin sulfate from cartilage of cultured sturgeon[J]. Chinese Journal of Biochemical Pharmaceutics, 2009, 30(3): 154-161.(in Chinese)
[12] WALEED ABDELFALTAH MD, TAREK HAMMAD MD. Chondroitin sulfate and glucosamine. A review of their safety profile[DB/OL]. 20030406.http://www.google.com.
[13] LIU N, LIU YN, LIU T, et al. Study on the preparation and current situation of chondroitin sulfate[J]. Science and Technology of Food Industry, 2014, 35(3): 392-395. (in Chinese)
[14] TAKUO NAKANO, KAYO NAKANO. Extraction of glycosaminoglycan peptide from bovine nasal cartilage with 0.1 M sodium acetate[J]. J Agric Food Chem., 1998, 6: 772-778.
[15] WANG NQ, ZHAO WJ, LIANG F, et al. Optimization of the fermentation medium for Pseudomonas strain producing a poly(vinyl alcohol)degrading enzyme based on response surface methodology[J]. Acta Scientiae Circumstantiae, 2010, 30(6): 1158-1163. (in Chinese)
[16] YANA R, LIA SL, CHUNGA HS. Simultancous quantification of 12 bioactive components pf Ligusticum chansiong Hort. by bighperformance liquid chromatogerphy[J]. J Pharm Biomed Anal, 2005, 37: 87-95.
Editor: Yingzhi GUANG Proofreader: Xinxiu ZHU
杂志排行
农业生物技术(英文版)的其它文章
- Copyright Authorization Statement
- Quality Analysis of Lycium ruthenicum Murr. from Different Producing Areas
- Optimization of Extraction Process of Anthocyanins from Selenium-enriched Purple Potato by Response Surface Methodology
- Research on Extraction and Purification Technology of Flavonoids from Quinoa (Cheuopodium quinoa) Le
- Effect of Different Processing Techniques on the Content of Total Alkaloids in Toddalia asiatica Lam.
- High Performance Liquid Chromatography Analysis of Sugars and Acid Components in ‘Xintai Tianhong’ Hawthorn Fruit