Genetic Diversity Analysis of Cherry Tomato Core Collection Based on Genotypic Values
2019-09-10ZijiLIUWeixiaLIUYuNIUYanYANG
Ziji LIU Weixia LIU Yu NIU Yan YANG
Abstract Taking 65 cherry tomato core germplasms as experimental materials, the genetic diversity of seven agronomic traits were analyzed. The correlation between any two of the seven agronomic traits and the genetic relationships of these germplasms were analyzed based on genotypic values. The genetic diversity indices of the seven agronomic traits were 4.15, 4.13, 4.16, 4.13, 4.13, 4.13 and 4.01, respectively, showing that the cherry tomato core collection had abundant genetic diversity. The correlation analysis between traits based on genotype effect values showed that leaf length was significantly correlated with leaf width with the correlation coefficient of 0.56. The fruit width was significantly correlated with fruit length with the correlation coefficient of 0.52. The flesh thickness was significantly correlated with fruit length and fruit width with the correlation coefficients of 0.49 and 0.39, respectively. The single fruit weight was significantly correlated with fruit length, fruit width and flesh thickness with the correlation coefficients of 0.44, 0.61 and 0.62, respectively. When the genetic distances between core germplasms of cherry tomato were calculated based on the phenotypic values, 65 core germplasms of cherry tomato were divided into three groups with the rescaled distance of 10. When the genetic distances between core germplasms of cherry tomato were calculated based on the genotypic values, the 65 core germplasms of cherry tomato were divided into four groups with the rescaled distance of 10. Comparing the 2 clustering results, it could find that genotypic valuebased clustering analysis could better clarify the genetic relationship between core germplasms. This study could provide a theoretical basis for the effective utilization of cherry tomato core germplasms.
Key words Cherry tomato; Genetic diversity; Phenotypic value; Genotypic value; Correlation; Clustering analysis
Tomato (Solanum lycopersicum), is an annual or perennial herb of Solanaceae. It originated in South America and is rich in vitamins and minerals. It is an important vegetable crop widely cultivated worldwide[1]. Cherry tomato (Lycopersicon esculentum var. cerasiforme) is the ancestral species of tomato, belonging to fruittype vegetables[2]. Due to its fruit color, high nutritional value and unique flavor, it is favored by consumers and has a planting area in China constantly expanded.
Germplasm resources are the basis of genetic breeding. Genetic diversity refers to genetic variation among different germplasms, and diverse genetic resources are the basis for breed improvement[3-4]. During the domestication process, the genetic background of cherry tomato has become increasingly narrow due to human longterm highpressure selection[5-6]. Studying the genetic diversity of tomato germplasm resources can help to understand the genetic and variation conditions of various germplasms, and grasp the resources of the species as a whole, thereby providing important information for breeders, which provides a basis for studying the protection of tomato varieties and the selection of parents and for utilizing existing germplasm resources[7].
Morphological diversity evaluation is an important step in the identification of germplasm resources, and plays a key role in evaluatingthe adaptability of germplasm resources and the value of breeding[8]. In recent years, studies on tomato germplasm resources evaluation and genetic diversity analysis have focused on simple statistics and clustering analysis of biological traits of germplasm resources[9-15]. The phenotypic characteristics are the result of the combination of environmental factors and genetic factors, and the phenotypic data are susceptible to environmental and cultivation factors, so studying the genetic diversity depending on morphology has certain limitations[16]. In this study, correlation analysisand clustering analysis were carried out based on predicted genotypic values of traits, with the attempt to clarify the richness of phenotypic variation of cherry tomato core germplasms and the genetic relationships among different germplasms. This study could provide reference and basis for overcoming the blindness of parental selection in breeding work and guiding the utilization of heterosis in tomato germplasm research and breeding.
Materials and Methods
Materials and genotypic value prediction
Sixty five cherry tomato core collections were planted in the order of field ranks, and the control variety were interspersed at regular intervals. The control variety was used to control the differences in different positions in the field. And the experiment was carried out in two replicates. According to the Descriptors and Data Standard for Solanum lycopersicum[17], seven agronomic traits such as leaf length, leaf width, first inflorescence node, fruit length, fruit width, flesh thickness and single fruit weight were investigated. The statistical analysis method of the mixed linear model proposed by Zhu[18]was used for statistical analysis, and the unbiased prediction method was applied to predict the genotype effect value.
Genetic diversity and correlation analysis
The minimum, maximum, mean, range, coefficient of variation, standard deviation and genetic diversity index of the seven agronomic traits were statistically analyzed using SAS 9.0 software.
Clustering analysis
The correlation coefficients between the traits were calculated based on the genotype effect values of the seven agronomic traits using SPSS 16.0 software, and the clustering figure of 65 cherry tomato core germplasms was constructed. The genetic distances between samples were calculated using the squared euclidean distance, and the clustering analysis was performed based on the wards method.
Results and Analysis
Genetic diversity analysis of agronomic traits in cherry tomato
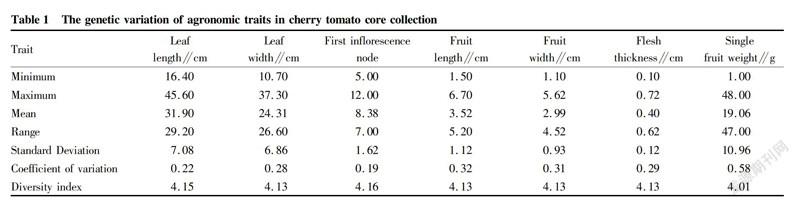
The ranges of leaf width, fruit length, fruit width, flesh thickness and single fruit weight were far greater than their means, especially the range of single fruit weight, which was almost 2.5times of the mean, indicating that the phenotypic values of the agronomic traits of the cherry tomato core collections were more dispersed. The coefficient of variation of single fruit weight was the largest (0.58); the coefficient of variation of fruit length was the second (0.32); and the coefficient of variation of fruit width was 0.31, ranking third. Furthermore, the phenotypic values of single fruit weight, fruit length and fruit width of the cherry tomato core germplasms were highly dispersed, and the genetic differences amonggermplasms were large. The diversity indices of the seven agronomic traits were 4.15, 4.13, 4.16, 4.13, 4.13, 4.13 and 4.01, respectively, all exceeding 4.0. The results indicated that these cherry tomato core germplasms had abundant genetic diversity (Table 1).
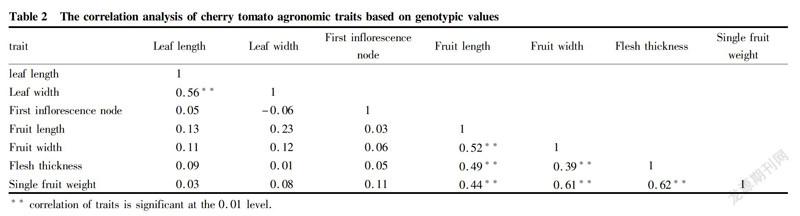
The traitbased correlation analysis can achieve the effect of indirectly selecting another trait by selecting one trait, thereby greatly improving the selection efficiency. The genotype effect values of the seven agronomic traits of the 65 cherry tomato core collections were predicted by the adjusted unbiased prediction method. The results of the correlation analysis between traits based on genotype effect values revealed as Table 2, the leaf length was significantly correlated with leaf width, with a correlation coefficient of 0.56. The fruit width and fruit length were significantly correlated with the correlation coefficient of 0.52. The flesh thickness was significantly correlated with fruit length and fruit width with the correlation coefficients of 0.49 and 0.39, respectively. The single fruit weight was significantly correlated with fruit length, fruit width and flesh thickness, with the correlation coefficients of 0.44, 0.61 and 0.62, respectively.
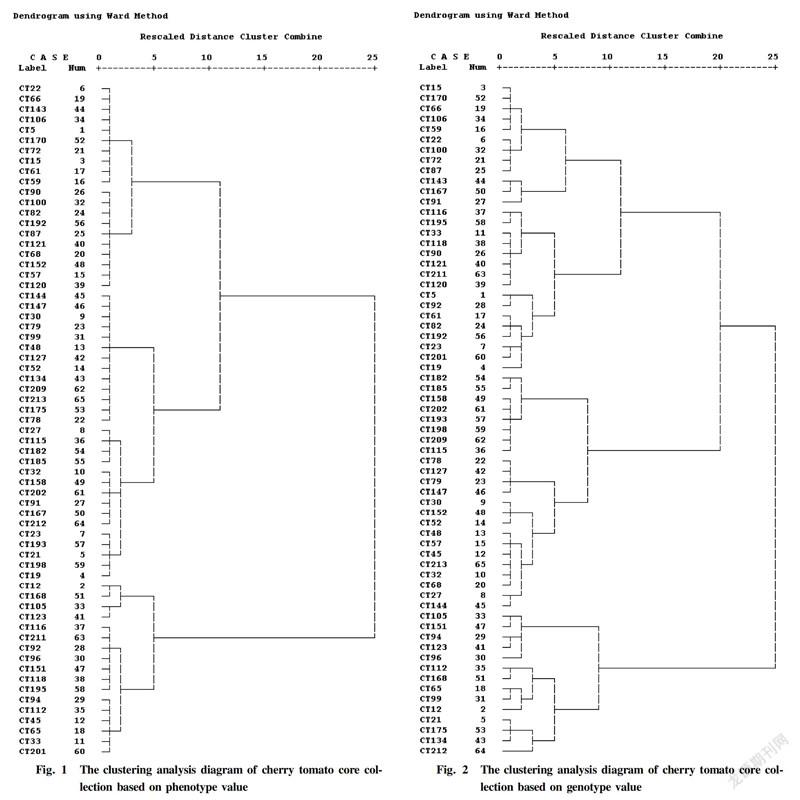
The squared euclidean distance method was applied to calculate the genetic distances between the core materials of cherry tomato based on the phenotypic values of the seven agronomic traits. Among the 65 core materials tested, the genetic distances between different germplasms varied greatly, indicating that the genetic variation of these core materials was significant. The clustering analysis was carried out according to the wards method. It can be found from Fig. 1 that when the rescaled distance was 10, the 65 cherry tomato core germplasms were divided into three groups. The first group included two subgroups, of which the first subgroup included 10 germplasms such as CT22, CT66, CT143, CT106, CT5, CT170, CT72, CT15, CT61 and CT59, and the second subgroup also included 10 germplasms, i.e., CT90, CT100, CT82, CT192, CT87, CT121, CT68, CT152, CT57 and CT120. The second group included two subgroups, of which the first subgroup included 13 germplasms, namely CT144, CT147, CT30, CT79, CT99, CT48, CT127, CT52, CT134, CT209, CT213, CT175 and CT78, and the second subgroup included 15 germplasms, namely CT27, CT115, CT182, CT185, CT32, CT158, CT202, CT91, CT167, CT212, CT23, CT193, CT21, CT198 and CT19. The third group included two subgroups, of which the first subgroup included four germplasms, namely CT12, CT168, CT105 and CT123, and the second subgroup included 13 germplasms, namely CT116, CT211, CT92, CT96, CT151, CT118, CT195, CT94, CT112, CT45, CT65, CT33 and CT201.
Clustering analysis of cherry tomato core collection based on genotype value
The squared euclidean distance method was applied to calculate the genetic distances between the core materials of cherry tomato based on the predicted genotypic values of the seven agronomic traits. The clustering analysis was carried out by the wards method. It can be found from Fig. 2 that at the rescaled distance of 10, the 65 cherry tomato core germplasms were divided into four groups. The first group included two subgroups, of which the first subgroup included nine germplasms, namely CT15, CT170, CT66, CT106, CT59, CT22, CT100, CT72 and CT87, and the second subgroup included three germplasms, which were CT143, CT167 and CT91. The second group included two subgroups, of which the first subgroup included eight germplasms, namely CT116, CT195, CT33, CT110, CT90, CT121, CT211 and CT120, and the second subgroup included eight germplasms, namely CT5, CT92, CT61, CT82, CT192, CT23, CT201 and CT19. The third group also included two subgroups, of which the first subgroup comprised eight germplasms, namely CT182, CT185, CT158, CT202, CT193, CT198, CT209 and CT115, and the second subgroup included 15 germplasms, which were CT78, CT127, CT79, CT147, CT30, CT152, CT52, CT48, CT57, CT45, CT213, CT32, CT68, CT27 and CT144. The fourth group consisted of two subgroups, of which the first subgroup comprised five germplasms, namely CT105, CT151, CT94, CT123 and CT96, and the second subgroup included CT112, CT168, CT65, CT99, CT12, CT21, CT175, CT134 and CT212.
Compared the clustering results based on phenotypic values and the clustering results based on genotypic values, it was found that the clustering analysis based on the genotypic values can clarify the genetic relationships between core germplasms well. For example, CT22, CT66, CT106, CT170, CT72, CT15 and CT59 were clustered into one group based on the phenotypic values, while CT66, CT106, CT170, CT15 and CT59 , CT22 and CT72 were clustered into different subgroups when based on genotypic values. Because phenotypic values are susceptible to environmental factors, there were certain errors in clustering analysis based on phenotypic values. For example, CT143 and CT167 belonged to different groups when performing clustering analysis based on phenotypic values, while based on genotypic values, CT143 and CT167 were closely related and belonged to the same group.
Discussion
Genetic diversity and genetic relationship analysis are important contents in tomato genetic breeding research, which are conducive to the division of heterotic groups and can guide the selection of parents in breeding practice[19]. Phenotypic diversity is a comprehensive manifestation of genetic diversity and environmental diversity. The study of phenotypic trait diversity can help to understand the diversity of research objects as a whole[20-21]. In this study, the genetic diversity of the seven agronomic traits of the 65 cherry tomato core germplasms was analyzed, and the diversity indices of the seven agronomic traits all exceeded 4.0. These results showed that the different traits of cherry tomato germplasms showed significant diversity, and these abundant genetic resources could provide abundant resources for the conventional breeding of cherry tomato, which is conducive to the breeding of new varieties.
Correlation analysis can be applied to analyze the relationships between agronomic traits[22]. Important traits can be improved synchronously with secondary traits improvement , thereby speeding up the breeding process. Because trait phenotypes are affected by genotypes, environmental conditions and genotypeenvironment interaction[23], certain error existed when evaluating the correlation between traits based on the phenotypic value of traits. In order to accurately evaluate the correlation between traits, this study used the adjusted unbiased prediction method to predict the genotypic values of the seven agronomic traits of the 65 cherry tomato core germplasms. The correlation analysis was conducted based on the genotype effect values of traits, the results showed that the leaf length was extremely significantly correlated with leaf width; the fruit width and fruit length were extremely significantly correlated; and the single fruit weight was in extremely significant correlation with fruit length, fruit width and flesh thickness. Therefore, in the selection process of cherry tomato varieties, screening the breeding materials with moderate fruit length, fruit width and flesh thickness can help to increase single fruit weight the and achieve the goal of increasing yield.
In the past, tomato genetic relationship analysis relied mainly on phenotypic data, which was susceptible to gene dominant effects and environmental influences[24]. In this study, the results of clustering analysis based on agronomic trait phenotypes and genotype effect values were compared. The genetic relationships between core germplasms can be more clearly defined by the clustering analysis based on genotypic values, by which the core materials with far relationships can be selected to prepare hybrid combinations for the selection of new cherry tomato varieties with excellent traits and significant heterosis, so as to improve the breeding efficiency and accelerate the breeding process.
With the development of modern molecular biotechnology, molecular marker technology has become the main means of plant genetic diversity research. In order to better study the genetic diversity of tomato germplasm resources, it is necessary to combine various methods, providing a strong theoretical basis for tomato breeding.
References
[1] LLORENTE B, DANDREA L, RUIZSOLA MA, et al. Tomato fruit carotenoid biosynthesis is adjusted to actual ripening progression by a lightdependent mechanism[J]. Plant J, 2016, 85(1):107-119.
[2] RUAN MY, YANG YJ, ZHOU GZ, et al. A new TYLCV resistant cherry tomato F1 hybrid:‘Zheyingfen No.2’[J]. China Vegetables, 2018(7): 74-76. (in Chinese)
[3] LIU XY, ZHENG Z, DENG XB, et al. Analysis of genetic diversity of processed tomato resources in China[J]. Acta Horticulturae Sinica, 2016, 43(3): 485-495. (in Chinese)
[4] LIN T. Genetic basis for tomato genome diversity and evolution[D]. Beijing: China Agricultural University, 2016. (in Chinese)
[5] SIM SC, ROBBINS MD, CHILCOTT C, et al. Oligonucleotide array discovery of polymorphisms in cultivated tomato (Solanum lycopersicum L.) reveals patterns of SNP variation associated with breeding. BMC Genomics, 2009, 10(1): 1.
[6] NESBITT TC, TANKSLEY SD. Comparative sequencing in the genus Lycopersicon: implications for the evolution of fruit size in the domestication of cultivated tomatoes[J]. Genetics, 2002, 162(1): 365-379.
[7] HU XR, TAO M, ZHOU HL. Advances in genetic diversity of tomato germplasm resources[J]. Mod Agric Sci Technol, 2008(5): 6-8. (in Chinese)
[8] LIU Y, CHEN T, ZHANG J, et al. Analysis of genetic diversity of phenotypic traits in Chinese cherry germplasm resources[J]. Acta Horticulturae Sinica, 2016, 43(11): 2119-2132. (in Chinese)
[9] RUI WJ, ZHANG QN, WANG XM, et al. Genetic diversity of phenotypic traits in 47 germplasm resources of large fruit tomato[J]. Jiangsu Agricultural Sciences, 2017, 45(12): 92-95. (in Chinese)
[10] YUAN DS, WANG XM, ZHAO YF, et al. Genetic Diversity Analysis of Phenotypic Traits of 100 Tomato Germplasm Resources[J]. Acta Agriculturae Borealioccidentalis Sinica, 2019, 28(4): 1-8. (in Chinese)
[11] FENG JJ, LIU L, ZHENG Z, et al. Solanum pimpinellifolium genetic diversity[J]. Journal of Plant Genetic Resources, 2017, 18(4):611-619.(in Chinese)
[12] GONG YJ, WU LY, LI ZB, et al. Genetic diversity and cluster analysis of big fruit tomato germplasm resources[J]. Southwest China Journal of Agricultural Sciences, 2013, 26(6): 2447-2450. (in Chinese)
[13] RUI WJ, WANG XM, ZHANG QN, et al. Genetic diversity analysis of 353 tomato germplasm resources by phenotypic traits[J]. Acta Horticulturae Sinica, 2018, 45 (3): 561–570. (in Chinese)
[14] ZHANG J, BAI R, JIA Y, et al. Diversity and cluster analysis of tomato germplasm resources[J]. China Cucurbits and Vegetables, 2018, 31(2): 11-14. (in Chinese)
[15] SUN YD, LIANG Y, WU JM, et al. Genetic diversity and cluster analysis of tomato germplasm resources[J]. Acta Agriculturae Borealioccidentalis Sinica, 2009, 18(5): 297-301. (in Chinese)
[16] WAN SW, SONG FJ, HAO JJ, et al. Genetic diversity analysis of agronomic traits of 271 pea germplasm resources[J]. Journal of Plant Genetic Resources, 2017, 18(1): 10-18. (in Chinese)
[17] LI XX, DU YC. Description criterion and data standard for Solanum lycopersicum germplasm evalution[M]. Beijing: China Agriculture Press, 2006. (in Chinese)
[18] ZHU J. Method for predicting genotypic value and heterosis of crop hybrid progeny[J]. Journal of Biomathematics, 1993, 8(1):32-44. (in Chinese)
[19] QIU MY, ZHANG SP, GUO S, et al. Analysis of tomato germplasm phylogenetic relationship using SSR markers[J]. China Vegetables, 2012(24): 39-42. (in Chinese)
[20] SUN ZZ, LI QY, WANG XL, et al. Phenotypic diversity analysis and comprehensive evaluation of broadskin citrus germplasm resources[J]. Scientia Agricultura Sinica, 2017, 50(22): 4362-4383. (in Chinese)
[21] LI CQ, ZHOU L, LU B, et al. Study on phenotypic diversity of cerasus tianschanica pojark germplasm resources[J]. Acta Agriculturae Borealioccidentalis Sinica, 2018, 27(1): 91-97. (in Chinese)
[22] LIANG YS, ZHANG XD, GAO ZQ, et al. Phenotypic relationship between roots and important shoot agronomic traits using a RIL and two derived backcross populations of super rice Xieyou 9308[J]. Acta Agronomica Sinica, 2011, 37(10):1711-1723. (in Chinese)
[23] XU HM, HU J, ZHU J. An efficient method of sampling core collection from crop germplasm[J]. Acta Agronomica Sinica, 2000, 26(2):157-162.(in Chinese)
[24] PATERSON AH, DAMON S, HEWITT JD, et al. Mendelian factors underlying quantitative traits in tomato: Comparison across species, generations, and environments[J]. Genetics, 1991, 127(1): 181-197.
Editor: Yingzhi GUANG Proofreader: Xinxiu ZHU
杂志排行
农业生物技术(英文版)的其它文章
- Copyright Authorization Statement
- Optimization of Enzymatic Extraction of Sodium Chondroitin Sulfate From Bovine Nasal Bone
- Quality Analysis of Lycium ruthenicum Murr. from Different Producing Areas
- Optimization of Extraction Process of Anthocyanins from Selenium-enriched Purple Potato by Response Surface Methodology
- Research on Extraction and Purification Technology of Flavonoids from Quinoa (Cheuopodium quinoa) Le
- Effect of Different Processing Techniques on the Content of Total Alkaloids in Toddalia asiatica Lam.