缺陷TiO2-x中空微球的制备及光催化降解亚甲基蓝性能
2019-09-03章家伟王晟刘福生付小杰马国权侯美顺唐卓
章家伟,王晟,*,刘福生,付小杰,马国权,侯美顺,唐卓
1南京工业大学化工学院,南京 210009
2南京林业大学理学院化学与材料科学系,南京 210037
1 lntroduction
Semiconductor photocatalysis has attracted much more attention because it is a potential technology for solving environmental and energy problems including such as photocatalytic degradation of organic pollutants1-3, H2production by photocatalytic water splitting4-6and so on. It is well known that an efficient photocatalyst is very important in the photocatalysis process. Among various semiconductor photocatalysts, TiO2has been widely used because of its relatively high photocatalytic activity and photostability, cost effectiveness and non-toxic nature7. However, the large band gap of TiO2limits its utilization of sunlight energy because the UV region possesses only 3%-5% of the sunlight spectrum. To overcome this problem, great efforts such as metal or nonmetal doping8,9, dye photosensitization10,11and coupled semiconductors12-16have been devoted approach a high photocatalytic activity under visible light irradiation17.Recently, it has been proved that the intrinsic defects such as oxygen vacancy in TiO2can trigger the visible light activity.Naldoni et al.18have proved that the band gap narrowing of TiO2with oxygen vacancy is dictated by the synergistic presence of oxygen vacancy and surface disorder. TiO2with oxygen vacancy has shown a strongly enhanced photocatalytic performance in methylene blue and phenol degradation as well as in hydrogen evolution under visible light17,19-21. The morphology of the semiconductors, such as one-dimensional nanotubes and nanowires22,23, two dimensional nanoplates and threedimensional nanospheres, hollow microspheres and inverse opal photonic crystal24,25, is one of the crucial factors that affect their photocatalytic activities. Among these structures, hollow microspheres are most attractive in terms of the outstanding light absorption, easy fabrication and separation26. TiO2hollow microspheres with large surface area have shown the high photocatalytic efficiency in the degradation of environmental pollutants27-29.
The degradation rate of organic dye is strongly influenced by the initial dye concentration, and it decreases with the increasing of dye concentration because a significant amount of visible light is absorbed by dye molecules rather than photocatalyst resulting in a decrease in the photocatalytic activity. The kinetics of photocatalytic degradation of organic dye usually is depicted by pseudo-first order equation30. However, the effect of dye on light absorption property is not considered.
In this study, the defective TiO2-xhollow microspheres (x in TiO2-xis a level of oxygen deficiency) were prepared to effectively promote the photocatalytic activity under visible light irradiation. And the mechanism and kinetics of MB degradation were also investigated systematically.
2 Experimental
2.1 Synthesis of TiO2 hollow microspheres
The TiO2hollow microspheres were synthesized by a template method using carbon spheres as template according to the literature reported procedure31,32. The details of the typical experiment are as follows. 60 mL of glucose aqueous solution(0.5 mol·L-1) was heated at 180 °C for 8 h in 100 mL stainless steel autoclave and then cooled to room temperature. The obtained carbon spheres were collected and washed by deionized water, ethanol and acetone for several times, and then dried at 80°C for 8 h. 1.0 mL of TiCl3and 1.0 mL of HCl solution (6.0 mol·L-1) were added in 60 mL of ethanol dispersed with 0.1 g of carbon spheres under magnetic stirring. After stirring for 1 h, the mixture was heated at 98 °C for 1 h. The products collected and washed by deionized water, then dried at 105 °C for 10 h under vacuum, and finally calcined at 550 °C for 2 h to remove carbon spheres to obtain TiO2hollow microspheres. For comparison,TiO2was prepared without carbon spheres as template according to the same method.
2.2 Synthesis of defective TiO2-x hollow microspheres
The defective TiO2-xhollow microspheres were prepared by hydrogen reduction process18. The as-prepared TiO2hollow microspheres were reduced at 550 °C for 3 h in an H2atmosphere to obtain defective TiO2-xhollow microspheres. The defective TiO2-xwas obtained also by reducing TiO2at 550 °C for 3 h in an H2atmosphere.
2.3 Characterization
The morphology and size of the samples were carried out using scanning electron microscopy (SEM, Hitachi S4800) and transmission electron microscopy (TEM, JEM-2010 UHR). The structure of the samples was analyzed by X-ray powder diffraction (XRD, Rigaku Smartlab), X-ray photoelectron spectroscopy (XPS, Shimadzu AXIS UltraDLD), Raman spectrometer (Horiba Labram HR800) and Electron spinresonance (ESR, Bruker EMX-10/12 spectrometer). The Brunauer-Emmett-Teller (BET) specific surface area was determined by nitrogen adsorption using a BEL Belsorp II apparatus. Photophysical properties of the samples were determined by UV-visible diffuse reflectance spectroscopy (UVVis DRS, Perkin Elmer LAMBDA 950).
Photoelectrochemical experiments were carried out in a threeelectrode system with a Pt plate as counter electrode, a saturated calomel electrode (SCE) as reference electrode, and an indium tin oxide (ITO) glass coated with the thin films of the photocatalyst samples as the working electrode. Transient photocurrent response plots, Mott-Schottky plots and electrochemical impedance spectra were measured in 0.1 mol·L-1Na2SO4aqueous solution with a potentiostat/galvanostat electrochemical analyzer (Shanghai Chenhua CHI660E).

Fig. 1 SEM photographs of (a) carbon sphere, (b) TiO2-x hollow microsphere, (c) TiO2-x, and (d) TEM images of TiO2-x hollow microsphere.
2.4 Photocatalytic experiments
The photocatalytic activities of the as-synthesized samples were evaluated by testing the photocatalytic degradation of methylene blue (MB) in aqueous solution. 20 mg of sample was added to 100 mL of MB solution (10 mg·L-1) placed in a 150 mL quartz beaker. A 250W Xe lamp (Nanjing Jianyingzhanchi Photoelectronic Science and Technology MCL-300X) with the average light power density being 4.0 mW·cm-2was used as light source with a filter to remove light of wavelength below 400 nm. The reaction temperature was controlled at 30 °C.Before irradiation, the suspension was stirred for 90 min in the dark to establish adsorption-desorption equilibrium. After irradiation, 5 mL samples of the suspension were taken and centrifuged at 3000 r·min-1to remove the photocatalyst at a given irradiation time interval. The MB concentration in the supernate was analyzed by the variation of absorbance at 664 nm using a visible spectrophotometer (Shanghai Precision and Scientific Instrument Company Type 721). The percentage of degradation was calculated using the following equation:

where c0and c are the concentration of MB solution before and after illumination, respectively.
3 Results and discussion
3.1 Characterization of TiO2-x hollow microspheres
3.1.1 Morphology characterization
The SEM photograph of carbon spheres is shown in Fig. 1a.It can be seen from the figure that every carbon sphere has a smooth surface with a clear edge. The diameter of carbon spheres are between 150-250 nm. The morphologies of the TiO2-xhollow microspheres are shown in Fig. 1b. Fig. 1b reveals the hollow structure of TiO2-xspheres composed of nanoparticles with the diameter in the range of 100 to 200 nm,which are the replica of the carbon sphere templates. The particle size of the TiO2-xhollow microspheres is a certain degree of reduction compared with that of carbon sphere due to the shrinkage during the process of calcination. The representative TEM image of TiO2-xhollow microsphere presented in Fig. 1d.Fig. 1d reveals a hollow-like structure of TiO2spheres with a diameter around 240 nm, which is in a good correspondence with the result of SEM. It can be observed that the shell of the TiO2-xhollow microsphere is composed of nanoparticle. From Fig. 1c,the defective TiO2-xsamples are approximately spherical nanoparticles with an average diameter of about 50 nm.
3.1.2 Structure characterization
Fig. 2 displays the XRD patterns of TiO2, TiO2-x, TiO2hollow microsphere and TiO2-xhollow microsphere samples. As shown in Fig. 2, all of the diffraction peaks of TiO2and TiO2hollow microsphere samples are assigned to the crystal phases of anatase TiO2(JCPDS Card No. 21-1272). The mainly diffraction peaks of TiO2-xand TiO2-xhollow microsphere samples are assigned to the crystal phases of rutile TiO2(JCPDS Card No.21-1276). Besides, the peak at 25.3° and 48.1° ascribing to the crystal phases of anatase are also observed, which implies the existence of rutile phase with a small fraction of anatase phase in TiO2-xand TiO2-xhollow microsphere samples. And this suggests that the process of calcined at 550 °C in an H2atmosphere changes the crystal phase.
Structural properties of TiO2, TiO2-x, TiO2hollow microsphere and TiO2-xhollow microsphere samples were further examined by measuring Raman scattering. The five Raman-active modes (140, 193, 393, 512 and 636 cm-1) of anatase phase33,17,18are detected in the four samples shown in Fig. 3a. TiO2-xand TiO2-xhollow microsphere samples also show rutile phase Raman-active modes (239, 436 and 605 cm-1)18. This is consistent with the results characterized by XRD. Compared with TiO2and TiO2hollow microsphere, TiO2-xand TiO2-xhollow microsphere display a varying degree of blueshift in Raman bands (from 140 to 144 cm-1for TiO2-xand from 140 to 146 cm-1for TiO2-xhollow microsphere) indicating that the original symmetry of TiO2lattice is broken down due to the oxygen vacancies formed by calcined at 550 °C in an H2atmosphere19.

Fig. 2 XRD patterns of TiO2, TiO2-x, TiO2 hollow microsphere and TiO2-x hollow microsphere.
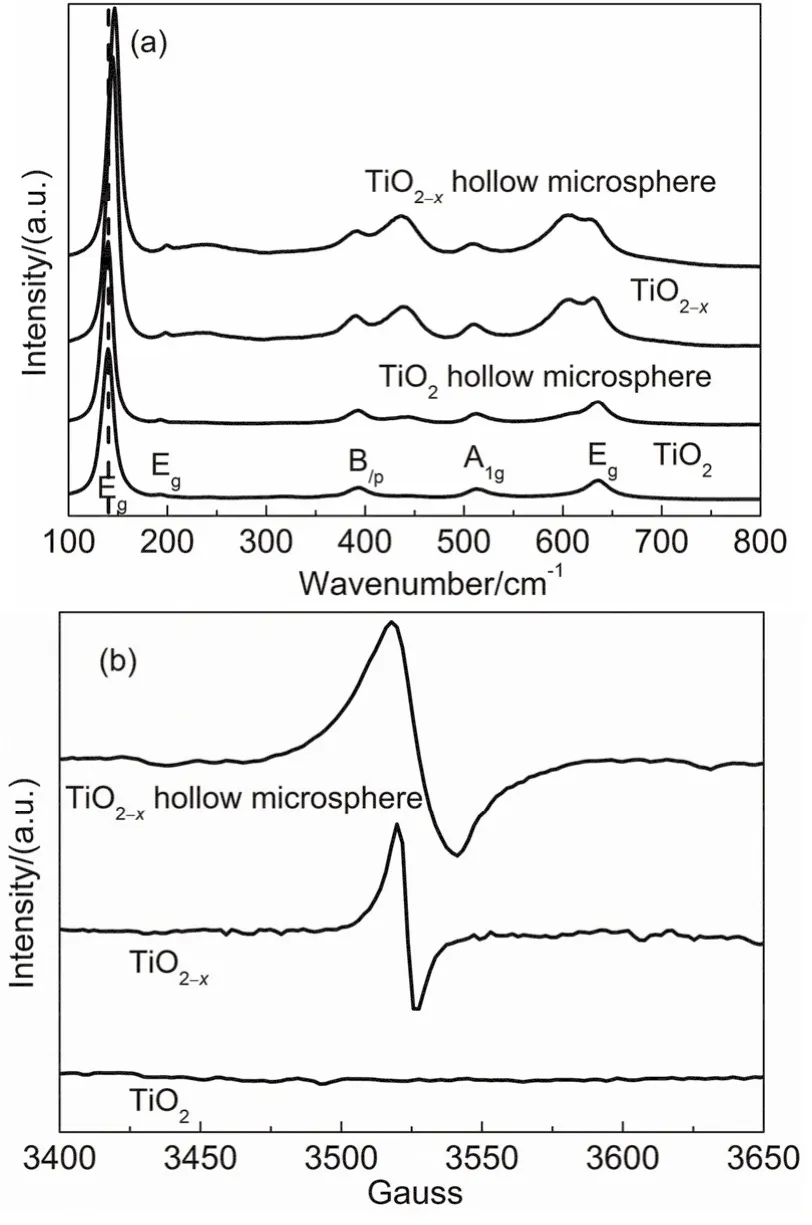
Fig. 3 (a) Raman spectra of TiO2, TiO2-x, TiO2 hollow microsphere and TiO2-x hollow microsphere, and (b) ESR spectra of TiO2,TiO2-x and TiO2-x hollow microsphere.
The presence of oxygen vacancies in the TiO2-xand TiO2-xhollow microspheres is further supported by ESR spectroscopy.Fig. 3b shows the ESR spectrum of TiO2, TiO2-xand TiO2-xhollow microsphere. From Fig. 3b, TiO2-xand TiO2-xhollow microspheres show a very strong ESR signal at g-value of 2.003 caused by electrons trapped on surface oxygen vacancies indicating the presence of oxygen vacancies20. However, the representative signal of Ti3+at g-value of 1.9417,21is not appeared.
In order to further investigate the surface chemical composition and bonding configuration, the TiO2, TiO2-xand TiO2-xhollow microsphere were characterized by XPS. Fig. 4a shows two strong peaks with slightly difference for TiO2, TiO2-xand TiO2-xhollow microsphere, respectively. The two strong peaks are assigned to the binding energy of the Ti 2p1/2and Ti 2p3/2electrons corresponded to oxidation state of Ti4+17,19. The Ti 2p signals are highly symmetric without shoulders appeared at the lower energy side suggesting that Ti3+does not exist in TiO2-xand TiO2-xhollow microsphere21. As reported, the reduction of TiO2is usually accompanied by the appearance of Ti3+species18,19,34. That the ESR and XPS results do not suggest that Ti3+do exist in TiO2-xand TiO2-xhollow microsphere may be for the extremely low defect concentration because of the hydrogen reduction process occurring mainly on the surface of TiO2. As shown in Fig. 4b, the O 1s primary spectrum peaks for TiO2, TiO2-xand TiO2-xhollow microsphere are wide and asymmetric and can be fitted by three components located around 529.4, 531.9 and 533.4 eV, respectively. The high binding energy component is usually attributed to the presence of surface-adsorbed molecular water H2O. The low binding energy component is attributed to surface Ti-O-Ti(OTi). The medium binding energy component is associated with surface hydroxylation35,36.
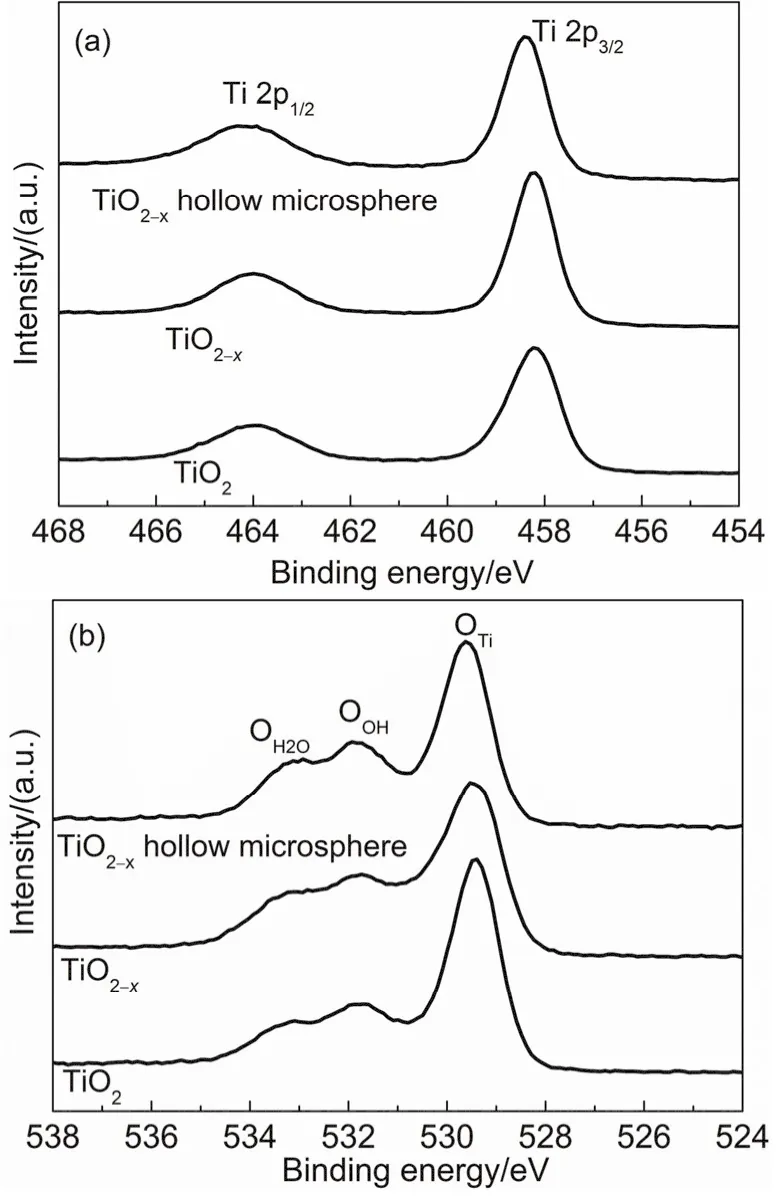
Fig. 4 XPS analysis of the TiO2, TiO2-x and TiO2-x hollow microsphere: (a) Ti 2p and (b) O 1s.
Fig. 5a, b show the N2adsorption-desorption isotherms and corresponding Barrett-Joyner-Halenda (BJH) pore size distribution plots to further investigate the porous nature and the specific surface area of TiO2, TiO2-x, TiO2hollow microsphere and TiO2-xhollow microsphere samples. The inset shows magnified view for Barrett-Joyner-Halenda (BJH) pore size distribution plots of TiO2hollow microsphere and TiO2-xhollow micro sphere samples. As shown in Fig. 5a, according to IUPAC classification, the isotherms of TiO2and TiO2-xsamples show a shape close to type IV containing a hysteresis loop. The hysteresis loop shows a mixed feature of type H1 and H2 corresponding to mesopores. The isotherms of TiO2hollow microsphere and TiO2-xhollow microsphere samples exhibit a type IV isotherm with a type H3 hysteresis loop in the relative pressure range of 0.8-1.0 corresponding to slit-shaped pores37.As shown in Fig. 5b, most of the pores are around 13.9 nm for the TiO2and TiO2-xsamples, and there is a little peak at about 20 nm for TiO2hollow microsphere and TiO2-xhollow microsphere. This suggests that TiO2hollow microsphere and TiO2-xhollow microsphere samples mainly contain slit-shaped pores between nanoparticles, which aggregate into a microsphere. The results for each BET analysis are listed in Table 1. As shown in Table 1, the BET surface area of hollow microsphere increases from 46.06 m2·g-1(TiO2) to 63.34 m2·g-1(TiO2hollow microsphere) and from 48.98 m2·g-1(TiO2-x) to 64.28 m2·g-1(TiO2-xhollow microsphere), suggesting that the shape of hollow microsphere can increase the specific surface area and make the defective TiO2-xhollow microsphere suitable for photocatalysis application.

Fig. 5 (a) N2 absorption-desorption isotherms and (b) pore size distributions of TiO2, TiO2-x, TiO2 hollow microsphere and TiO2-x hollow microsphere samples. The inset shows magnified view for pore size distribution plots of TiO2 hollow microsphere andTiO2-x hollow microsphere samples.

Table 1 Summary of calculated data of samples
3.1.3 Photophysical properties
The optical properties of as-prepraed samples were characterized by UV-visible DRS. As shown in Fig. 6a, TiO2and TiO2hollow microsphere only have the photoresponsiveness in the ultraviolet region at 200-400 nm. TiO2-xand TiO2-xhollow microsphere have also exhibited strong absorption peaks in the ultraviolet region. In the visible region with a wavelength of 400-800 nm, the values of absorbance are about 35% for TiO2-xand in the range of 40%-50% for TiO2-xhollow microsphere,indicating that TiO2-xand TiO2-xhollow microsphere have a certain absorption capacity in visible regions.
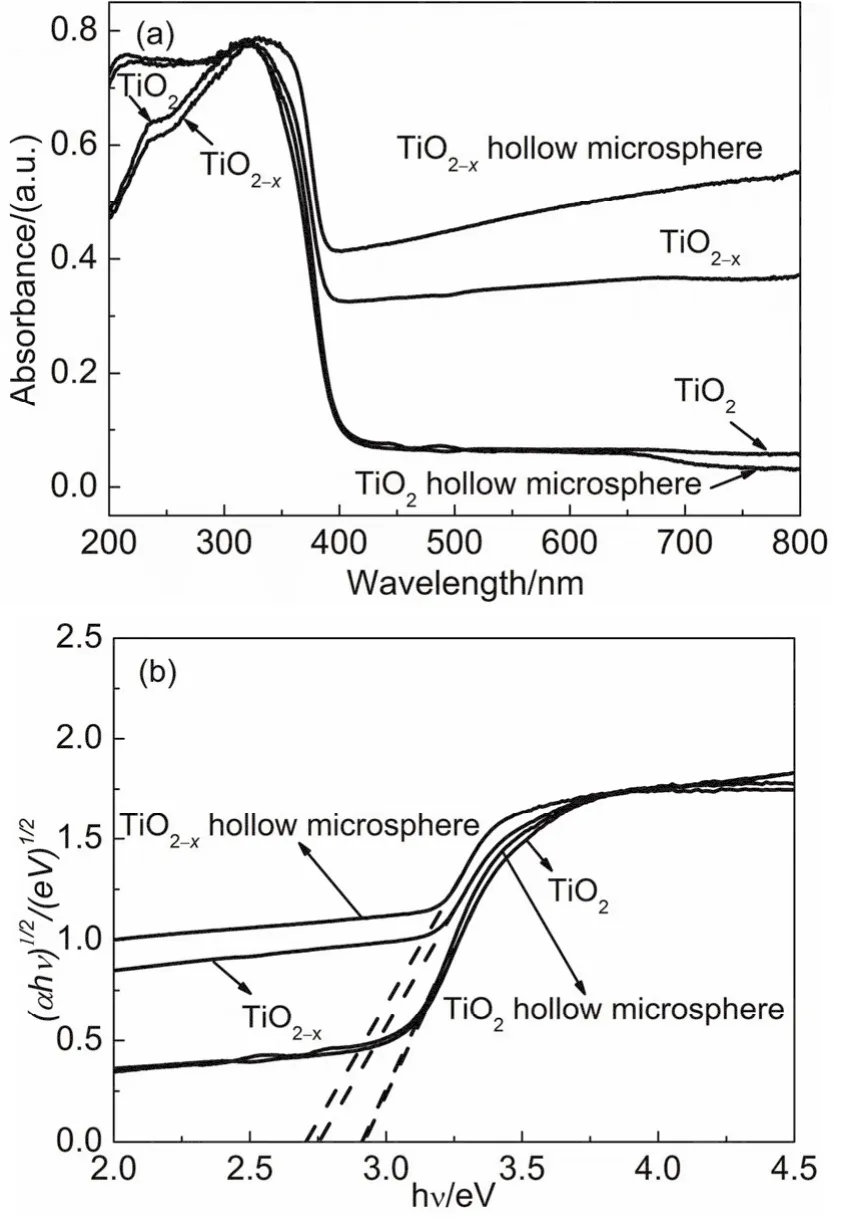
Fig. 6 (a) UV-Vis DRS spectra and (b) (αhv)1/2 vs hv plots for band-gap calculations of TiO2, TiO2-x, TiO2 hollow microsphere and TiO2-x hollow microsphere.
Kubelka-Munk function by the linear equation (αhv)1/2= A(hv -Eg) is applied to calculate the band gap (Eg) of the semiconductors, where α, h, v, A and Egare the absorption coefficient, Planck constant, light frequency, a constant and band gap energy, respectively. Constant n is 1/2 for TiO238. The calculating results are shown in Fig. 6b. From Fig. 6b, the values of band gap of TiO2, TiO2-x, TiO2hollow microsphere and TiO2-xhollow microsphere are obtained and listed in Table 1.
As shown in Table 1, the values of band gap of TiO2-xand TiO2-xhollow microsphere are lower than that of TiO2and TiO2hollow microsphere, respectively. This is for the reason that the oxygen vacancy can generate the electronic states vacancy band between the valence band and the conduction band of pure TiO217.39, which decreases the values of band gap. As a result,TiO2-xand TiO2-xhollow microsphere can be excited by visible light.
3.1.4 Photoelectrochemical properties
Fig. 7 shows Mott-Schottky plots of TiO2, TiO2-x, TiO2hollow microsphere and TiO2-xhollow microsphere. According to the Mott-Schottky equation, the flat band potentials of TiO2,TiO2-x, TiO2hollow microsphere and TiO2-xhollow microsphere are obtained. Then the conduction band potential (ECB) can be calculated according to the flat band potentials36, and the valence band potential (EVB) can also be calculated according to the values of conduction band potential and band gap. All of the values of ECBand EVBof as-prepared four samples are listed in Table 1.

Fig. 7 Mott-Schottky cures for (a)TiO2 and TiO2 hollow microsphere and (b) TiO2-x and TiO2-x hollow microsphere film in 0.1 mol·L-1 Na2SO4 solution (f = 500 Hz).
Fig. 8a shows the transient photocurrent response plots of TiO2, TiO2-x, TiO2hollow microsphere and TiO2-xhollow microsphere. Blank experiments conducted on bare ITO produce no obvious photocurrent under similar illumination conditions.The photocurrent has a sequence as follows: TiO2-xhollow microsphere > TiO2-x> TiO2hollow microsphere > TiO2. This implies that TiO2with oxygen vacancies deposited on the ITO electrode more effectively transfers charge to the electrode surface under illumination than pure TiO2. The TiO2-xhollow microsphere/ITO electrode exhibits a highest photocurrent among the samples.
The electrochemical impedance spectra (EIS) of the samples were measured to illustrate the transferring ability and separation efficiency of photogenerated charge. Fig. 8b shows the EIS Nyquist plots of TiO2, TiO2-x, TiO2hollow microsphere and TiO2-xhollow microsphere. The smaller radius of the arc on the EIS spectra reveals the better separation efficiency of photogenerated electron-hole pairs. The arc semicircle diameter of the four samples is in the order of TiO2> TiO2hollow microsphere > TiO2-x> TiO2-xhollow microsphere, indicating the charge transferring resistance is in the order of TiO2> TiO2hollow microsphere > TiO2-x> TiO2-xhollow microsphere40.The arc semicircles of TiO2-xand TiO2-xhollow microsphere samples significantly decrease revealing an obviously decreasing of the electron-hole separation resistance after forming oxygen vacancies. TiO2-xhollow microsphere displays the smallest arc semicircle suggesting the smallest charge transferring resistance. This result indicates that TiO2with oxygen vacancies efficiently enhances the separation efficiency of photogenerated electron-hole pairs.

Fig. 8 (a) Transient photocurrent response plots and (b) Nyquist plots of TiO2, TiO2-x, TiO2 hollow microsphere and TiO2-x hollow microsphere in 0.1 mol·L-1 Na2SO4 aqueous solution.
3.2 Photocatalytic properties
3.2.1 Photocatalytic degradation of methylene blue
The photocatalytic activities of TiO2, TiO2-x, TiO2hollow microsphere and TiO2-xhollow microsphere were evaluated by photocatalytic decomposition of MB in aqueous solution. Fig. 9a shows the photocatalytic degradation curves of MB over 0.2 mg·mL-1of as-prepared samples. TiO2and TiO2hollow microsphere have the poorer photocatalytic activity due to the large band gap making their photoresponsiveness only in the UV range. About 12%-15% of the MB molecules are adsorbed by TiO2-xand TiO2-xhollow microsphere upon stirring for 90 min in the dark. The activity of TiO2-xhollow microspheres is higher than that of TiO2-x. And the degradation rate over it reaches 92.5% under visible light irradiation for 420 min.
Fig. 9b shows the UV-Vis spectra of MB solution (10 mg·L-1)by TiO2-xhollow microsphere (0.2 mg·mL-1) at different irradiation times. From Fig. 9b, MB has four absorption peaks centered at 247, 292, 614 and 664 nm. The absorbance at the four absorption peaks gradually decreases with the increasing of the time, suggesting the MB has been oxidized.

Fig. 9 (a) Photocatalytic degradation curves of MB (10 mg·L-1)over TiO2, TiO2-x, TiO2 hollow microsphere and TiO2-x hollow microsphere at a catalyst loading of 0.2 mg⋅mL-1; (b) UV-Vis absorption spectra of the MB solution by TiO2-x hollow microsphere.
Considering all the above Raman and EPR results, the photocatalytic performance of TiO2-xand TiO2-xhollow microsphere under visible light irradiation can benefit from the presence of oxygen vacancies on the surface, which increases the absorption of visible light by providing inter-band gap states41,42.The oxygen vacancies might cause the generation of Ti3+and bound electrons on Ti4+18,19,34, although the ESR and XPS results do not suggest that Ti3+exists in TiO2-xand TiO2-xhollow microsphere for the extremely low concentration. The synergistic presence of oxygen vacancy and surface disorder makes TiO2-xand TiO2-xhollow microsphere exhibit good photocatalytic activity under visible light irradiation18. The reason for that the activity of TiO2-xhollow microsphere is better than that of TiO2-xis ascribed to the formation of hollow structures. On the one hand, TiO2-xhollow microspheres have a higher specific surface area (shown in Table 1), which increases not only the adsorption of MB (shown in Fig. 9a) but also the number of active sites for catalytic reaction. One the other hand,from Fig. 3b, the ESR signal of TiO2-xhollow microspheres at g-value of 2.003 is stronger than that of TiO2-x, indicating the amount of oxygen vacancies in TiO2-xhollow microsphere is larger than that in TiO2-x. This is for the reason that the formation of hollow microspheres increases the contact areas between H2and TiO2facilitating the hydrogen reduction reaction. As a result, the more oxygen vacancies are formed.
3.2.2 Photocatalytic mechanism
A photocatalytic degradation process over catalysts usually includes two steps. One step is the photoinduced generation of electrons and holes due to excitation of electrons from valence band to conductance band upon irradiation. The other is the formed active species such as electrons, holes, superoxide radicals (•O2-) and hydroxyl radicals (•OH) attacking on MB. In order to figure out the contributions of the active species h+, •O2-and •OH, isopropanol and methanol have been used as the best hydroxyl radical and hole scavenger43, because they have the high-rate-constant to react with hydroxyl radical and hole,repectively.
Form Fig. 10a, the extensive inhibitions in MB degradation are observed when 10% (volume fraction, φ) isopropanol is added to the MB solution to quench •OH, which suggests that•OH plays an essential role in degradation of MB. The degradation rate of MB containing 10% (φ) methanol to quench the photogenerated holes is smaller than that of MB containing 10% (φ) isopropanol implying that h+can oxidize MB. When both 10% (φ) isopropanol and 10% (φ) methanol are added to the MB solution to quench h+and •OH, the degradation rate of MB is close to that of MB containing 10% (φ) methanol at the first 180 min. This implies that •OH radicals are produced from the photogenerated holes. But the degradation rate of MB containing 10% (φ) isopropanol and 10% (φ) methanol is smaller than that of MB containing 10% (φ) methanol after 180 min. To investigate the reason for the slightly decreasing of degradation rate, the photocatalyst after photocatalytic reaction was collected by centrifugation and washed with deionized water for several times. The FTIR spectra of TiO2-xhollow microsphere before and after used were recorded between 500 and 4000 cm-1. As shown in Fig. 10b, the evidence for the existence of the oxidation intermediate product on the surface of TiO2-xhollow microsphere after reaction in MB aqueous solution containing 10% (φ) isopropanol and 10% (φ) methanol comes from FTIR spectra. This implies that the slightly decreasing of degradation rate after 180 min is caused by that the part of the oxidation intermediate product adsorbed on the surface of TiO2-xhollow microsphere inhibits the absorption of light by the photocatalyst surface leading to the decreasing of the amount of photoinduced generation of electrons and holes.

Fig. 10 (a) Effects of different scavenger addition in the photocatalytic degradation of MB; (b) FTIR spectra of TiO2-x hollow microsphere before and after photocatalytic reaction.
Therefore the mechanisms occurring on TiO2-xhollow microsphere surfaces under visible light during MB photodegradation are summarized as follows44. When light interacts with the photocatalyst to generate electrons and holes(Eq. (2)), the holes can react with H2O to generate hydroxyl radicals •OH because the holes locate at more positive potential positions than the H2O/•OH(E0(H2O/•OH) = +1.99 eV/NHE)45,46(Eq. (3)). The electrons in conduction band can be captured by oxygen in the system to produce reactive superoxide radical •O2-(Eq. (4)). And the MB molecules are degradated by h+, •O2-and•OH (Eqs. (5-7)). These reactions are expressed as follows:

3.2.3 Effect of initial MB concentration
The effects of different initial MB concentration on the photocatalytic performance over TiO2-xhollow microsphere (0.2 mg·mL-1) were evaluated under visible light irradiation. As show in Fig. 11a, the degradation rate decreases with increasing MB concentration from 2 to 12 mg·L-1. This is for the reason that a significant amount of visible light absorbed by MB molecules rather than by TiO2-xhollow microsphere leading to the decreasing of the amount of photoinduced generation of electrons and holes30.
The kinetics of photocatalytic degradation of MB usually can be depicted by Langmuir-Hinshelwood model:

where kris the photodegradation rate of MB, t is the illumination time and K is the adsorption coefficient of MB. The Langmuir-Hinshelwood model can be simplified to a pseudo-first-order kinetic equation:

where kappis the apparent rate constant of the pseudo-first-order reaction. Fig.11b shows the plot of ln(c0/c) vs irradiation time t for different initial concentration of MB. As shown in Fig. 11b,it is clear that the data estimated by Eq. (9) do not fit well with the experimental data with R2values from 0.94 to 0.99. This is for the reason that the pseudo-first-order reaction model does not consider the effect of visible light absorbed by MB molecules.The values of kappfor the photocatalytic degradation reactions of MB over TiO2-xhollow microsphere can be estimated from the linear fitting of ln(c0/c) versus t, shown in Fig. 11c. From Fig.11c, the values of kappdecreases with increasing the initial concentration of MB. It is reported that kappis directly proportional to photon fluence and can be estimated by the Lambert-Beer equation:

Fig. 11 (a) Photocatalytic degradation of MB over TiO2-x hollow microsphere at different initial concentration of MB with a catalyst loading of 0.2 mg·mL-1; (b) The plot of ln(c0/c) vs time (t);(c) The relation between c and rate constant.

where I0is the incident light intensity. The coefficient β is determined by Lambert-Beer equation.
Substituting Eq. (10) into Eq. (9):

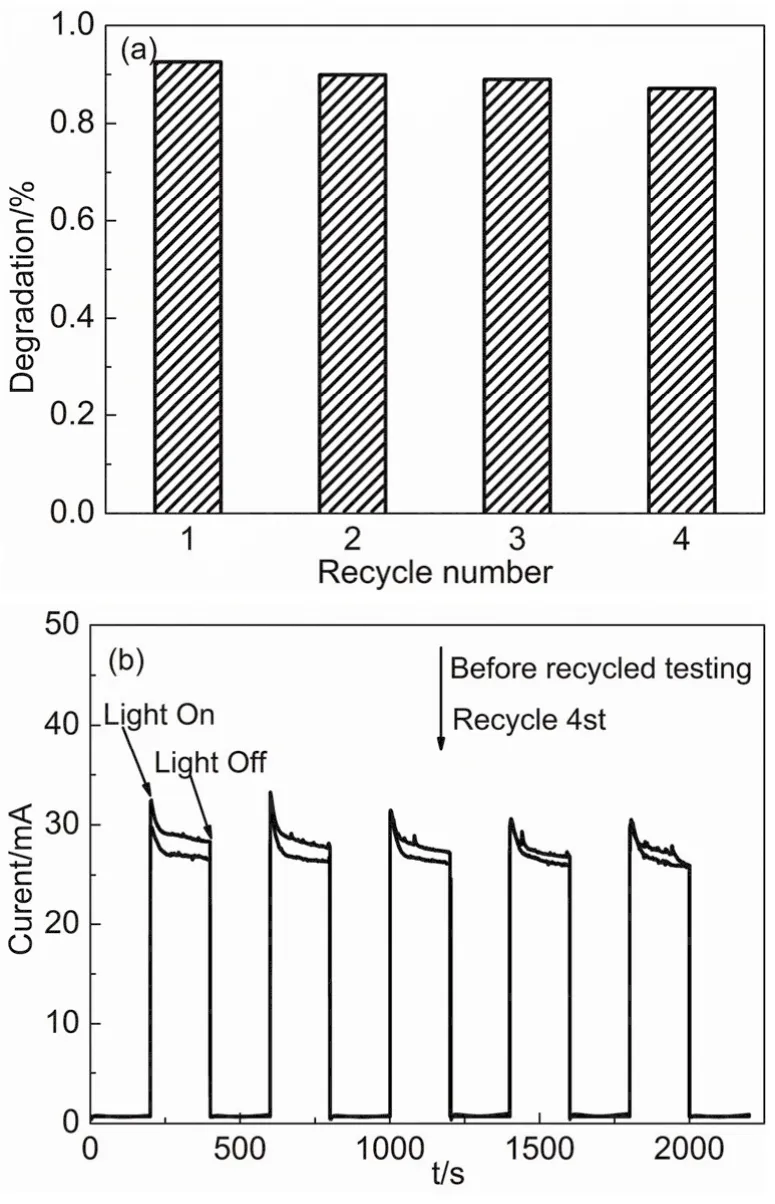
Fig. 12 (a) Recycled testing of photocatalytic activity over 0.2 mg·mL-1 of TiO2-x hollow microsphere; (b) Transient photocurrent response plots before and after photocatalytic reaction.
It is difficult to obtain the solution of Eq. (11). So, Runge-Kutta method was used to obtain the numerical solution of Eq.(11). Fig. 11a shows the calculated results by Eq. (11) at different initial concentration of MB. It is clear that the data estimated by Eq. (11) fit well with the experimental data. The values of the rate constant kaare also shown in Fig. 11c. From Fig. 11c, it can be seen that kappdecreases with the increasing of initial concentration of MB, while kadoes not change with the initial concentration of MB. This indicates that kappis affected by the light absorption properties of MB because the increasing of initial concentration of MB will lead to the increasing of the amount of visible light absorbed by MB molecules rather than by TiO2-xhollow microsphere. This results in a reducing in the TiO2-xhollow microsphere photocatalytic activity and the rate constant kapp30. The rate constant kais different from kapp, which does not relate to the light absorption properties of MB. The reason is that the effect of visible light absorbed by MB molecules has been represented by Eq. (11). The result shows that Eq. (11) can estimate the photocatalytic degradation process of dye more preferable than pseudo-first-order kinetic equation.The rate constant kadescribes the process of photocatalytic degradation of dye more effectively because it does not depend on the initial concentration of dye.
3.3 Stability of TiO2-x hollow microsphere
The recyclability of the photocatalysts is also an important factor to measure their practical application potential. The stability of TiO2-xhollow microsphere was evaluated by recycling test of photocatalytic activity over 0.2 mg·mL-1of TiO2-xhollow microsphere under visible light irradiation. As shown in Fig. 12a, the degradation efficiency of MB decreases from 92.5% to 87.1% after four recycles, and the photocurrent of TiO2-xhollow microsphere after four cycles is close to that before used shown in Fig. 12b. All these indicate a good stability of TiO2-xhollow microsphere during the photocatalytic reaction.But the color of the catalyst is slight blue after the reaction indicating that MB has been adsorbed on the surface of TiO2-xhollow microsphere. The slight decrease in the photodegradation rate may result from the MB adsorbed on the surface of the catalyst reducing the absorption amount of light by TiO2-xhollow microsphere.
4 Conclusions
The defective TiO2-xhollow microspheres were prepared by reducing TiO2hollow microspheres in an H2atmosphere. The photocatalytic performances of as-prepared samples were evaluated based on photocatalytic degradation of MB solution under visible light. The mechanisms for enhancing the photocatalytic activity and the degradation of MB occurring on the TiO2-xhollow microspheres surface were discussed, and the kinetic model of photocatalytic degradation of dye was proposed. The results show that the higher photocatalytic performance of TiO2-xhollow microsphere should benefit from the presence of oxygen vacancies on the surface. Compared to TiO2-x, the better activity of TiO2-xhollow microsphere is ascribed to the formation of hollow structures with more active sites and higher specific surface area. TiO2-xhollow microsphere also exhibits the good stability, which can be recycled several times. The MB molecules are photodegraded by the photogenerated h+, •O2-and •OH, and •OH caused only by photogenerated holes plays an essential role in degradation of MB. Compared to the pseudo-first-order kinetic model, the proposed kinetic model of photocatalytic degradation of dye gives a more realistic description in the process of photocatalytic degradation of MB because the calculating results fit better with the experimental data. The rate constant in the proposed model describes the process of photocatalytic degradation of dye more effectively because it does not depend on the initial concentration of dye.
