Gene Knockdown with RNA Interference
2019-08-30TingyiSHIHaimingLI
Tingyi SHI ,Haiming LI
1 Department of Biology,Southern University of Science and Technology
ABSTRACT:RNA interference (RNAi) is a widely used molecular method that suppresses specific gene expression by neutralizing mRNA.It is very helpful in research in producing knockdown cell lines or organisms to study gene functions.Here,we use RNA interference method to knockdown ADAM 12,a metalloprotease that binds insulin growth factor binding protein-3 (IGFBP-3),with short interference RNA (siRNA) by electroporation in 3T3-L1 cell line.Using quantitative polymerase chain reaction (qPCR),it is shown that RNAi method significantly knocks down ADAM12 gene expression to 25% and even 30% relative to original levels.This experiment presents a powerful and e cient RNAi method in suppressing gene expression and encourages us to continue exploring a more optimized RNAi method at the same time.
INTRODUCTION
Gene knockdown is a useful experimental technique for research by reducing the expression of one or more genes.It can be achieved by ways such as direct gene modification or introducing complementary transcripts.RNA interference,a biological process that inhibits gene expression by neutralizing target mRNA molecules,has developed into a precise and efficient gene suppression technique.
RNA interference is initiated by the enzyme dicer,which cleaves the long double-stranded RNA (dsRNA) into a short 21 bps small interference RNA (siRNA).siRNA is then unwounded into two single strand RNAs:the passenger RNA and the guide RNA.The passenger RNA is degraded while the guide RNA is incorporated into a complex called RNA-induced silencing complex (RISC).As the guide RNA pairs with its complementary mRNA sequence,the catalytic component of RISC cleaves that specific gene,resulting in specific gene silencing.Therefore,by introducing specific designed siRNA,the gene of target can be specifically silenced in the RNAi technique.
Quantitative polymerase chain reaction (qPCR) is a method based on PCR to quantify the amplification of targeted DNA molecule during the PCR process.Two commonly used methods to detect PCR products include non-specific fluorescence dye that intercalates with double-stranded DNA and a specific DNA probe that produces fluorescence only after pairing with its complementary sequence.A threshold fluorescence value is set when the DNA is detectable and the corresponding number of cycle is called threshold cycle(Ct).A greater Ct implies a smaller number of initial DNA concentration.Therefore,qPCR can be used for quantification of DNA according to this model.
Electroporation is a widely used method for transfection.The electrical field increases the permeability of cell membrane,allowing the introduction of the chemicals,drugs or DNA (1).The electroporation is very efficient in transfection,approximately ten times more than chemical method.In this experiment,electroporation is used to introduce siRNA into 3T3-L1 cell lines.
ADAM 12,a metalloprotease that binds insulin growth factor binding protein-3 (IGFBP-3),appears to be an effective early Down syndrome marker.ADAM12 has also been implicated in the development of pathology in various cancers,hypertension,liver fibrogenesis,and asthma.
This gene encodes a member of the ADAM (a disintegrin and metalloprotease)protein family.Members of this family are membrane-anchored proteins,and have been implicated in a variety of biological processes involving cell-cell and cell-matrix interactions,including fertilization,muscle development,and neurogenesis.
Here,we knockdown the ADAM12 gene with RNA interference by introducing a designed siRNA into the 3T3-L1 cell line.By examining the knockdown efficiency with quantitative PCR (qPCR),we show that ADAM12 is efficiently knocked down by RNAi experiment..
MATERIALS AND METHODS
Cell culture
The 3T3-L1 cells are maintained at 37C in a humidified CO2 incubators(HF90).The standar culture medium is Dulbeccos modified Eagles medium(DEME) with serum.Phosphate buffered saline (PBS) without Ca2+ and Mg2+and Trypsin/EDTA solution are used for subculturing.Centrifuge (eppendorf,centrifuge 5840R),safe hood (HFsafe-1200) and TC20 automated cell counter are used for culturing.
Target gene selection
ADAM12 gene is selected based on the following criteria and some basic information from some articles (3).First,this gene must be highly expressed in 3T3-L1 to ensure an obvious result.Second,the silencing of this gene must not impede the normal growth of the gene.Third,this gene must be expressed in the pre-adipocyte state since our cells will not be differentiated.Fourth,choose a gene that has been studied in 3T3-L1 cell line to better understand this gene before experimenting.
To whom correspondence should be addressed.Tel:+8617688755895;Email:11612415@mail.sustc.edu.cn
© 2018 The Author(s)
This is an Open Access article distributed under the terms of the Creative Commons Attribution Non-Commercial License(http://creativecommons.org/licenses/ by-nc/2.0/uk/) which permits unrestricted non-commercial use,distribution,and reproduction in any medium,provided the original work is properly cited.
“NAR-sample” — 2019/4/30 — 0:01 — page 2 — #2
2 Nucleic Acids Research,2019,Vol.37,No.1

Figure 1.Design diagram of gene structure
Besides,following databases are used in the process.Pubmed is used for paper reading.Uniprot and NCBI nucleic acid databases are used for checking gene information such as gene description and expression level in 3T3-L1,etc.
siRNA design
Candidate siRNA are firstly attained from the website rnaidesigner.thermofisher.com.Sequences are then blasted to check if they mismatch to other genes.Matches below 16 bps are tolerable.Here are two selected siRNAs.(see Table 1)
Primer design
Candidate primers for ADAM12 are attained from NCBI primer blast databases.Primerbank and the website genome.ucsc.edu are used for more information of the primers and the ADAM12 gene.Here are primer lists and the design diagram for ADAM12 gene.(see table 2) (see figure 1)
Primer examination with qPCR
A standard curve of cDNA initial concentration versus threshold cycles(Ct) are made with qPCR to evaluate the efficiency of designed ADAM12 primers.The slope of this curve allows us to calculate the efficiency of amplification according to the equation E=10-1/slope-1,which is derived from the equation Rn=Rb+Xo (1+e)nRs with the substitution of Ct (Rn is the Fluorescence intensity(FI) in n cycle.
Table 1.Sequence of siRNA
Rb is the background FI,Xo is the initial DNA concentration,e is the amplification efficiency,Rs is the intensity per DNA).qPCR is conducted using TB GreenTMPremix Ex TaqTMII (Tli RNaseH plus) with Applied Biosystems 7500 Fast-Real-Time PCR system.Here is the protocol for qPCR and qPCR program.(see table 3)(see table 4)Besides,a melting curve program is also conducted to test the specificity of the primers.
siRNA transfection
siRNA was transfected into 3T3-L1 cell line by electroporation with NeonTM Transfection System (see table 5).DEPC water is used to dissolve siRNA,which can inhibit RNAase.Optic-MEM that does not contain serum is used in the process to avoid adverse effect of serum during electroporation.R buffer is used during electroporation.There are four groups,positive control groups with siRNA of GAPDF,negative control groups with control siRNA,two experimental groups with two designed siRNA of ADAM12 gene.Each group is tri-replicated.Incubate the cells for 48h.
RNA extraction and reverse transcription
Cells that have been transfected are lysed with trizol.RNA is extracted using GTC-acid phenol method.RNA quality is examined with gel electroporesis (1%gel,150V,15min) and using NanoDrop Spectrophotometer.Reverse Transcription is conducted with Primerscript TM RT reagent Kit(Takara Cat.#RR036A) by PCR machine(BIO-RAD) with the following program (see table 6).
Relative quantification of mRNA
qPCR is done with the same program as the primer examination (see table 3) (see table 4).18sRNA is tested as the reference.GAPDH is tested as positive control.ADAM12 gene is tested to evaluate the knockdown efficiency.
Statistical analysis
The relative expression level is measure by 2-Ctmethod.Ct=Ct2-Ct1,in which Ct1= Ct(target gene)-Ct(18sRNA),Ct2(test)= Ct(target gene)-Ct(18sRNA).Data is then analyzed with Office Excel with One-way Analysis of Variance.Add Asterisk according to the P-value.

Table 1.Sequence of siRNA
RESULTS
Designed primers of ADAM12 gene have high efficiency and specificity
According to the standard curve obtained from qPCR (seeˆ
figure 2)with two different primers and the equation E=10(-1/slope) -1 mentioned above,we get efficiency of 105.44% and 103.03% respectively,which is within the qualified range of 90% -110%.
Sample RNAs are extracted with high quality
We successfully extract total RNA from each sample.The NanoDrop results are listed below(see table 7).From the concentration,we can see that RNA are extracted with high concentration and that most A260/A280 ratio are 1.8,indicating that most of our samples are pure without proteins and DNA contamination.Besides,from the electrophoresis gel image,three bands appear for each sample,which are 28sRNA,18sRNA and 5s/5.8s RNA respectively (see figure 3).Both of these two results indicating that our sample RNA are extracted with high quality and should be suitable for future experiment.

Table 3.PCR protocol for primers examination

Nucleic Acids Research,2019,Vol.37,No.1 3

Figure 2.Amplification standard curve results.(MAX-MIN column is used to test the difference within each group) and Standard curve forprimer1&2
ADAM12 gene is significantly knocked down with siRNAs
As we have examined our designed primers with qPCR and the result show that both primers are good for amplification,we randomly choose the PriADAM12-1 as the primer in this qPCR test.From qPCR result,we find that siRNA-1 has silenced ADAM12 expression level to only 25% of negative control while siRNA-2 silenced it to only 30% (see figure4).The result shows that both siRNAs significantly silence ADAM12 gene expression level,with a higher efficiency of siRNA-2 than siRNA-1.Besides,the positive control group of GAPDH also has significant reduced expression level,which is 15.0% comparing with negative control group (see figure 5).The melting curves for these samples show high specificity of primers and no off-target problems (see figure6&figure 7).
Besides,From the melting curve of both primers,it implies that the primers have high specificity,excluding the primer-dimers possibility and off-target problems.(see figure 8).
Altogether,these results show that the whole process of gene knockdown with RNA interference is successfully performed.Most importantly,this project shows us that RNAi is indeed a highly efficient and convenient method that can achieve ideal knockdown of a specific gene of interest,which can benefit the researchers in all fields of study.
4 Nucleic Acids Research,2018,Vol.37,No.12
DISCUSSION
In this experiment,we use RNAi method to knockdown our target gene ADAM12 with designed siRNA.The ADAM12 gene is significantly knocked down to 25% and even 30% of the negative control group according to qPCR result.This result implying that RNAi is a very powerful tool in silencing specific gene by targeting their mRNA.
Though RNAi technique has been widely used and fully developed,several technical issues regarding the optimization of RNAi experimental design shall be discussed here.
Transient siRNA versus stable siRNA
As in this experiment,gene silencing brought by direct transfection of siRNA is generally transient.Gene expression will recover after 96-120 hours or 3-5 cell divisions after transfection.This is not due to the degradation of siRNA but the dilution brought by the division of cells (4).Therefore,results are needed to examine within this period.However,stable siRNA is sometimes needed if the phenotype develops over a long period of time.Luckily,scientists have developed a stable system by introducing plasmids that express specific siRNA,which can last for more than two months (5).Thus,researchers can choose either transient or permanent siRNA according to their research target and the materials.
Method for transfection
In order to ensure a high transfection rate in this experiment,electroporation is used.However,electroporation can be toxic to cells since electric field pulses can bring oxidative stress to cells and even affect gene expression profile (6).Ways to choose an appropriate method for delivery,though,may require researchers to try several reagents and methods,adjust the cell density,reagent concentration,or even the medium and antibiotics used during transfection.
There are still many to be considered in designing a successful RNA interference experiment,as different kinds of conditions can lead to a variety of knockdown effects.Since general guidance can be limited,to optimize a experiment,all that researchers need is to repetitively try and figure out the best conditions for a specific experiment.
ACKNOWLEDGEMENTS
I am thankful for Teacher Yue Sheng and Yakun Song for kind and helpful instructions and experimental preparations on this project.I am also thankful for my partner Yueyan Wu for discussing the project,conducting experiments and analyzing the data with me.Finally,I would like to thank SUSTech for providing equipments and materials used in this experiment.
Supplementary data available
Conflict of interest statement.None declared.

Table 5.Program for electroporation

Figure 3.Gel image of extracted RNA:the sample sequence from left to right is NC-1,NC-2,NC-3,PC-1,PC-2,PC-3,1-1,1-2,1-3,2-1,2-2,2-3

Figure 4.Relative expression level of ADAM12 by qPCR.The P-value of T1-antiADAM and T2-antiADAM are both < 0.0001

Table 6.Reverse Transcription Program
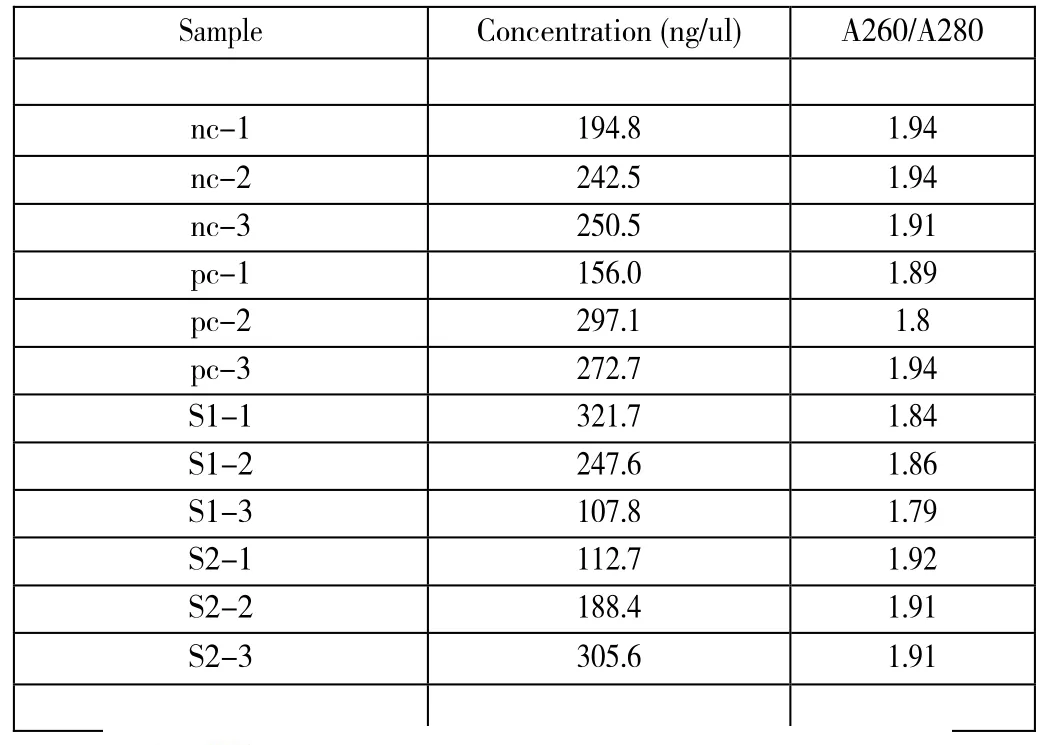
Table 7.NanoDrop results of extracted RNA

Figure 5.Relative expression result of GAPDH as positive control.The P-Value is <0.001
6 Nucleic Acids Research,2018,Vol.37,No.12
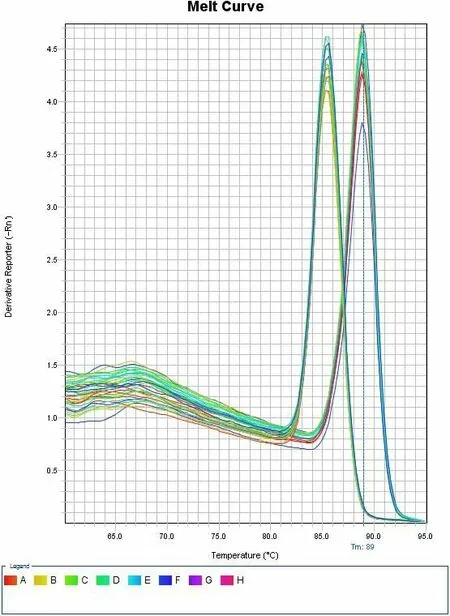
Figure 6.Melting curve for positive control group:GAPDH and corresponding 18sRNA qPCR samples.Left peak belongs to GAPDH qPCR products and right peak belongs to 18sRNA qPCR products.One peak for a single curve indicates highly specific primers.

Figure 7.Melting curve for experimental groups:ADAM12 qPCR products and corresponding 18sRNA qPCR products.Left peak belongs to ADAM12 products and right peak belongs to 18sRNA products.One peak for a single curve indicates highly specific primers.

Figure8:Melting curve for two primers:left peak belongs to primer 2,right peak belongs to primer 1.One peak for a single curve indicates highly specific primers.