The value of serum metabolomics analysis in predicting the response to cardiac resynchronization therapy
2019-08-19MengRuoZHUZibireFulatiYangLIUWenShuoWANGQianWUYanGangSU
Meng-Ruo ZHU, Zibire Fulati, Yang LIU, Wen-Shuo WANG, Qian WU, Yan-Gang SU,
Hai-Yan CHEN1,#, Xian-Hong SHU1, 2,#
1Department of Echocardiography, Zhongshan Hospital, Fudan University, Shanghai Institute of Cardiovascular Diseases, Shanghai, China
2Department of Cardiology, Zhongshan Hospital, Fudan University, Shanghai Institute of Cardiovascular Diseases, Shanghai, China
3Department of Cardiac Surgery, Zhongshan Hospital, Fudan University, Shanghai Institute of Cardiovascular Diseases, Shanghai, China
4Shanghai Center for Bioinformation Technology, Shanghai, China
Abstract Objective To construct a prediction model based on metabolic profiling for predicting the response to cardiac resynchronization therapy (CRT). Methods Peripheral venous (PV) and coronary sinus (CS) blood samples were collected from 25 patients with heart failure (HF) at the time of CRT implantation, and PV blood samples were obtained from ten healthy controls. The serum samples were analyzed by liquid chromatography-mass spectrometry (LC-MS). As per the clinical and echocardiographic assessment at the 6-month follow-up, the HF patients were categorized as CRT responders and non-responders. Results HF patients had altered serum metabolomic profiles that were significantly different from those of the healthy controls. Differential metabolites were also observed between CRT responders and non-responders. A prediction model for CRT response (CRT-Re) was constructed using the concentration levels of the differential metabolites, L-arginine and taurine. The optimal cutoff value of the CRT-Re model was found to be 0.343 by ROC analysis (sensitivity, 88.2%; specificity, 87.5%; Area under curve (AUC) = 0.897, P = 0.002). The concentration levels of the differential metabolites, L-arginine and lysyl-gamma-glutamate, in PV serum were significantly correlated with that in CS serum (r = 0.945 and 0.680, respectively, all P < 0.001). Conclusions Our results suggest that serum-based metabolic profiling may be a potential complementary screening tool for predicting the outcome of CRT.
Keywords: Biomarker; Cardiac resynchronization therapy; Heart failure; Metabolomics; Serum
1 Introduction
The usefulness of cardiac resynchronization therapy (CRT) in patients with heart failure (HF) is well established.[1]Unfortunately, approximately one-third of the patients fail to respond to CRT, which adversely affects the utility and cost-effectiveness of this therapy.[2]Given its invasive nature and up-front expense, more powerful baseline predictors need to be developed to identify patients most likely to benefit from CRT.
The metabolites present reflect the biochemical reactions that have taken place in the body, and changes in metabolites occur in response to biological events and reflect the real-time pathophysiological state. Therefore, it is possible to identify biomarkers of biological events by focusing on the changes in metabolites, and provide a predictive platform for relevant early warning signals. Through metabolomics, we can quantitatively analyze metabolites in living organisms, explore the relationship between metabolites and pathophysiological changes, and further correlate these results with the clinical phenotype of diseases.[3-5]
The serum-based metabolic profiling method has recently emerged as a powerful analytical tool for the identification of disease-related biomarkers and pathways that can be used to develop new diagnostic and treatment methods.[6]Therefore, the purpose of this prospective study was to explore the abnormal metabolic profile in HF patients, and then to evaluate their relevance as markers for CRT response.
2 Methods
2.1 Study population
Twenty-five consecutive HF patients who were scheduled to undergo CRT were prospectively enrolled in this study from January 2018 to May 2018. The indication and class of recommendation for CRT as per the 2016 European Society of Cardiology (ESC) guidelines[7]were as follows: symptomatic HF patients with a QRS duration ≥ 130 ms and left ventricular ejection fraction (LVEF) ≤ 35%, in NYHA functional class II-IV despite optimal medical treatment. Patients were excluded from the study for the following reasons: narrow QRS, right bundle branch block (RBBB), a history of cardiac surgery, previous acute myocardial infarction, and absence of clinical follow-up. Left bundle branch block (LBBB) was diagnosed according to the criteria proposed by the 2013 ESC guidelines[8]of the Class 1 recommendation for CRT, namely, a wide QRS duration with QS or rS in V1, broad (frequently notched or slurred) R wave in leads I, aVL, V5, or V6, and absence of q waves in leads V5 and V6. Intraventricular conduction delay was diagnosed as non-specific QRS morphology that did not fit the criteria for LBBB and RBBB.[9]Ten healthy controls matched for age and sex, who came to our hospital for a health check-up, without documented cardiovascular diseases and history of cardiovascular medication, and with normal cardiac function, were selected for the study.
This study was approved by the medical ethics committee of our hospital and written informed consent was obtained from all the subjects who participated in this study.
2.2 Baseline and follow-up evaluation
All HF patients underwent baseline and 6-month follow-up evaluations. The clinical characteristics were obtained from the electronic medical record. Electrocardiographic assessment including calculation of the QRS duration and determination of the morphological characteristics of the waves was also conducted. The premature ventricular contraction (PVC) burden was documented from a 24-h period of Holter monitoring within one week. Patients who had > 10,000 PVC in a 24-h period were offered radiofrequency ablation of the PVC after they were informed of the benefits and risks of the procedure and following their consent for the procedure. Transthoracic echocardiography was performed according to the American Society of Echocardiography guidelines:[10,11]left ventricular end-diastolic volume (LVEDV), left ventricular end-systolic volume (LVESV), and LVEF measured by using biplane Simpson's method. Septal-posterior wall motion delay (SPWMD), i.e., the time delay between the septum and posterior wall transiting from an inward to outward motion, was measured by color tissue Doppler M-mode from the parasternal short- axis view. Interventricular mechanical delay (IVMD), which is defined as the difference between left ventricular (LV) and right ventricular (RV) pre-ejection intervals, was measured as the time from the onset of QRS to the onset of LV ejection versus RV ejection in the LV and RV outflow tracts, respectively. The Yu index was determined as the standard deviation of time from QRS to peak systolic velocity in the ejection phase for 12 LV segments (6 basal and 6 middle) from three standard apical views in tissue Doppler imaging. According to the findings of clinical and echocardiographic assessments at the 6 month follow-up, patients were allocated to two groups: (1) responders (patients with decreases in NYHA class ≥ one grade and a reduction of LVESV ≥ 15%);[12,13]and (2) non-responders (patients with no improvement in the results of clinical and echocardiographic assessments or who were re-hospitalized or underwent cardiac transplantation or died for or with worsening HF at follow-up after CRT implantation).[14]
2.3 Metabolomics analysis
2.3.1 Collection of blood samples
Peripheral venous and coronary sinus blood samples were collected from HF patients at the time of CRT implantation. Peripheral venous blood samples were also obtained from 10 healthy controls who had visited the hospital for a health check-up. Each whole-blood sample was centrifuged at 4°C at 3000 r/min. for 15 min. Aliquots of 500 μL were finally transferred to cryovials, frozen, and stored at -80°C until metabolomics analysis.
Frozen serum samples were thawed on ice and vortexed thoroughly. Four hundred microliters of methanol/acetonitrile (1: 1, v/v, prechilled to -20°C) solvent was added to 100 μL serum. The mixture was vortexed for 30 s and then incubated for 30 min at -20°C. Subsequently, the mixture was centrifuged at 12,000 r/min for 15 min at 4°C. The supernatant (400 μL) was collected and divided into 200 μL and 100 μL aliquots, and then dried under vacuum. The residues were reconstituted for analysis using hydrophilic interaction liquid chromatography (HILIC) and reversed- phase liquid chromatography (RPLC) coupled to mass spectrometry, respectively. The LC-MS/MS analysis conducted is detailed in the Supplementary Material. Quality control (QC) samples were prepared by mixing equal volumes (20 μL) of each serum sample. The QC sample was periodically injected with batches of 10 test samples throughout the analytical run.
2.3.2 Data processing and analysis
The raw data were acquired using the software Xcalibur (version 3.1, Thermo Scientific) and then converted to mzXML files with MSConvert of ProteoWizard (version 3.0). The peak identification, peak filtration, peak alignment, and isotope annotation were performed using the XCMS program (version 3.0.0) with CAMERA (version 1.34.0) in R package version 3.4.3 to obtain the data matrix containing mass-to-charge (m/z), retention time, integrated peak intensity, and isotope annotation.
Each dataset was imported into SIMCA (V13.0, Umetrics, Umeå, Sweden) for further analysis. Principal component analysis and partial least squares discriminant analysis (PLS-DA) were performed to visualize the metabolic alterations between different groups after mean centering and unit variance scaling. Cross-validation was carried out to prevent overfitting (The validation graphs were presented as Figure 1S and the model quality parameters presented in Table 1S were in the Supplementary Material). Student's t-test was used to determine the statistical significance of the variables between the two groups. Metabolites of variable importance of projection (VIP) > 1 and P value < 0.05 were identified as differential metabolites between the two groups. The significant metabolites were identified by MS/MS fragment analysis with databases such as mzCloud, HMDB (http:// hmdb.ca), and lipidmaps (http://www.lipidmaps.org). MetaboAnalyst 4.0 and MBROLE 2.0 were used to identify a variety of functional enrichment analysis and metabolic pathways.
2.4 Model construction for the prediction of CRT response
Binary logistic regression analyses were employed to construct the models for prediction. Significant variables selected in univariate analysis (P < 0.05) were entered into the multivariate logistic regression analysis. The model of prediction accuracy assessment was conducted by constructing a receiver operating characteristic (ROC) curve. Probability values were yielded from the prediction models, which were subsequently utilized as new input variables for the ROC curve analysis. The optimal cut-off value, which combined the higher value of specificity plus sensitivity, was identified from the ROC curve. A two-sided P value < 0.05 was accepted as indicating statistical significance.
2.5 Statistical methods
Clinical and echocardiographic characteristics were expressed as the mean ± SD for continuous variables and as the number (percent) for categorical variables. Continuous variables of two groups were compared using the Student's t-test (for normally distributed) and Wilcoxon test (for non-normally distributed). Categorical variables were compared by the Chi-squared test or Fisher's exact test as appropriate. Correlations between two variables were analyzed using Pearson's correlation test. All data were analyzed using SPSS version 24.0 (SPSS Inc, Chicago, IL, USA).
3 Results
In this study, 10 healthy subjects (61.8 ± 8.8 years, 25% female, 74.3 ± 9.5 beats/min) and 25 HF patients scheduled for CRT (60.3 ± 11.9 years, 20% female, 75.6 ± 16.3 beats/min) were included as the control and test groups, respectively. At the 6-month follow-up, 17 (68%) of the 25 HF patients were classified as responders, while 8 patients (32%) were classified as non-responders. Clinical and echocardiographic characteristics of CRT responders versus non-responders are summarized in Table 1. No significant differences were observed in the baseline variables between the two groups, while at the 6-month follow-up, the responders showed a significant improvement in NYHA class and echocardiographic findings compared to the non-responders.
3.1 Abnormal metabolomic profile of HF patients
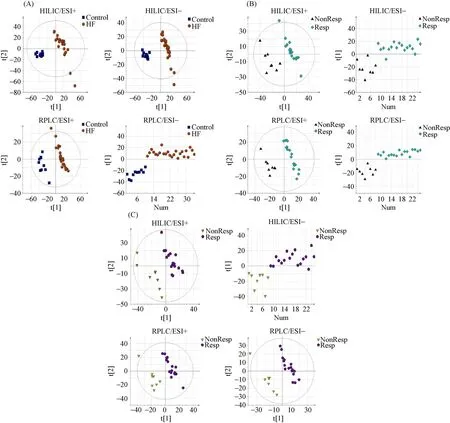
The PLS-DA score plots showed a clear separation in the peripheral venous blood under four modes between the HF patients and healthy controls (Figure 1A). Differential metabolites that met the selection criteria of VIP > 1 and P value < 0.05 are listed in Table 2S in the Supplementary Material. These metabolites were selected to be analyzed further for their possible roles in the pathogenesis of HF. Metabolic pathways most affected in HF, as deduced from an altered serum metabolomic profile, are shown in Figure 2A.
3.2 Differential metabolites between CRT responders and non-responders
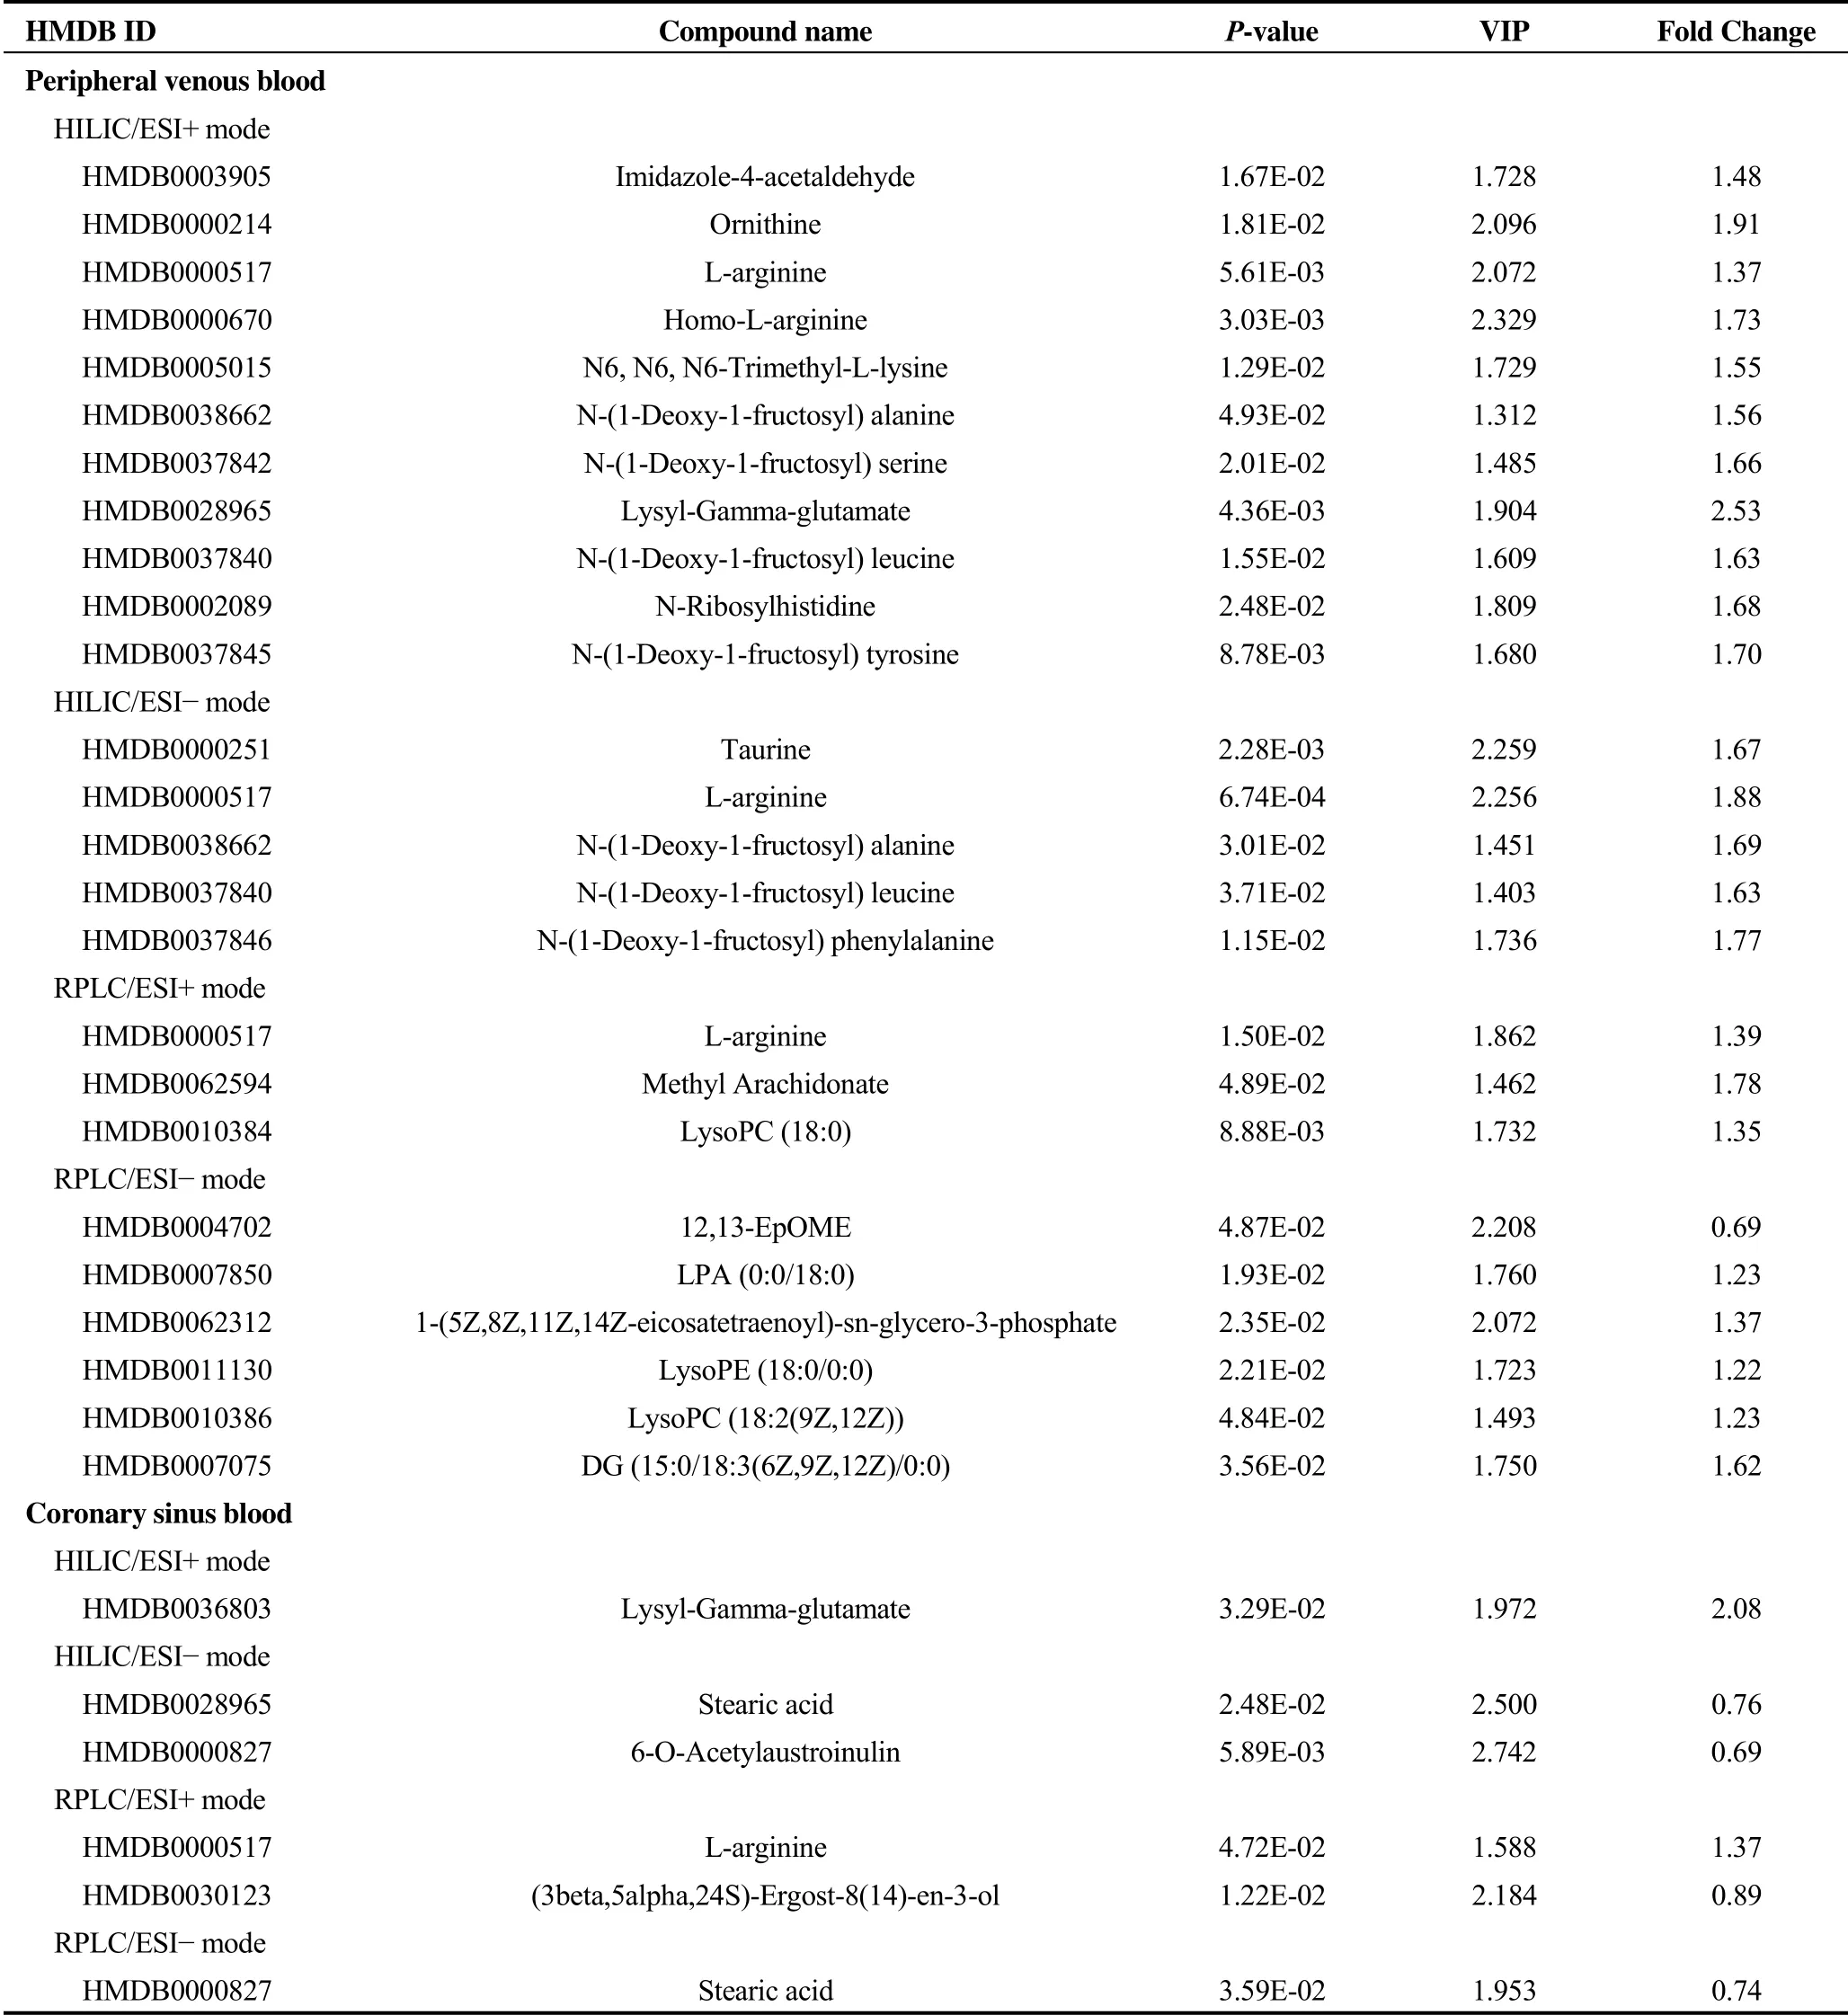
The PLS-DA score plots showed a clear separation in the peripheral venous blood under four modes between CRT responders and non-responders (Figure 1B). Differential metabolites that met the selection criteria of VIP > 1 and P value < 0.05 are listed in Table 2. These metabolites were selected to be analyzed further for their clinical implications in the potential mechanism underlying the response to CRT. The most affected metabolic pathways, as deduced from differential metabolites, are shown in Figure 2B.

Table 1. Clinical and echocardiographic characteristics of CRT responders versus non-responders at baseline and 6-month follow-up.

Figure 1. PLS-DA score plots between two groups under four modes. (A): Peripheral venous blood from HF patients and healthy controls; (B): peripheral venous blood from CRT responders and non-responders; and (C): coronary sinus blood from CRT responders and non-responders. The data points (A) representing the HF patient group were shown to be clustered together and separated from those of the control group in both the PLS-DA score plots constructed for HILIC/ESI+, HILIC/ESI-, RPLC/ESI+ and RPLC/ESI- mode. Similarly, the metabolic profiles of peripheral venous blood (B) and coronary sinus blood (C) from CRT responders exhibited a pattern distinct from non-responders under four modes, which characterized by changes in the levels of certain serum metabolites (see Table 2). The validation graphs of Figure 1 PLS-DA score plots were presented as Figure 1S and the detailed model quality parameters were presented in Table 1S in the Supplementary Materials. CRT: cardiac resynchronization therapy; HF: heart failure; PLS-DA: partial least squares discriminant analysis.
3.3 Identification of the best predictors of CRT response based on logistical regression analysis
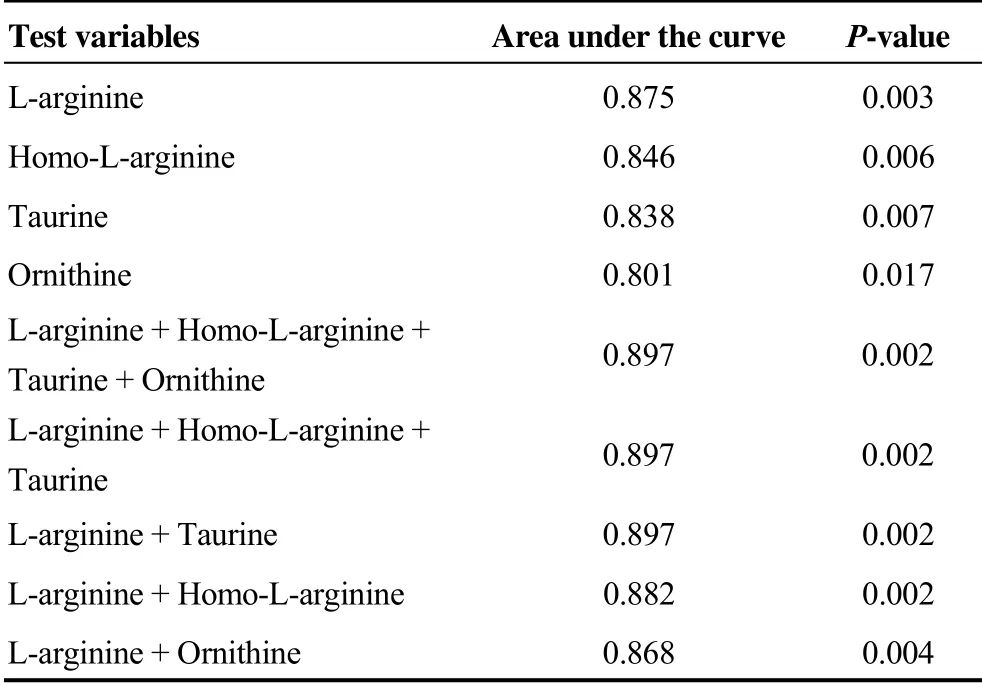
Of all the differential metabolites observed in the peripheral venous blood between CRT responders and non-res- ponders, only four metabolites were found to be significant in the univariate analysis (P < 0.05), namely, L-arginine, Homo-L-arginine, taurine, and ornithine, suggesting that they had a potentially predictive value and could be used to generate prediction models for CRT response based on the multivariate logistical regression analysis. The predictive capacities of each individual metabolite and the different combined prediction models were assessed by ROC curve analysis and compared to each other (Table 3). The individual area under curve (AUC) values of L-arginine, Homo-L-arginine, taurine, and ornithine were calculated to be 0.875, 0.846, 0.838, and 0.801, respectively, which were lower than that of the combined prediction model involving these four metabolites, calculated to be 0.897. Further analysis showed that the combination of L-arginine and taurine had comparable prediction accuracy to the combination of the four metabolites. When having the same prediction accuracy, it is generally best to use as few metabolites as possible to construct the combined prediction model. Therefore, the optimal prediction model was that incorporating only the levels of L-arginine and taurine, which were expressed using the following equation after the raw data of concentration levels were normalized by dividing them with the 8thpower of 10:

Table 2. Differential metabolites between CRT responders and non-responders.

Figure 2. Metabolic pathways as deduced from differential metabolites of peripheral venous blood between HF patients and healthy subjects (A), as well as between CRT responders and non-responders (B). All matched pathways are plotted according to P values from pathway enrichment analysis and pathway impact values from pathway topology analysis. Color gradient and circle size indicate the significance of the pathway ranked by p value (yellow: higher P values and red: lower P values) and pathway impact values (the larger the circle the higher the impact score). Only the significantly affected pathways with low P value and high pathway impact score are shown. CRT: cardiac resynchronization therapy; HF: heart failure.

Table 3. Receiver operating characteristic analysis for predicting CRT response.
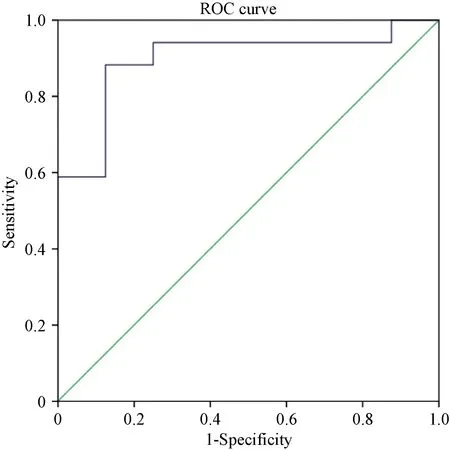
Prediction Model (CRT-Re) =2.348 × L-arginine + 4.946 × taurine - 5.988 ROC analysis identified the optimal cutoff value of this prediction model as 0.343 (sensitivity, 88.2%; specificity, 87.5%; AUC = 0.897, P = 0.002) in predicting response to CRT (Figure 3).

Figure 3. ROC curve of prediction model (CRT-Re) for predicting response to CRT. CRT: cardiac resynchronization therapy; ROC: receiver operating characteristic.
3.4 Analysis of the origin for some metabolite biomarkers
The PLS-DA score plots also showed a clear separation in the coronary sinus blood under four modes between CRT responders and non-responders (Figure 1C). Differential metabolites that met the selection criteria of VIP > 1 and P value < 0.05 are listed in Table 2. The differential metabolites present both in peripheral venous and in coronary sinus blood were L-arginine and lysyl-gamma-glutamate. Concentrations of L-arginine and lysyl-gamma-glutamate in peripheral venous serum were significantly correlated with those in contemporaneous coronary sinus serum taken at the time of CRT implantation, suggesting a cardiac origin for L-arginine and lysyl-gamma-glutamate (r = 0.945 and 0.680, respectively, all P < 0.001) (Figure 2S in the Supplementary Material).
4 Discussion
The present study was designed to analyze the abnormal metabolic profiles in patients with HF, and to explore their relevance as markers for CRT response so as to provide a complementary tool for guiding selection of patients scheduled for CRT. The main findings were that (1) peripheral venous blood exhibited an abnormal metabolomic profile in patients with HF; (2) concentration of many identified metabolites was significantly different between CRT responders and non-responders at baseline, thus, we constructed a prediction model for CRT outcome using two differential metabolites; and (3) further analysis suggested the cardiac origin for some differential metabolites present in peripheral venous blood. The key metabolites were mapped to biochemical metabolic pathways (Figure 3S in the Supplementary Material), which could show the network and interaction of the metabolic pathways being the background of metabolites investigated in this study.
4.1 Metabolic disturbances in patients with HF
Emerging metabolomic analysis permits simultaneous evaluation of multiple metabolites and metabolic pathways.[3,4,15]A comprehensive metabolomic evaluation in our study indicated that HF patients have clinically relevant disturbances in concentration of circulating metabolites, which improved the understanding of HF pathogenesis. The abnormal metabolomic profiling revealed that differential metabolites were mainly clustered in several key pathways, including fatty acid metabolism, glycerophospholipid metabolism, arginine and proline metabolism, histidine metabolism and biosynthesis of unsaturated fatty acids, which might be perturbed by the development of HF. This result also suggested the deficiency in energy production in patients with HF, because fatty acids are the primary energy source for myocardial cells and have been proposed to be associated with diagnosis and prognosis of cardiovascular diseases in many studies.[16,17]Purine is a key component of adenosine triphosphate (ATP), therefore, a decrease in the ATP level caused by redox imbalance and deficient substrate oxidation resulted in an increase in the concentration of end-product of purine metabolism, such as urate.[18]This also indicated impaired oxidative metabolism, which highly correlated with disease severity of HF.[19,20]Therefore, urate has been suggested as a marker of HF.[21,22]Our findings are consistent with those of previous studies. On one hand, higher levels of serum urate, glutamate, proline, and urea indicated alterations in Krebs cycle, amino acid metabolism, and nucleotide degradation. On the other hand, the metabolomic profile of patients with HF also revealed lower levels of serum glycine, histidine, and serine, suggesting that mitochondrial dysfunction and energy deficiency are the significant metabolic changes in the failing heart.[23,24]Histidine can be converted to glutamate, which enters Krebs cycle as alpha-ketoglutarate to supply energy or enters glutamate-ornithine-proline pathway to supply ornithine. A simultaneous and significant decrease in arginine levels may be associated with nitric oxide (NO) synthesis.[25]In addition to above-mentioned changes, the lipid metabolism was also reduced in patients with HF, which manifested as decreased serum levels of linoleate and myristate.
Other studies have also demonstrated the presence of a specific metabolomic profile in HF patients,[23]but these findings are not entirely consistent with the results from our HF population; this may be owing to different patients' characteristics such as the course and severity of HF or differences in the metabolomic analysis technique used.
4.2 Metabolic biomarker for response to CRT
The serum metabolic profiles of CRT responders differed from those of non-responders at baseline evaluation: responders showed higher baseline levels of important metabolites, including representative fatty acids (such as arachidonic acid), amino acids (such as arginine, taurine, and ornithine), and lipids (such as glycerol-3-phosphate), which are essential for protein synthesis and metabolic signaling.[26,27]These metabolites may represent a better metabolic reserve and a higher potential for metabolic recovery in CRT responders; for example, the higher levels of ornithine as being representative of urea cycle and ammonia detoxification functioning in responders.
Considering that 30% patients fail to respond to CRT based on current guidelines, there has always been an urgent demand in clinical electrophysiologic research for more powerful baseline predictors to guide patient selection for CRT, such as echocardiographic parameters,[28]multi- parameter clinical scores,[25]protein[29,30]and extracellular RNA.[31]Metabolomics, as a powerful screening tool, has increasingly been used for the diagnosis and prognosis of various cardiovascular diseases such as myocardial ischemia,[15]coronary heart disease[32,33]and heart failure.[6]Predictive analytics is an emerging area in personalized medicine;[34,35]the application of metabolomics analysis to CRT response prediction has been previously reported,[36,37]but contradictory findings have been reported with regard to its predictive value. Therefore, a need still exists for studies to evaluate the applicability of serum-based metabolomics analysis in predicting CRT outcome and to provide as much complementary information as possible. In the present study, we constructed a prediction model using concentration levels of two differential metabolites. If this model could be validated in a larger population, metabolic profiling of peripheral venous blood would represent a step forward in HF management and patient selection for CRT. Serum-based metabolic analysis is a high-throughput assay and employs robot-assisted automation protocols, which would facilitate routine screening as a complementary method to the conventional clinical, electrocardiographic, or image-based assessment.
We also adapted the same metabolic analysis method to coronary sinus blood and observed overlap of differential metabolites between peripheral venous blood and coronary sinus blood; we further demonstrated the significant correlations of their concentration levels in peripheral venous blood with those in coronary sinus blood. This suggests the cardiac origin of some important differential metabolic biomarker and lays the elementary foundation to further explore the mechanisms behind the relationship between CRT response and differential metabolites.
4.3 Limitations of the study
This study was performed in a single center with a relatively small sample size; future multi-center prospective clinical trials enrolling larger populations and validation groups are necessary for our results and model to be further assessed and deemed generally applicable. Moreover, the mechanisms behind the relationship between CRT response and differential metabolites are still not elucidated, and this aspect should be further explored in future work.
4.4 Conclusions
Our findings suggested that the development of HF induced a significant perturbation in circulating metabolites, while CRT responders showed a favorable metabolomic profile at baseline evaluation for predicting CRT outcome. A prediction model based on differential metabolites was constructed; these metabolites could thereby serve as potential biomarkers to complement current methods and enhance the predictive value of current evaluations. This differentiation may be useful for guiding patient selection and reducing the unnecessary invasive and costly CRT implantation, thus improving the effectiveness of CRT.
Acknowledgments
The study was funded by the National Nature Science Foundation of China (No. 81671685).
杂志排行
Journal of Geriatric Cardiology的其它文章
- The utility of coronary computed tomography angiography in elderly patients
- Predictors of non-response to cardiac resynchronization therapy implantation in patients with class I indications: the markedly dilated left ventricular end-diastolic dimension and the presence of fragmented QRS
- The relevance of serum albumin among elderly patients with acute decompensated heart failure
- Effects of febuxostat on atrial remodeling in a rabbit model of atrial fibrillation induced by rapid atrial pacing
- Adverse reactions of Amiodarone
- Approach to a patient with cardiac amyloidosis
