Impact of climate change on allowable bearing capacity on the Qinghai-Tibetan Plateau
2019-08-13XUXiaoMingWUQingBai
XU Xiao-Ming, WU Qing-Bai*
State Key Laboratory of Frozen Soil Engineering,Northwest Institute of Eco-Environment and Resources,Chinese Academy of Sciences,Lanzhou,730000,China
Abstract Climate change has a substantial impact on infrastructures in the permafrost on the Qinghai-Tibetan Plateau (QTP). In this study, the mean annual ground temperature(MAGT)and permafrost evolution were investigated in both the historical(1950-2005)and projected(2006-2099)periods.Then,an allowable bearing capacity model was used to discuss the allowable bearing capacity change on the QTP.Results show that the MAGT increased by 0.36 °C during 1950-2005.The MAGT will increase by 0.40(RCP2.6),0.79(RCP4.5),1.07(RCP6.0),and 1.75(RCP8.5)°C during 2006-2099.In addition,the permafrost area has decreased by 0.195×10⁶ km2 in 1950-2005.The permafrost area will decrease by 0.232×10⁶(RCP2.6),0.468×106(RCP4.5),0.564×106(RCP6.0),and 0.803×10⁶(RCP8.5)km2 during 2006-2099.With the degradation of permafrost, the allowable bearing capacity in permafrost zones would decrease accordingly. The decreasing trend is 6 kPa per 10 years in 1950-2005, and will be 0.6 (RCP2.6), 5 (RCP4.5), 7 (RCP6.0), and 11 (RCP8.5) kPa per 10 years during 2006-2099. The most remarkable trend would be observed under RCP8.5. Meanwhile, some scientific advices for the design, construction, operation and maintenance of permafrost engineering in the context of climate change were provided.
Keywords: Qinghai-Tibetan Plateau; Climate change; Permafrost; Allowable bearing capacity
1. Introduction
The cryosphere refers to the parts of the Earth's surface where water is dominantly frozen, and it includes areas with permafrost, glaciers, snow cover, ice cover, sea ice, lake and river ice, and solid precipitation (Harris and Murton, 2005;Qin et al., 2017). As the dominant components of the terrestrial cryosphere, permafrost is defined as a thermal condition of soil or other surficial material or bedrock and in which the ground exists at a temperature below 0°C continuously for two or more years in succession(Muller,2008).The total area of permafrost is 2.3× 10⁷km2,accounting for nearly 24% of the Earth's land surface (Gruber, 2012). Permafrost plays a crucial role in water and heat exchange between soil and atmosphere interface, vegetation and ecosystem, carbon cycle,and engineering stability. Given the presence of ice, permafrost is highly sensitive to climate change and human activities.
Widespread warming occurred over the globe in the past 100 years, and further warming is likely to occur in the next 100 years(IPCC,2007).Compared with those in other parts of the world,the high altitudes in the Northern Hemisphere(NH)are more pronounced, more sensitive to climate change, and twice as large as the global land warming. The climatic conditions and ecological environment in these areas are more sensitive to climate change (Messerli and Ives, 1997; Liu et al., 2009; Wang et al., 2014).
The Qinghai-Tibetan Plateau (QTP) is the largest and highest plateau in the world, with a mean altitude over 4000 m. Given its unique thermal dynamic effects, the QTP exerts a considerable impact on the East Asian monsoon and the global atmospheric circulation. This impact is called the“starting zone”for global climate change(Huang,1985;Liu,1999). As a high-altitude area in the NH, the QTP is sensitive to global warming. Since the 1950s, most parts of the QTP have experienced significant warming (Liu and Chen,2000). According to the IPCC Fifth Assessment Report,the QTP will continually warm in the 21st century, and the warming trend will become more notable than that of other regions at similar northern latitudes (IPCC, 2007). Permafrost area of the QTP accounts for 70.6% of China's total permafrost area, which measures 1.06 × 10⁶km2, whereas seasonally frozen ground covers an area of 1.46 × 10⁶km2(Zou et al.,2017).Permafrost on the QTP is the most widely distributed regional unit in the middle-low latitudes,featuring a unique natural environment and spatial differentiation. Compared with permafrost at high latitudes,permafrost on the QTP has the characteristics of high temperature, minimal thickness, and sensitivity to climate change,thereby giving this permafrost a certain particularity.Research shows that global warming has caused changes in a wide range of glaciers and permafrost degradation, which have led to environmental changes in the cryosphere (Wang et al.,2000;Yao et al.,2004;Qin et al.,2017).Permafrost on the QTP has experienced an increase in the mean annual ground temperature (MAGT) and thickening of the active layer,a decrease in the thickness and area of permafrost,and even complete disappearance in certain areas under climate change (Xu et al., 2017). During 1981-2010, the MAGT on the QTP presented an upward trend, which increased by 0.37°C (Xu et al., 2017). Meanwhile, during permafrost degradation, the active layer will also change accordingly(Zhao et al., 2010; Wu et al., 2012, 2013), resulting in a substantial impact on the surface energy balance,ecosystem,hydrological cycle, vegetation coverage, and engineering construction in permafrost regions. The melting of ground ice, which results in the thaw subsidence of the ground and thaw slumping of the slope, changes the morphology and stability of the surface and affects the hydrological cycle and stability of ecosystem and engineering structures.
As a material and environmental basis for human survival and development,engineering infrastructures provide a variety of services for human beings. Permafrost, as the bearing foundation of engineering infrastructures, shows extreme sensitivity to climate change.In particular,even minor thermal disturbances in warm and ice-rich permafrost areas may give rise to substantial changes in the permafrost environment and directly lead to structure instability. When permafrost foundation is subjected to the load transmitted from engineering infrastructures, the stress state in the foundation changes.When the change causes the stress at a certain point in the foundation to be equal to its ultimate stress,this point reaches the limit equilibrium state. With the addition of slightly more stress, the foundation will be destroyed and lose its stability.Therefore, to maintain the stability of the engineering infrastructures, the load cannot reach the allowable bearing capacity. Allowable bearing capacity refers to the bearing capacity of the foundation with sufficient safety and deformation control within the allowable range of the engineering infrastructures. Permafrost allowable bearing capacity is decreasing with the warming of permafrost.Numerous studies confirmed that permafrost warming,thawing,and degradation induce surface subsidence, undermining the stability of the permafrost zone structures (Nelson et al., 2001). Environmental degradation and surface subsidence have gradually become the main threats to permafrost structures.Since 2000,the sections of highway impacted by frost hazards of permafrost regions in China have reached 30%-40% of the total length,and more than half of the hazard sections are caused by climate change, permafrost degradation, and environmental changes (Cheng and Zhao, 2000). Thus,the effects of climate change on permafrost allowable bearing capacity have become key issues in future sustainable development.
Xu et al. (2017) discussed permafrost distribution and evolution under climate change by using a mean annual ground-air temperature (MAGAT) model. To understand the variations in permafrost and allowable bearing capacity on the QTP, the MAGAT model and the allowable bearing capacity model were used to simulate the permafrost and allowable bearing capacity evolution. The impact of climate change on permafrost and allowable bearing capacity were further discussed. These results will provide scientific support for the design,construction,operation and maintenance of permafrost engineering on the QTP.
2. Data and methods
2.1. Study area
Extending over a surface of 2.62×10⁶km2,the QTP spans from the Pamir Plateau in the west to the Hengduan Mountains in the east and from the Kunlun Mountains in the north to the Himalayas in the south, with an average elevation exceeding 4000 m a.s.l. In this study, we used the boundary of the “1:3,000,000 Permafrost Map on the QTP” as the scope (Li and Cheng, 1996), with a range of approximately 73°-105.6°E and 25°-41°N(Fig.1).The glaciers and lakes are scattered on the QTP, covering about 40.6 × 10³and 40.1 × 10³km2,respectively (Guo et al., 2015). Therefore, this study ignored the influence of the area change in glaciers and lakes under permafrost changes (Zou et al., 2017).
2.2. Data
Most of the sparse meteorological observations on the QTP began in the 1950s and 1960s. Given natural and economic constraints in this area, the meteorological stations are unevenly distributed and are concentrated in the central and eastern parts of the plateau.Almost no meteorological stations are present in the Qiangtang area in the hinterland of the plateau and in the western part of the plateau. Many stations feature non-continuous observations and record deletion and misrecords. Thus, the Coupled Model Inter-comparison Project Phase 5 (CMIP5) model simulation data were used in this study (Taylor et al., 2012).
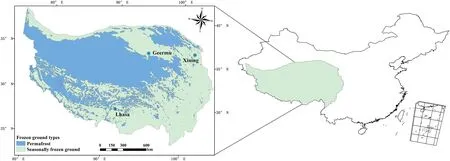
Fig. 1. Location of the study region.
The meteorological data used in this study comprised the GFDL-ESM2M model data, which include the historical period (1950-2005) and four representative concentration pathways(RCP2.6,4.5,6.0,and 8.5)for 2006-2099,for each day (Su et al., 2017). The spatial resolution of the data is 0.5°× 0.5°. The data were downscaled and bias-corrected by the WATCH data in 1960-1999(Weedon et al.,2011;Hempel et al.,2013).The meteorological data include the mean annual air temperature(MAAT),annual precipitation(AP),and longwave downwelling radiation (LRad).
Topographic data were required in addition to meteorological data. The difference in topography will affect the water-heat balance of the Earth's surface and the amount of heat flow on the planet. Such difference will also affect the temperature changes in the frozen soil layer by affecting the hydrothermal and other physical characteristics of the soil layer, thus influencing the formation and development of the permafrost. The digital elevation model (DEM) data of the QTP were provided by the Cold and Arid Region Science Data Center (http://westdc.westgis.ac.cn) with a spatial resolution of 1 km. With the use of the DEM data, the aspect factor of each pixel can be directly calculated and extracted by ArcGIS.This study divides the aspect into sunny (90°-270°) and shaded aspects (0°-90°or 270°-360°).
The soil type parameters on the QTP were obtained by“1:1,000,000 Soil Map of the People's Republic of China”and combined with “The Engineering Classification Standard of Soil (GB/T50145-2007)” to reclassify soil types on the QTP.
This study extracted the data in the QTP domain and processed daily data to obtain the annual average data.On the GIS platform, the data were interpolated by the kriging method,and the raster data of meteorology were obtained. The spatial resolution of meteorology, topographic, and soil type raster data were unified to 0.5°× 0.5°.
2.3. Permafrost classification and modeling method
At high latitudes,permafrost is divided into continuous and discontinuous permafrost according to the areal continuity degree of permafrost distribution, that is, the distribution characteristic on the flat surface, as the main zonal index.However, for the high-altitude permafrost, adopting such a zoning principle is inappropriate due to the differences in distribution characteristics (Cheng and Wang, 1982; Jin et al.,2008).The zoning indicators of permafrost mainly include the continuity, thickness, and MAGT of the permafrost. The MAGT is defined as the soil temperature at a depth of zero annual amplitude.Cheng and Wang(1982)pointed out that the MAGT of permafrost should be used as the zoning index,because this variable serves as an indicator for permafrost and atmospheric water-heat exchange level, linking the cryogenesis and thermo-physical characteristics and reflecting the energy of permafrost (Cheng and Wang, 1982). Considering the thermal stability of permafrost,the MAGT is considered as the main classification index. Permafrost on the QTP is classified into six types (Table 1): extremely stable, stable, substable, transition, unstable, and extremely unstable (Cheng and Wang, 1982). We used the MAGT of 0°C as the boundary between seasonally frozen ground and permafrost (Li et al., 2012, 2016; Chen et al., 2015b).
Given the lack of data on the QTP, the model simulation based on field observations has become a powerful tool for studying the distribution and thermal stability of permafrost.Thus far, a number of studies have been conducted on permafrost models (Boeckli et al., 2012; Cheng et al., 2012;Gruber, 2012; Guo and Wang, 2013), which are broadly divided into empirical statistical models based on environmental factors and physical models based on hydrothermal processes (Hoelzle et al., 2001; Li and Cheng, 2002). The empirical statistical model has more advantages over the physical models in studying the distribution and evolution of permafrost in large-scale areas.
In this study, the MAGAT model was used to discuss permafrost distribution and evolution on the QTP. The MAGAT model has been established and well applied to simulate the permafrost distribution and variation on the QTP in 1981-2010 (Xu et al., 2017). The MAGAT model is a statistical model between the MAGT and meteorological data coupled with topographic parameters.This model can simulate the distribution and thermal stability of permafrost on the QTP and discuss the current MAGT status and permafrost evolution under climate change. The MAGAT model is as follows:
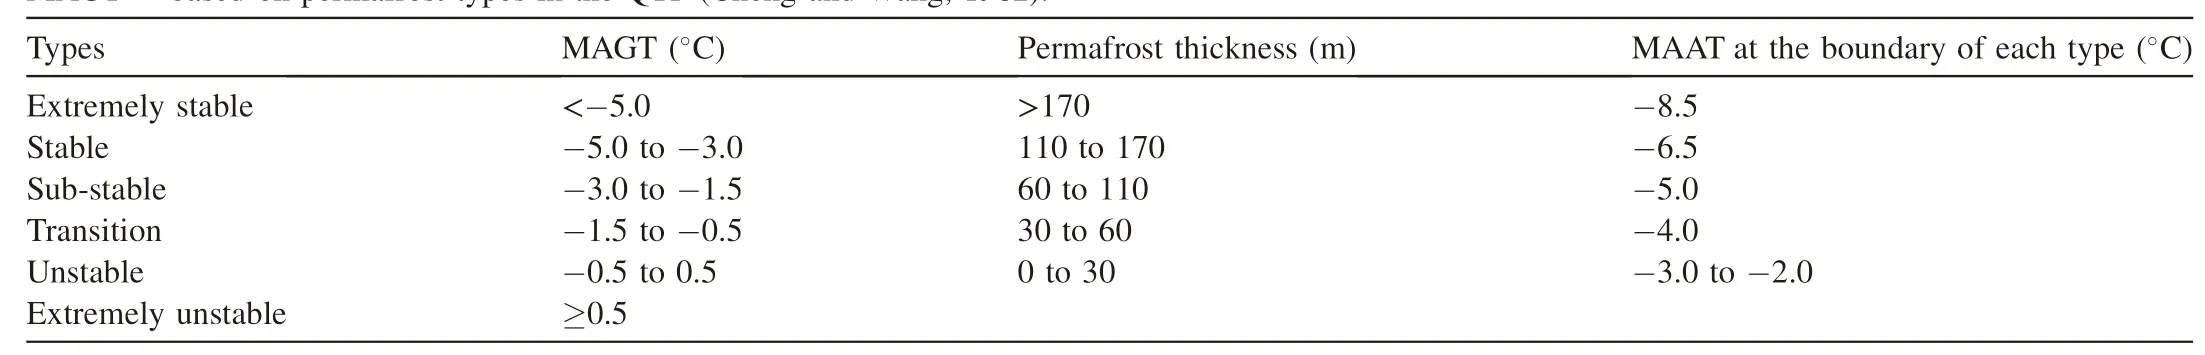
Table 1MAGT - based on permafrost types in the QTP (Cheng and Wang, 1982).
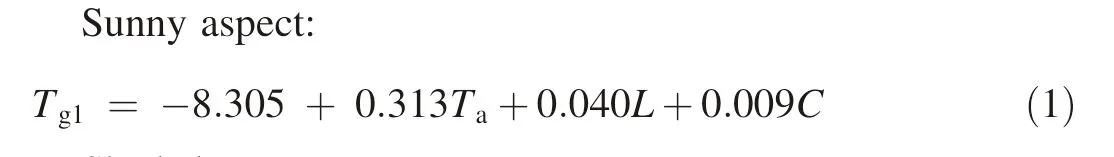
Shaded aspect:
where Tgis MAGT (°C), Tais MAAT (°C), L is LRad (W m-2), C is continentality (°), P is AP (mm), and H is the altitude of the grid(m).The multiple regression coefficients of sunny and shaded aspects are 0.827 and 0.705, respectively.The model is based on empirical statistics and predicts the equilibrium state of permafrost, without considering the time lag effect of permafrost formation and degradation.The model reflects only the evolution characteristics of the permafrost in the upper terrestrial surface (Bonnaventure and Lewkowicz,2010).
2.4. Allowable bearing capacity model
As a result of the presence of ice,the mechanical properties of permafrost show strong temperature sensitivity, thereby causing its performance under load to differ considerably from that of unfrozen soil (Ma and Wang, 2014). For different engineering infrastructures built in permafrost areas, differences are observed in terms of the impacts of climate change on allowable bearing capacity and the capabilities to adapt to climate change. The permafrost environment will change according to climate change. Certain permafrost areas will exhibit thermokarst settlement and thaw slumping, and the stability of the permafrost will change remarkably.
To evaluate the characteristic changes in permafrost allowable bearing capacity in the context of climate change,we used the allowable bearing capacity model to characterize the changes in the permafrost allowable bearing capacity.The allowable bearing capacity (Rf) refers to the bearing capacity of the foundation when the deformation and settlement of foundation remains below its allowable value under a stable foundation condition (non-destructive).
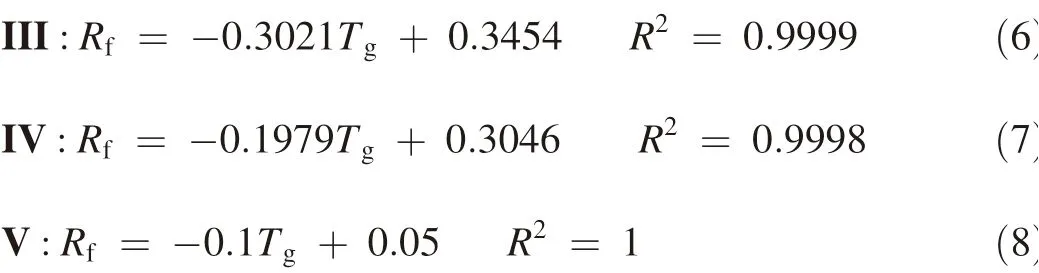
Table 2 provides the allowable bearing capacity of permafrost; we can obtain the statistical model of the Rffor each type of soil.The model is as follows(Wu and Ma,1994):
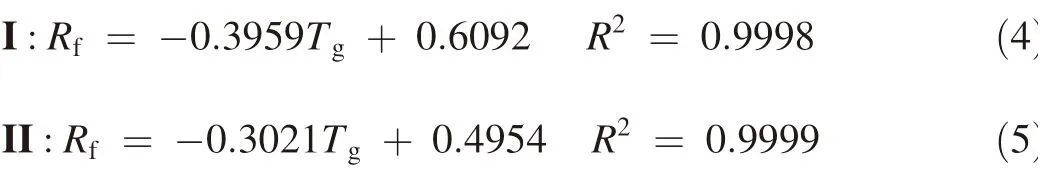
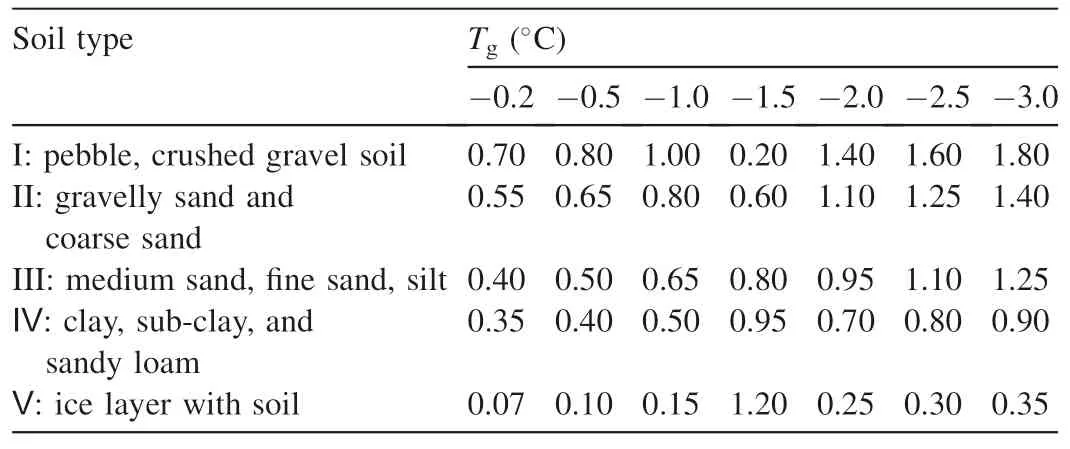
Table 2Allowable bearing capacity (Rf) (MPa) of permafrost (Wu and Ma, 1994).
3. Results
3.1. MAGT state and changes
On the basis of the MAGAT model, we first calculated the MAGT evolution of the QTP in historical (1950-2005) and projected periods(2006-2099)in four RCP scenarios(Fig.2).Results indicate that despite the differences between individual scenarios, the simulated MAGT on the QTP experiences a generally increasing trend.The ensemble MAGT increased by 0.36°C during the historical period, with an increase rate of 0.063°C per 10 years. By 2099, the ensemble MAGT will increase by 0.40(RCP2.6),0.79(RCP4.5),1.07(RCP6.0),and 1.75 (RCP8.5)°C on the QTP, with an increase rate of 0.010(RCP2.6), 0.081 (RCP4.5), 0.102 (RCP6.0), and 0.182(RCP8.5)°C per 10 years, respectively. The gradient of ensemble MAGT in RCP8.5 is considerably greater than those of the other scenarios,including the increment in the ensemble MAGT on the QTP.
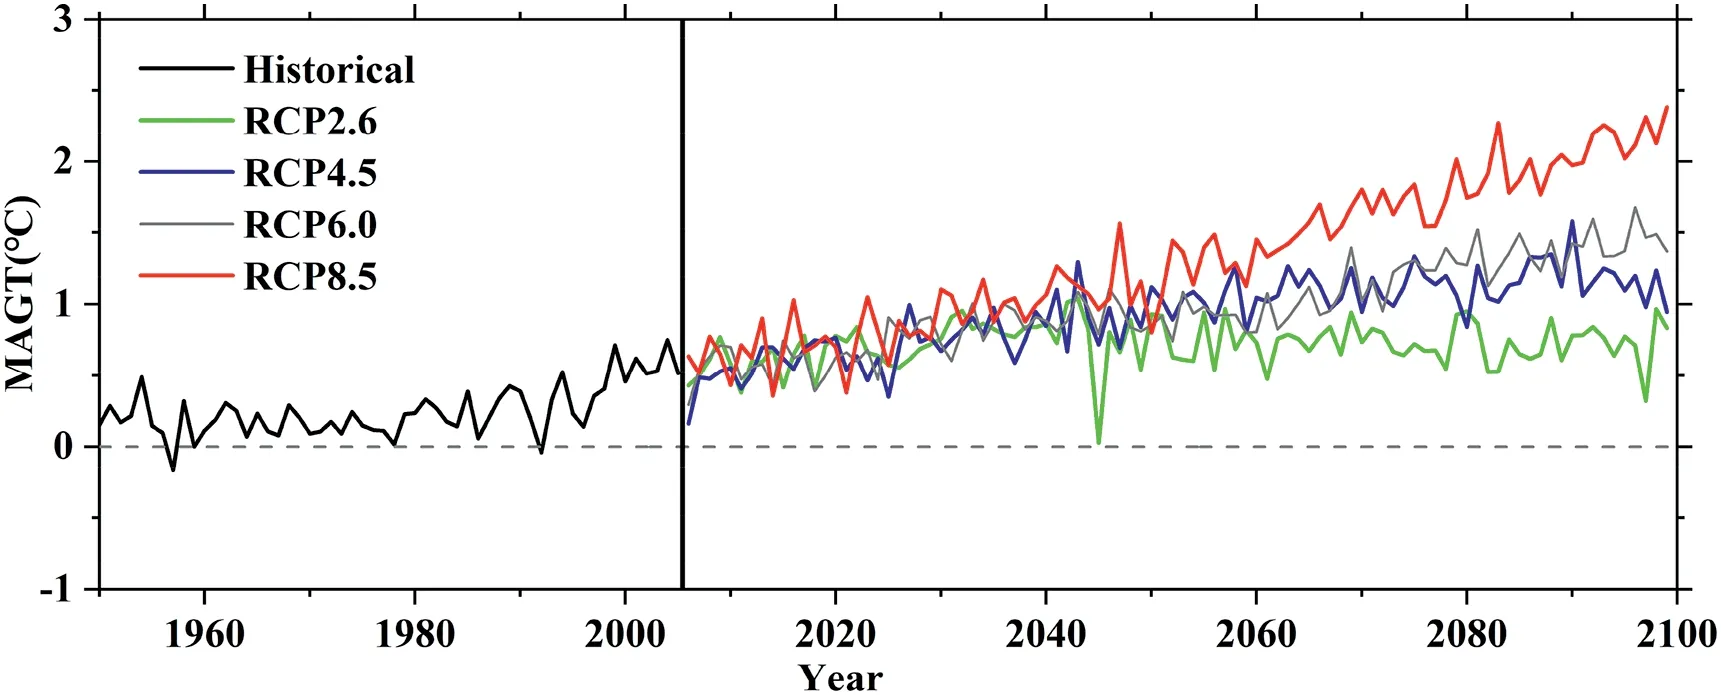
Fig. 2. Area-averaged MAGT on the QTP during the historical period(1950-2005) and projected RCPs (2006-2099).
3.2. Permafrost distribution and evolution
According to the thermal stability of permafrost proposed by Cheng and Wang (1982), the zonation of MAGT on the QTP was obtained based on the MAGAT model. With the MAGT considered as the zonation indicator,the frozen ground on the QTP was classified into extremely stable, stable, substable, transition, unstable, and seasonally frozen ground type (Xu et al., 2017). Fig. 3 shows the distribution and evolution of permafrost and its zonation. The simulated results show the significantly degrading trend of permafrost on the QTP in both historical and projected periods.The degradation of permafrost in the southern and central parts of the plateau is more pronounced; these parts are mainly the borders of permafrost and the Qinghai-Tibetan Engineering Corridor.
Fig. 4 displays the trends in permafrost and its subtype area during the historical period and projected term under four RCPs. The area of permafrost decreased by 0.195 × 10⁶km2during the historical period, with a decrease rate of 0.033×10⁶km2per 10 years.In addition,during 2006-2099,the area of permafrost decreased by 0.232 × 10⁶(RCP2.6),0.468×106(RCP4.5),0.564×106(RCP6.0),and 0.803×10⁶(RCP8.5) km2, with a decrease rate of 0.007 × 10⁶(RCP2.6),0.045×106(RCP4.5),0.053×106(RCP6.0),and 0.084×10⁶(RCP8.5)km2per 10 years,respectively.Table 3 lists the areal changes and change rates for different permafrost types in different scenarios.It can be concluded that the permafrost area decreases in stable, sub-stable, transition, and unstable types,except for historical period of unstable type and seasonally frozen ground, which shows an increasing trend. The most notable change is that of seasonally frozen ground, with an increase rate of 0.084 × 10⁶km2per 10 years under RCP8.5 and an area change of 0.803×10⁶km2,which is 30.6%of the total area of the QTP.
3.3. Allowable bearing capacity evolution
With the use of the statistical model of the allowable bearing capacity and MAGT distribution on the QTP, the evolution of allowable bearing capacity in permafrost zone was obtained.Fig.5 shows that the allowable bearing capacity on the QTP gradually weakened under a changing climate,especially under the RCP8.5 scenario. Results show that the allowable bearing capacity on the QTP exhibits a significantly decreasing trend both in the historical and projected periods.The decreased areas are mainly distributed on the edge of the permafrost, the southwestern part of the plateau.
4. Discussion
4.1. Impact of climate change on MAGT and permafrost
As a direct energy indicator of climate change, the MAAT plays a pivotal role in climate change.The spatial distribution of MAAT on the QTP is affected by altitude, longitude and latitude,and increases in the warming trend with altitude (Liu et al., 2006, 2009).
The MAAT and AP manifest an increasing trend in different scenarios on the QTP (Su et al., 2017). A comparison of the changes in the MAAT and AP with MAGT shows that the MAGT responds to climate change, indicating that the permafrost also responds to climate change but with spatial and temporal differences under different scenarios.The MAAT and MAGT form a correlation relationship, whereas the correlation between the AP and MAGT shows less significance compared with that between the MAAT and MAGT. The permafrost degrades in the context of climate change,whereas the permafrost areas decrease.In different permafrost subtypes,the permafrost areas decrease in the stable,sub-stable,transition,and unstable types, except for a historical period of unstable type and seasonally frozen ground, which shows an increasing trend.Area changes showed different conditions in different permafrost subtypes. Reduced permafrost may be converted to seasonally frozen ground. Previous studies (Guo and Wang,2016, 2013; Xu et al., 2017) also showed that the MAGT increases, whereas the permafrost decreases on the QTP. The decrease rate in this study is less than that in previous studies.
From the variation in the MAAT and AP in the permafrost zone(Fig.6),it can be concluded that permafrost zone on the QTP undergoes a process of warming and drying, which is different from that of the entire plateau(Chen et al.,2015a).In this climate context, the MAAT increases, and the AP decreases, leading to a decrease in soil moisture, vegetation degradation, soil desertification in permafrost zone, and subsequently to permafrost degradation.
The Paris Agreement aims to keep the global warming below 1.5 or 2.0°C compared with preindustrial levels, and the most appropriate scenarios are RCP2.6 and RCP4.5 (Su et al., 2018). Estimations indicate that the 1.5 and 2.0°C warming thresholds will be reached in 2020-2039 (RCP2.6)and 2040-2059(RCP4.5),respectively(Su et al.,2018).Thus,in this study,we discussed the MAGT changes by 2020-2039(RCP2.6)and 2040-2059(RCP4.5).As temperature increases by 1.5 and 2.0°C compared with preindustrial levels, the MAGT will be 0.78-0.84°C by 2020-2039 and 0.85-0.81°C by 2040-2059, respectively. The permafrost area will degrade to(1.052-1.035)×106km2by 2020-2039 and (0.994-1.059) × 106km2by 2040-2059.
4.2. Impact of climate change on allowable bearing capacity
To discuss the impact of climate change on allowable bearing capacity on the QTP, we obtained the MAAT, AP,MAGT, and allowable bearing capacity (Rf) time series in the permafrost zone on the QTP (Fig. 6). Results show that the MAAT and MAGT in the permafrost zone presented an increasing trend in different scenarios.By contrast,the AP and the allowable bearing capacity of permafrost exhibited a decreasing trend in both the historical and projected periods under different scenarios. The decreasing trend of allowable bearing capacity is 6(historical),0.6(RCP2.6),5(RCP4.5),7(RCP6.0), and 11 (RCP8.5) kPa per 10 years. The most remarkable trend was observed under RCP8.5.
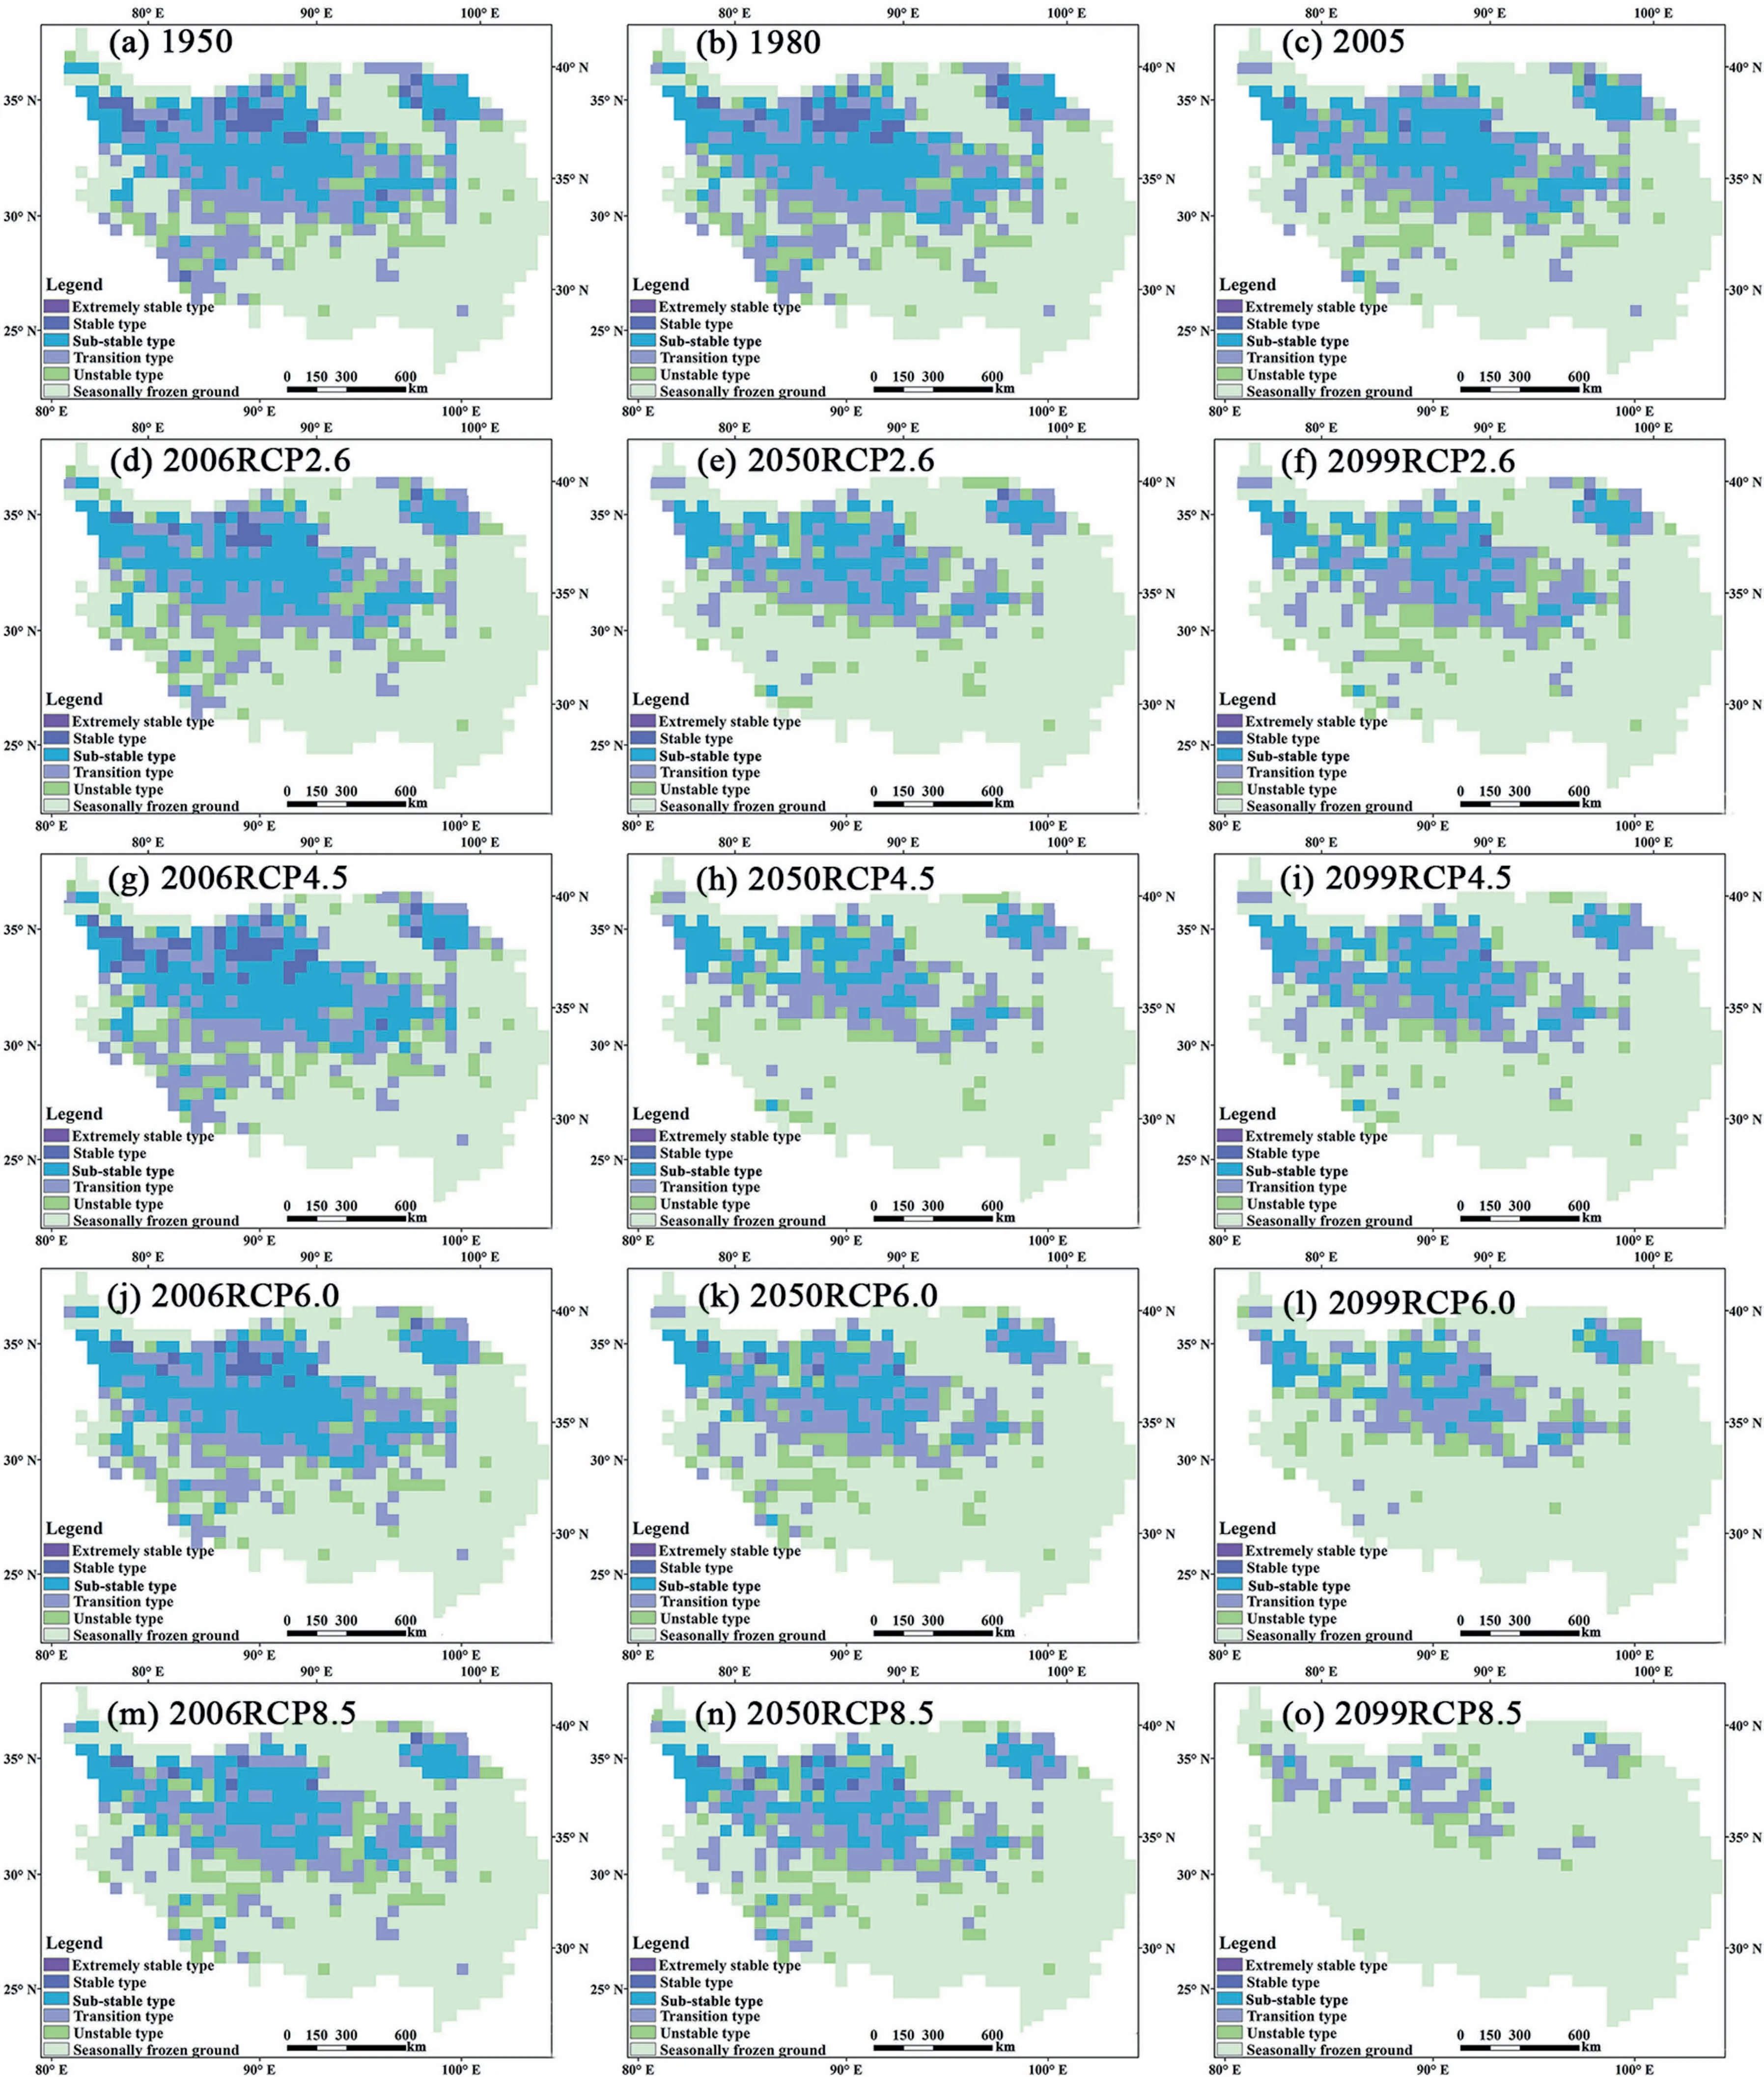
Fig. 3. Distribution and evolution of permafrost zonation on the QTP during (a-c) the historical period (1950-2005), and (d-o) projected RCPs (2006-2099).
Fig. 3 shows that the large permafrost areas converted into seasonally frozen ground. For areas where permafrost converted into seasonally frozen ground, the allowable bearing capacity will decrease and then increase. When these areas become stable, the allowable bearing capacity will be enhanced considerably.For seasonally frozen ground where no change occurs under climate change, the allowable bearing capacity are the same as those of the permafrost area.
The allowable bearing capacity under the global warming of 1.5 and 2.0°C compared with preindustrial levels was also discussed. As temperature increases by 1.5 and 2.0°C, the mean allowable bearing capacity will be 0.548-0.522 MPa by 2020-2039 and 0.539-0.537 MPa by 2040-2059.
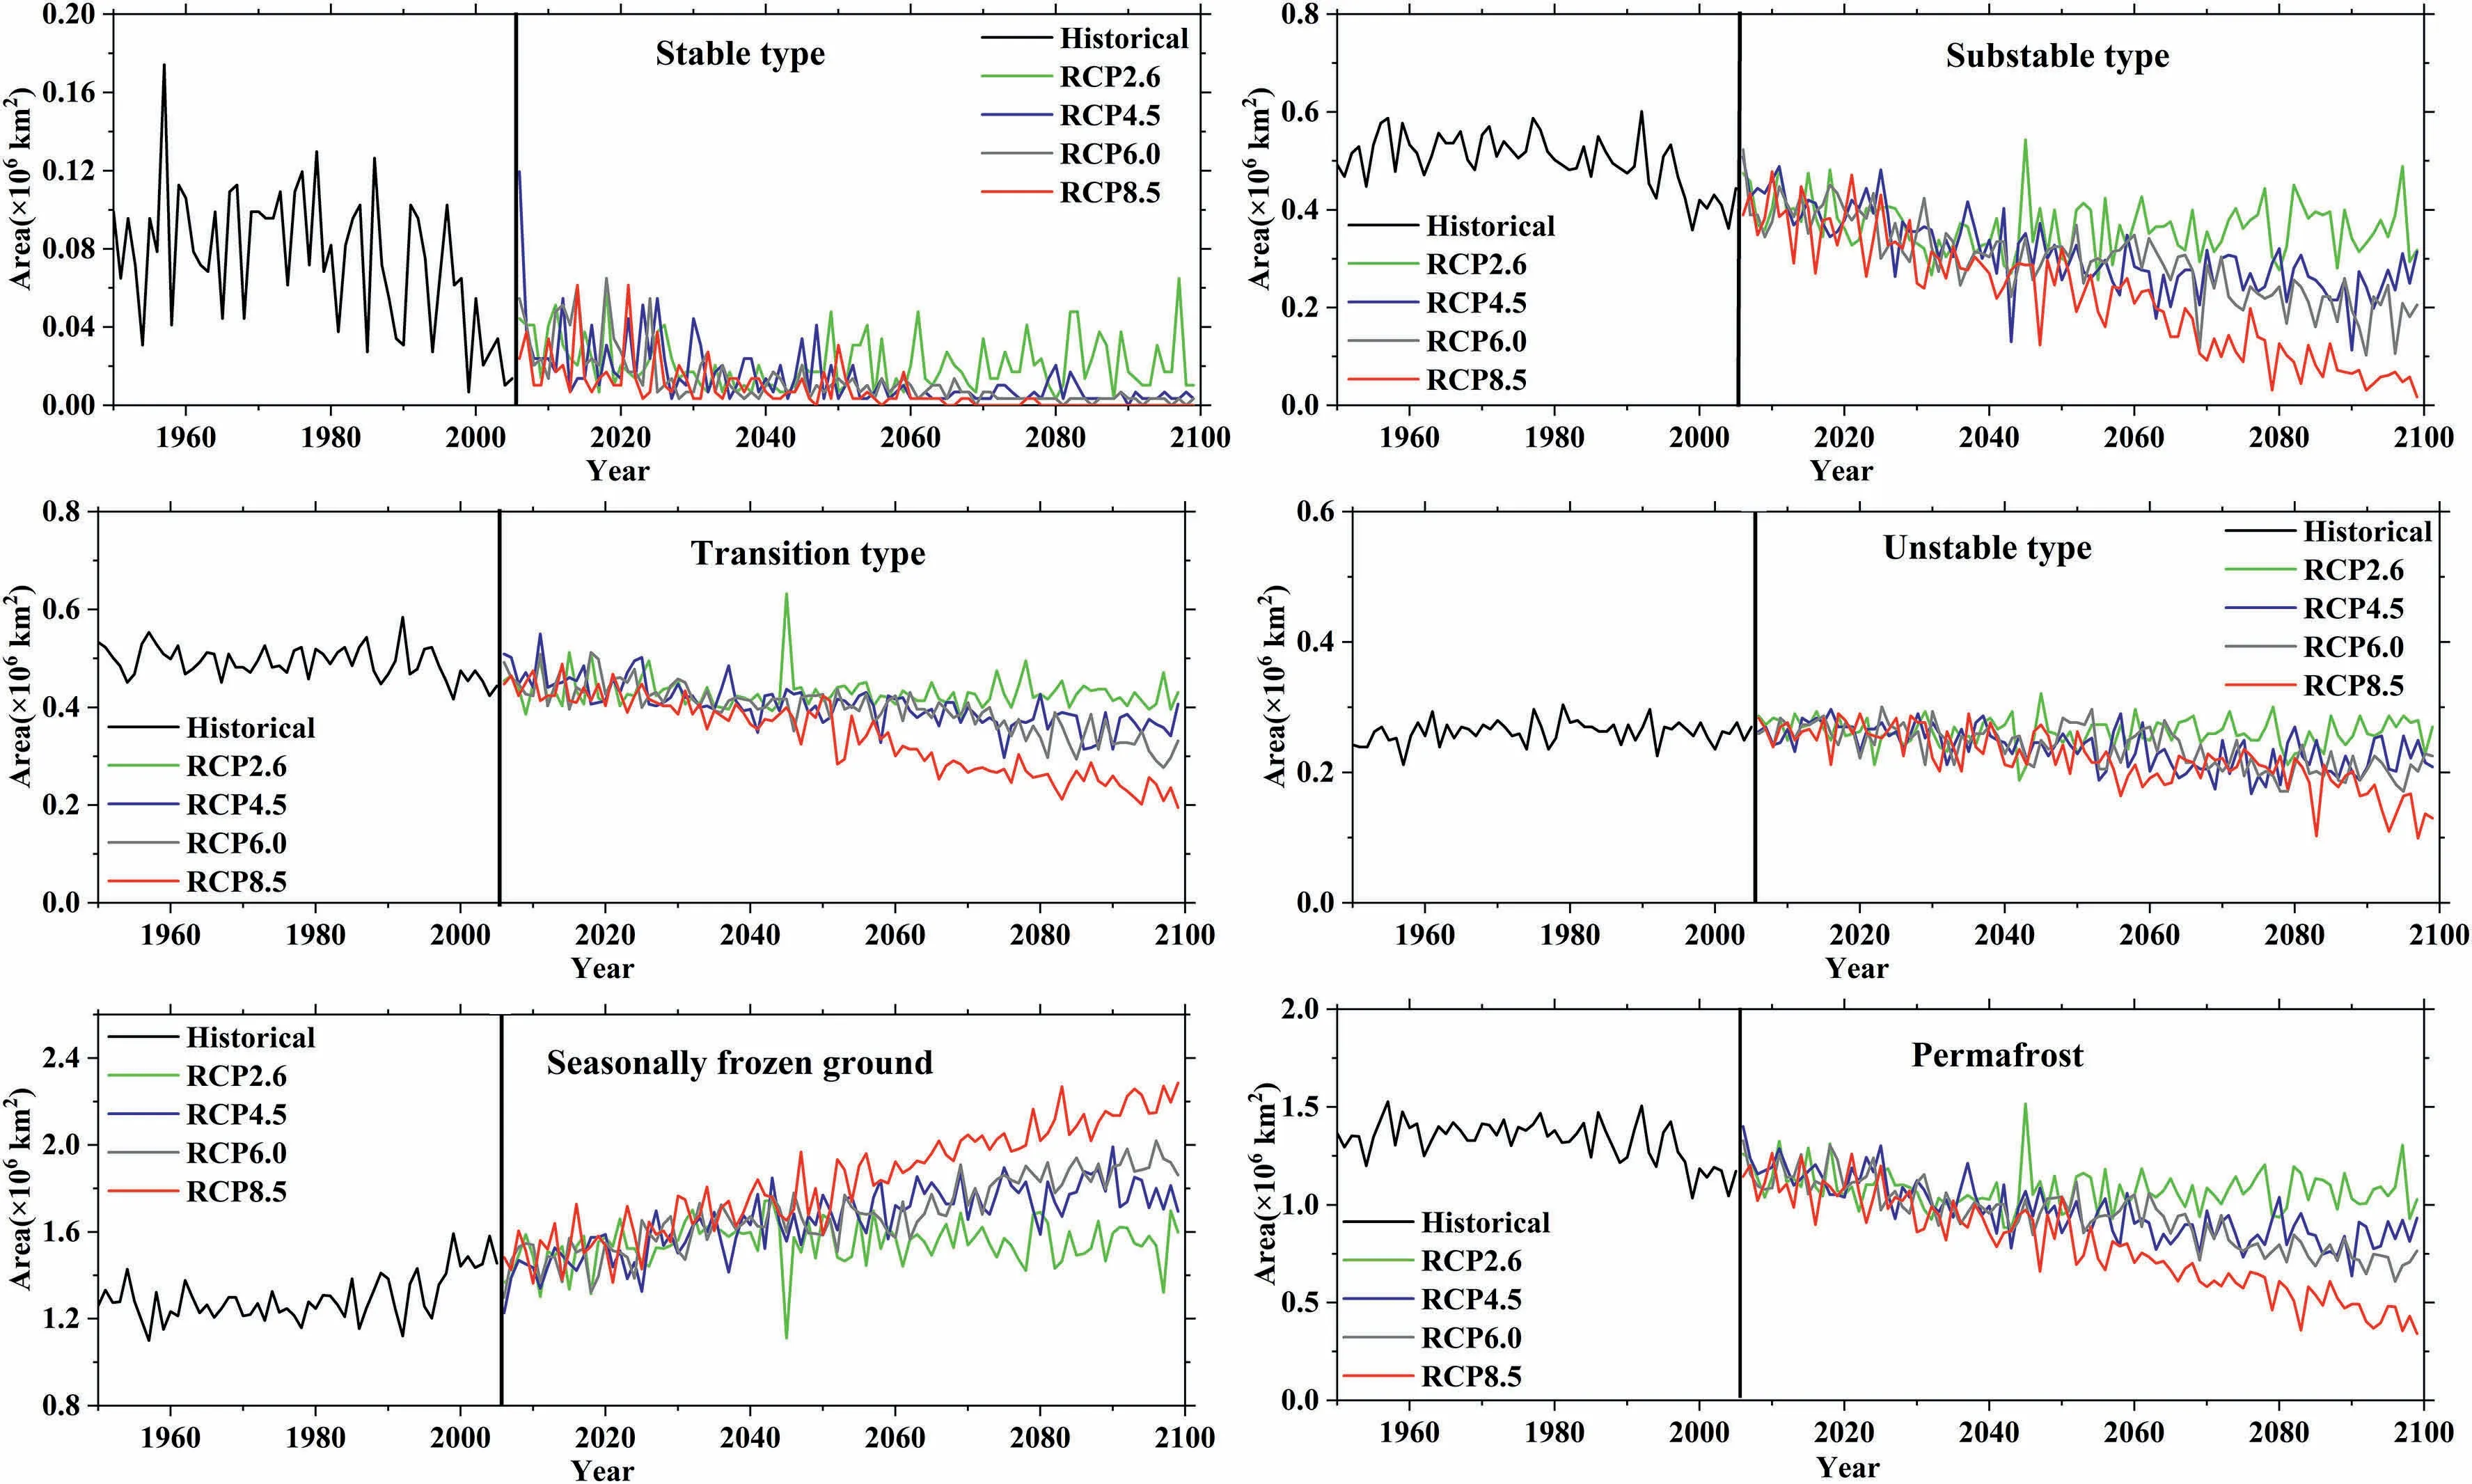
Fig. 4. Variation in permafrost and their subtype areas during historical (1950-2005) and projected periods (2006-2099).
4.3. Permafrost engineering design under climate change
For different areas on the QTP, the allowable bearing capacity in the permafrost zone changes in the context of climate change. Thus, the long-term thermal effects of climate change should be considered in engineering design to ensure the allowable bearing capacity in the permafrost zone. On the QTP, the engineering constructions are mainly linear structures in the QTP engineering corridor. For different areas within the engineering corridor,the allowable bearing capacity will change accordingly in the context of climate change. Climate is warming, MAGT is increasing,permafrost is degrading, and allowable bearing capacity is decreasing.
The areas with notable changes in the allowable bearing capacity are the most complex areas and the most difficult to design. For engineering structures with a long service life in these areas, the “bridge to road” scheme must be adopted,thereby ensuring that the permafrost can better mitigate the climate change and thermal impact of the engineeringstructures and that the engineering infrastructures can better adapt to climate change. For engineering structures with a short service life, appropriate measures can be taken to minimize the changes in engineering stability to ensure satisfactory allowable bearing capacity.
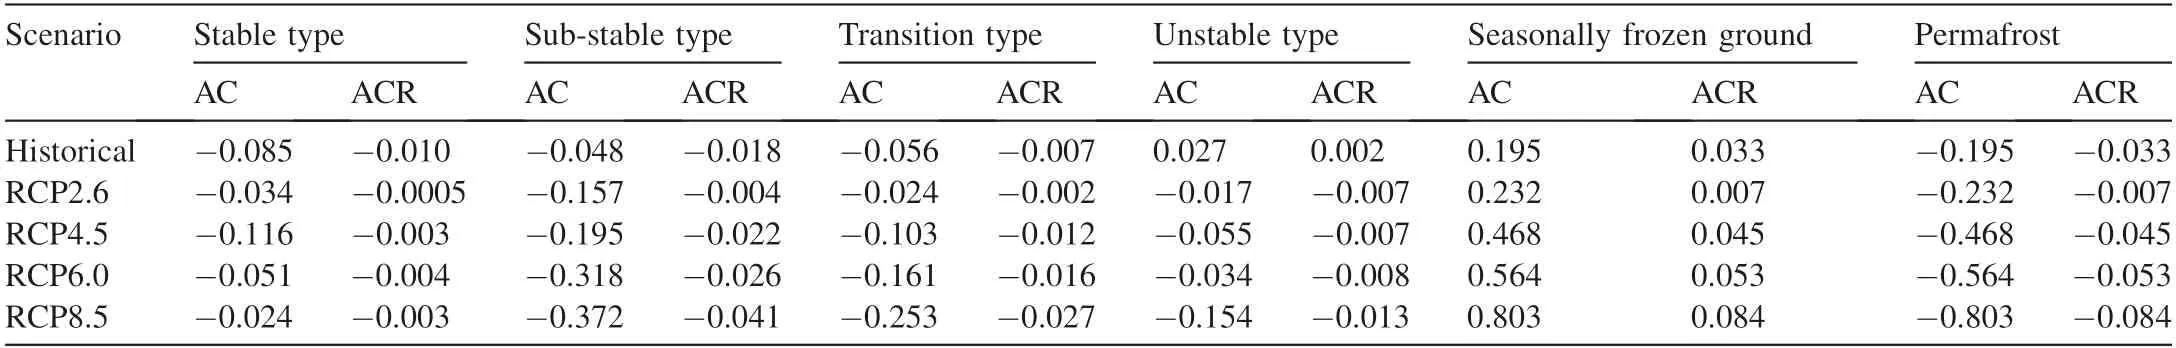
Table 3Areal changes (AC) (in 106 km2) and the change rate (ACR) (in 106 km2 per 10 years) for different permafrost types in different scenarios.
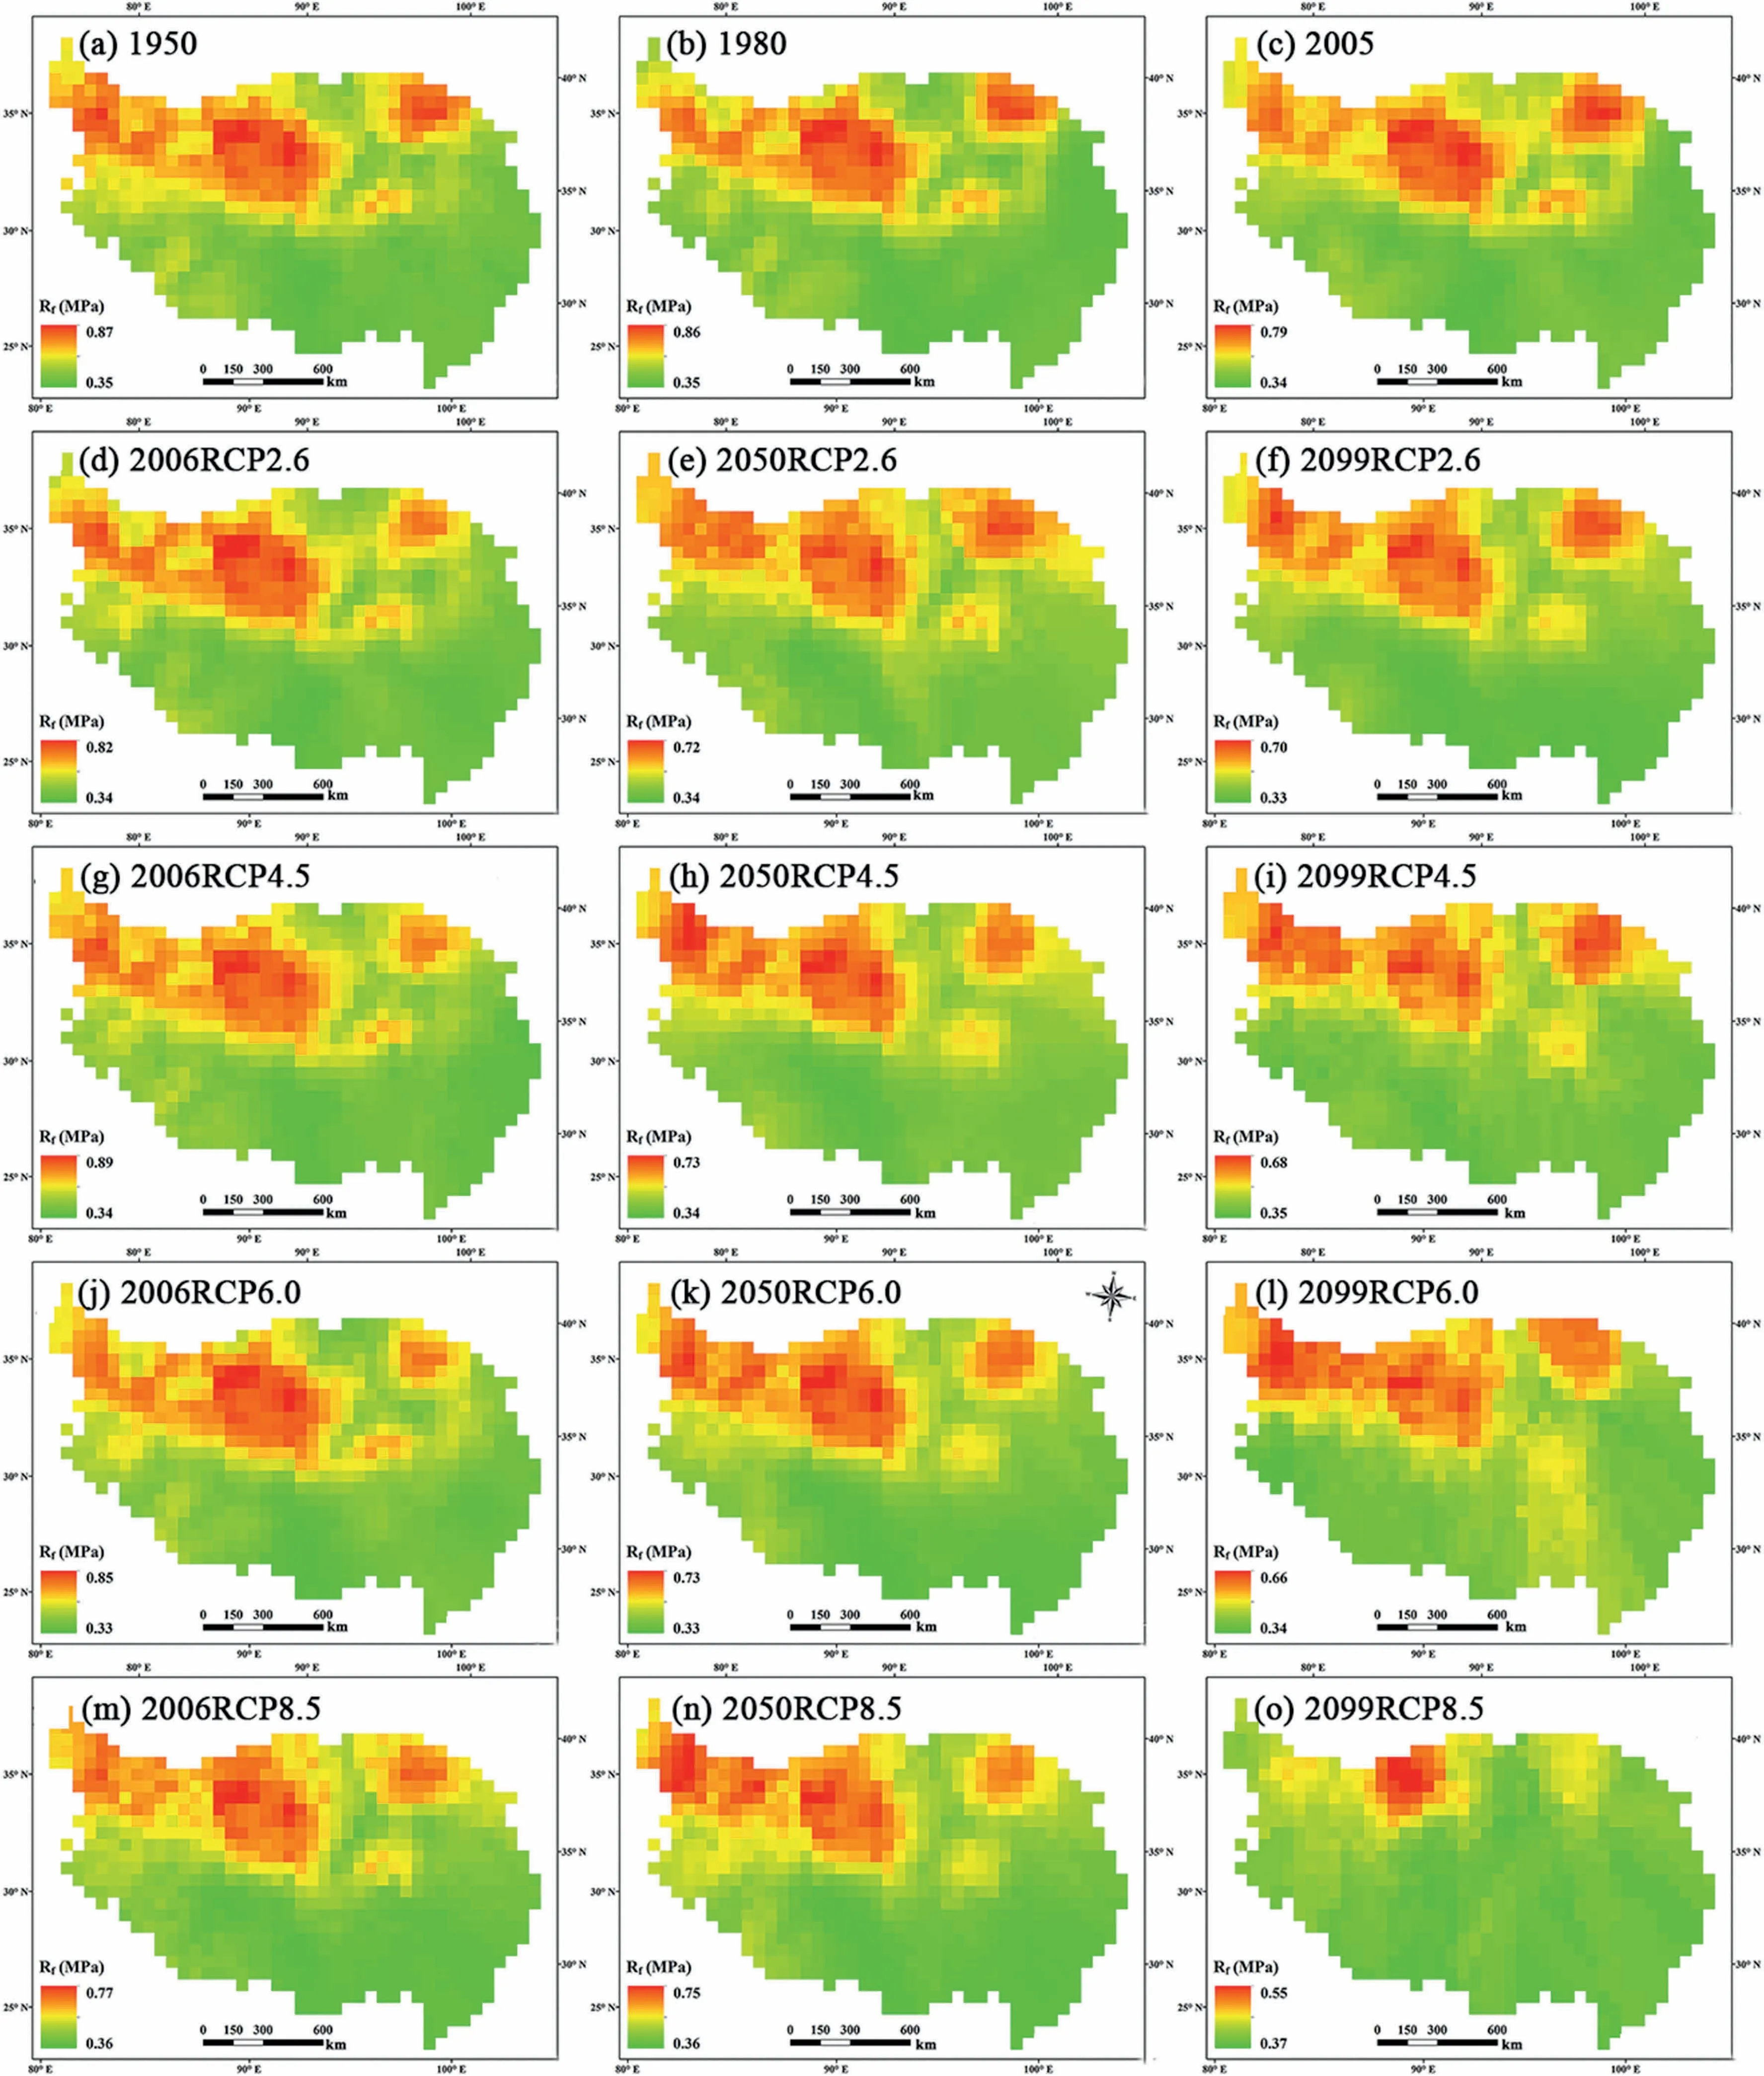
Fig. 5. Distribution and evolution of allowable bearing capacity on the QTP during (a-c) the historical period (1950-2005), and (d-o) projected RCPs(2006-2099).
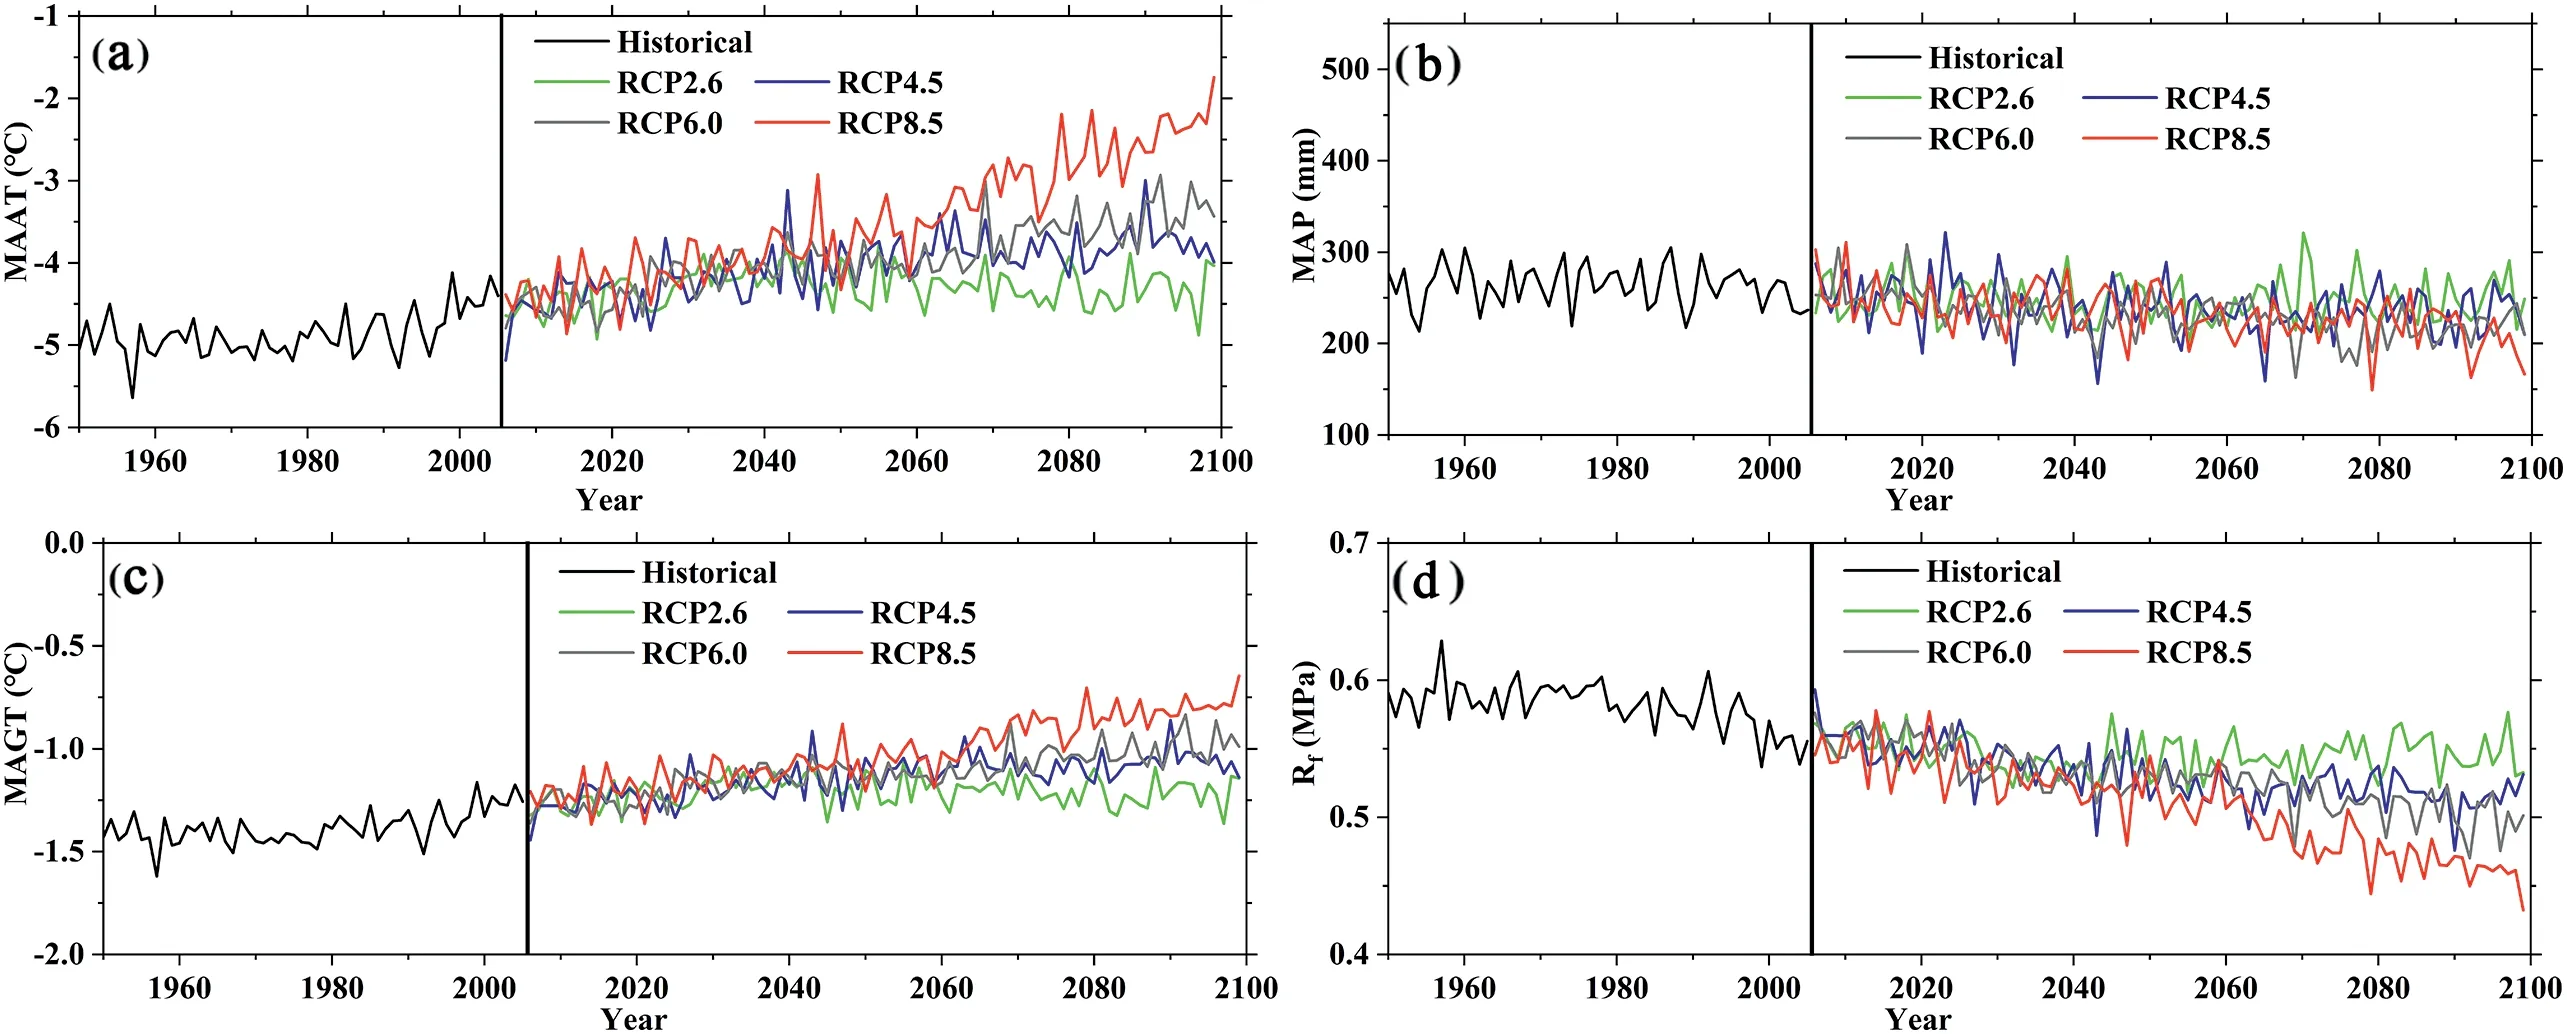
Fig. 6. Evolution of (a) MAAT, (b) AP, (c) MAGT, and (d) mean allowable bearing capacity in the permafrost zone on the QTP.
For areas with unremarkable allowable bearing capacity changes, the times of allowable bearing capacity and comprehensive consideration of engineering and technical measures must be combined to adapt to engineering stability changes within the construction's service life.
In conclusion, when constructing projects in permafrost regions, we should first consider the structure and technical characteristics of the project and its given service life.Second,the engineering design principles and technical measures should be considered according to the status quo of the allowable bearing capacity evaluation. More importantly, the impact of climate change must be considered in a targeted manner to predict and analyze the changes in allowable bearing capacity caused by changes in the permafrost area.Ultimately, according to the importance of the project, engineering designs should be constructed according to the most unfavorable conditions of climate change during the service life.As a result,the engineering design measures can ensure a minimum change in engineering stability during a structure's service life.
5. Summary
The MAGAT model was used to simulate the MAGT and permafrost distribution and evolution in the context of climate change under different scenarios.On the basis of the variation of MAGT and permafrost, the allowable bearing capacity model was used to evaluate the variations of allowable bearing capacity on the QTP.The results provide a scientific reference for engineering services in permafrost regions.
The simulated MAGT on the QTP experiences a generally increasing trend, especially in the southern area and Qilian Mountain area. The MAGT is significantly higher at the edge of the plateau,whereas that within the plateau is relatively low.The projected increasing rate in the MAGT is 0.010(RCP2.6),0.081 (RCP4.5), 0.102 (RCP6.0), and 0.182 (RCP8.5)°C per 10 years,respectively.The gradient of the ensemble MAGT in RCP8.5 is considerably greater than that of other scenarios,and the same character was observed for the increment in the mean MAGT.
The permafrost and its subtype area during the historical period and projected term experienced a generally decreasing trend, except for the seasonally frozen ground. The most notable change is that of the seasonally frozen ground,with an increase rate of 0.084 × 10⁶km2per 10 years under RCP8.5;the increase will be 0.803×10⁶km2,accounting for 30.6%of the total area of the QTP.
The allowable bearing capacity of permafrost on the QTP follows a significantly decreasing trend in both the historical and projected periods, especially under the RCP8.5 scenario.The decreasing trend will be 0.6 (RCP2.6), 5 (RCP4.5), 7(RCP6.0), and 11 (RCP8.5) kPa per 10 years.
Conflict of interest
The authors declare no conflict of interest.
Acknowledgments
This research was jointly supported by the National Natural Science Foundation of China (41690144) and Independent Project of the State Key Laboratory of Frozen Soil Engineering (SKLFSE-ZQ-45). We are indebted to Pro. JIANG Tong from National Climate Center, China Meteorological Administration for providing the meteorological data.We also thank the anonymous reviewers and editors for helpful comments.
杂志排行
Advances in Climate Change Research的其它文章
- A new look at roles of the cryosphere in sustainable development
- A preliminary study on the theory and method of comprehensive regionalization of cryospheric services
- Valuating service loss of snow cover in Irtysh River Basin
- An ecosystem services zoning framework for the permafrost regions of China
- Modeling the carbon dynamics of alpine grassland in the Qinghai-Tibetan Plateau under scenarios of 1.5 and 2 °C global warming
- Integrated impacts of climate change on glacier tourism