Key Process Protection of High Dimensional Process Data in Complex Production
2019-08-13HeShiWenliShangChunyuChenJianminghaoandLongYin
He Shi ,Wenli Shang,,Chunyu Chen,Jianming Ζhao and Long Yin
Abstract: In order to solve the problem of locating and protecting key processes and detecting outliers efficiently in complex industrial processes.An anomaly detection system which is based on the two-layer model fusion frame is designed in this paper.The key process is located by using the random forest model firstly,then the process data feature selection,dimension reduction and noise reduction are processed.Finally,the validity of the model is verified by simulation experiments.It is shown that this method can effectively reduce the prediction accuracy variance and improve the generalization ability of the traditional anomaly detection model from the experimental results.
Keywords: Industrial control system,outlier detection,anomaly detection system,rule tree model.
1 Introduction
With the development of technologies such as artificial intelligence and the Internet of Things and the integration breakthrough of software and hardware,industrial production has made continuous progress in recent years and ushered in a global industrial Renaissance.The intelligent modern industrial manufacturing model is changing from a relatively simple process,a large scale of production,and a more production-oriented model,to a precision manufacturing model with complex manufacturing processes,diverse processes and processes that require hundreds or even thousands of processes[Roldán,Olivares-Méndez,Cerro et al.(2017);Yang,Zhou,Yang et al.(2018)].However,the complexity of production process will surely challenge the safety production in the industrial site and the real-time quality inspection of products.The complexity of the production process makes it possible for changes in process parameters to have an unpredictable impact on the manufacturing process and product quality.Due to the global economic integration and the continuous development of international import and export trade,in the fierce market competition,high-end manufacturing enterprises have to pay more and more attention to product quality in order to gain competitive advantage [Ceschini,Gatta,Venturini et al.(2017)].
In complex production processes,the complexity of manufacturing technology and manufacturing process leads to the process parameter data reaching thousands or tens of thousands of dimensions.Such high dimensions make it impossible to adjust the process parameters effectively and timely in the field production process [Rajasegarar,Leckie and Palaniswami (2014)].The impact of different processes on the quality of products can only be measured artificially.Thus,the abnormal situation in industrial production cannot be timely positioned,and the abnormal process data cannot be timely detected,which brings a lot of losses to manufacturing enterprises.Research on intrusion detection of industrial control system has been extensive.For example,Caselli et al.[Caselli,Zambon and Kargl (2015)] proposed a unique sequence intrusion detection system based on industrial control system,they use the discrete time Markov chain (DTMCs) to describe network messages and log entries recorded from multiple ICS device operations,and they also proposed a detection mechanism based on the weighted distance calculation between Markov chain states.This method is effective in serial attack but has many limitations in identifying and analyzing the correct information set and modeling classified data.Ristic et al.[Ristic,Scala,Morelande et al.(2008)] used the historical AIS ship self-reported data to extract the ship's motion pattern,and then used the motion model to construct the corresponding motion anomaly detection system under the adaptive kernel density estimation framework.This abnormal ship motion system is greatly improved in the aspect of false alarm rate.Lazarevic et al.[Lazarevic,Ertöz,Kumar et al.(2003)] conducted a detailed comparative study on several abnormal detection schemes for identifying different network intrusions and assessed several existing abnormal detection schemes with or without supervision on the DARPA 1998 network connection data set.Zhou et al.[Zhou,Tian and Yang (2017)] proposed an outlier detection method based on clustering and nuclear density estimation hypothesis testing,which is an unsupervised outlier detection method,and is superior to the supervised learning model in the real-time detection of process data.However,cluster parameters should be set according to different business scenarios and data characteristics in cluster analysis of process data,and these artificially selected parameters have great influence on the detection effect.The parameter estimation and abnormal value detection based on Bayesian method proposed by Hua et al.[Shang,Feng and Zhang (2016)] first adopted Gibbs sampling and then used the post-verification probability of Bayesian to locate the abnormal value.The experimental results are better than the traditional outlier detection method,although the variance of the outlier prediction is reduced,the model deviation is large.
The difficulty in constructing an anomaly detection system in the industrial scene lies in the requirements of real-time and accuracy,which makes the size of each training sample must be limited,the training sample dimensions be high,the number of bars be small,and noise data exist,resulting in the model being prone to over-fitting.Each batch of training model has a large variance of anomaly detection effect,so the model must have good robustness [Ouyang,Sun,Chen et al.(2018);Sagha,Bayati,Millán et al.(2013);Curiac and Volosencu (2012)].
In this paper,an anomaly detection system based on improved tree model is constructed for high-dimensional process data,which can detect abnormal process data in the production process timely,thus reducing the loss of raw materials in industrial production process.The high-dimensional process data was firstly transformed to remove outlier points and long-tail distribution in this paper,so as to improve the data characteristic performance.Then,the high-importance features were selected by rule trees to suppress overfitting and reduce the model complexity.Finally,the double-layer model fusion was used for the final data anomaly detection.
2 Data preprocessing
The experimental data comes from a semiconductor manufacturing industry.The production process is complicated,including hundreds of processes,and the parameters of each process are not unique.The data description is shown in Tab.1.Manufacturers provide real process data of 8027 dimensions,including float64 type features 6483 dimensions,int64 type features 1534,object category features 10 dimensions,and int type one-dimensional target outliers’ calibration,and these data may have outliers or noises.

Table1:The data description
2.1 Category type feature processing and missing value padding
There are 10-dimensional Category features in the process data set of this paper,we count the independent values of each Category type feature and each value is between 4 and 6.We use One-hot encoding to extract the Category features,it will not bring a big burden to the later calculation of the model,because the independent value of each feature is little.In order to construct abnormality detection system,we use the -1-tag approach to mark the missing values [Davies and Russl (1994);Breiman (2001)] instead of mean,median,mode,etc.filling or model estimation practices.
2.2 Noise reduction and outlier processing for numerical features
The numerical characteristic dimension of the process data is relatively high.The quality of the features determines the maximum performance of the model.After the preliminary statistical calculation of numerical features,the standard deviation of individual features is large,which means that these features have large fluctuations and may have abnormal values or noise.Fig.1 shows the histogram of the one-dimensional numerical characteristic data.Obviously,on the one hand,the distribution of features is long-tailed,which indicates that there may be outliers in the feature data.On the other hands,the density distribution of such features is severely skewed,and the fluctuation of data is great.However,the model hopes that data fluctuations are relatively stable.After all,the stable sample can reduce the prediction variance.Therefore,the data needs to be preprocessed to prevent over-fitting.
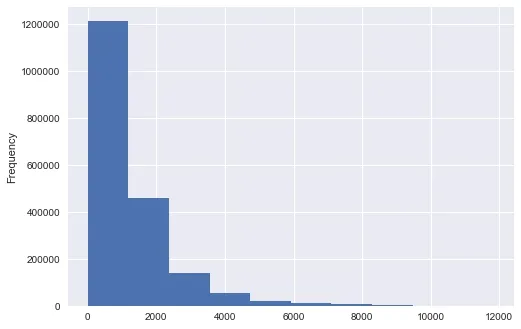
Figure1:Histogram with deviation feature distribution
In order to change the partial distribution of data,this paper compares three data transformation methods:square root transform,square root inverse transform and natural logarithm transform,and finally selects natural logarithm transform.In addition,the long tail of the data in this column was processed,and the data beyond 3 standard deviations were excluded.After that,natural logarithm was added again and again,and the results are shown in Fig.2.
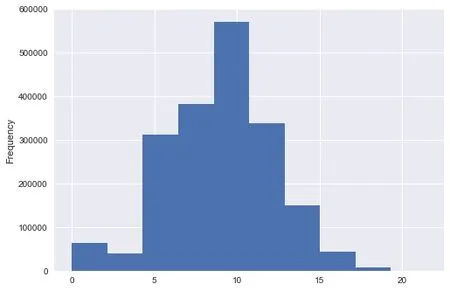
Figure2:Histogram after data processing conversion
3 Positioning key process characteristics
The dimensionality reduction methods for data mainly include the unsupervised dimensionality reduction method represented by PCA principal component analysis and the supervised linear discriminant method represented by LDA linear discriminant analysis.PCA is an unsupervised dimensionality reduction method based on maximum variance theory,which cannot reflect the correlation information between the predicted variable and the target,while LDA method is a linear method to discriminate the relationship between the predicted variable and the target and cannot be reacted if the correlation is non-linear.Furthermore,there is another method:a self-coded neural network based on deep learning,which requires a lot of data and can easily produce overfitting.In this paper,the feature selection based on the rule tree model,that is a nonlinear supervised dimensionality reduction method.The generating condition of rule tree is simple,and the result is very interpretable,which facilitates the calculation of feature importance in the later stage [Liu,Yang,Li et al.(2014);Epple (2012)].
3.1 Rule tree model feature selection construction
The rule tree model is used to find the appropriate splitting point and divide the target data into more and smaller scale homogenized groups.The choice of splitting point includes the selection of the overall features of the data and the division of the splitting points in the single feature.The methods for measuring the purity include the Gini coefficient and the cross entropy.The rule tree model is to generate different tree models by using different features and random samples,thus ensuring the generalization of the results Then,according to each feature as the split point,the average Gini coefficient change in different rule tree models is used as the feature importance basis to generate the feature importance index.This rule tree-based method is robust to noise in process data after generating more tree models [Zhou,Sun,Fu,et al.(2018);Ren,Ye and Li (2017)].

There are two types of target categories in this paper,the simplification of the Gini coefficient 2P1 P2.We calculate the Gini coefficient before splitting and calculate the weight-to-Gini coefficient of each node after splitting and select the appropriate splitting node.Vimis used to represent the importance of Variables (Variable Importance Measures).The process data sample used in this paper is 8026 dimensions,represented by featuresX1 ,X2 ,X3 ,...,X8026,and the Gini coefficient scoreVimj[Tsai,Chang,Chen et al.(2009);Marchi,Ferroni,Eyben et al.(2014)] of each featureXiin the sample is calculated.TheGiniindex change before and after the node m branch can be determined by the following equation:

whereGinilandGinirrepresent the Gini index of two new nodes after node branching respectively.
The node where featureXappears in rule treejis in setM,then the importance ofXiin thejth tree is determined by the following formula;

The importance of the features is normalized as follows:

3.2 Rule tree model selection features
In Fig.3,there are 4 feature scatter plots with the highest average importance of features in 300 rule trees.The diagonal diagram is a distribution of features to different target types.The distribution of these 4-dimensional features under different target categories is clearly differentiated,which contributes a lot to the abnormal behavior of distinguishing process data.These features have a large impact on the abnormality of the process data and correspond to the parameter dimensions of the product process.Obtaining the process characteristics with a large degree of influence on the process data is helpful for the whole process flow and human configuration,and the manufacturing plant can strengthen the protection for the key process partitions.We choose a grid search method for single model 10-fold cross-validation in process data samples using a list generated by feature importance ranking.Since the target category belongs to the unbalanced category and there are more normal categories,the method uses the cross-validation method of hierarchical sampling.In this method,the model is selected with a higher average score in the verification set and a smaller standard deviation,that is,the number of features with small fluctuation.Thus,a new process data sample set is constructed.
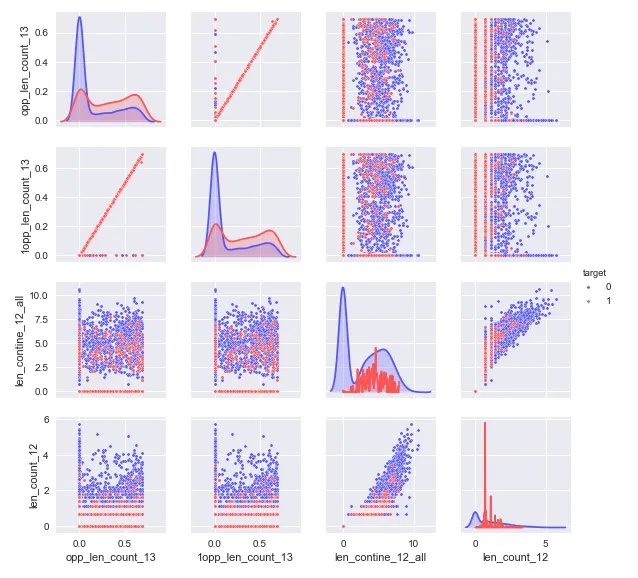
Figure3:Distribution of important characteristics of process data
4 The proposed anomaly detection model
Traditional anomaly detection is a method of intrusion detection and it builds a normal behavioral model from existing data.Anomaly detection methods mainly include machine learning,mathematical statistics and neural networks.Machine learning is widely used in anomaly detection systems.In this paper,we propose a two-layer model fusion method,which has the following advantages compared with other single models.First,the two-layer model fusion has higher accuracy under the same sample size.Secondly,the underlying model can effectively prevent over-fitting and improve the generalization ability of the overall model.Moreover,the feature selection based on the rule tree groups can effectively avoid dimension disasters and computational costs and can improve the real-time performance of the system.
A block diagram of the anomaly detection system of the two-layer model fusion is drawn in Fig.4.The effect of dimension reduction is achieved by randomly selecting the characteristics of high-dimensional data,constructing different rule tree groups,and selecting the k-dimensional features with the highest ranking in the rule tree group.We carry out a hierarchical n-fold cross-validation training model for k-dimensional samples,where n-1 samples are used to train the model,and the remaining sample is used as a validation set for prediction.Finally,we obtain n prediction probability results.We use these n predictions as predictors and use the new model to train the target variables.
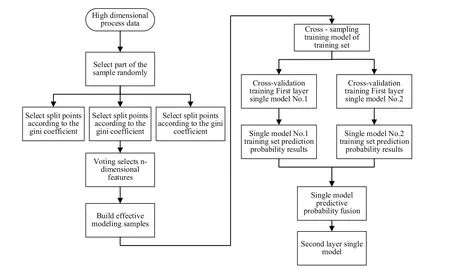
Figure4:The anomaly detection system of the two-layer model fusion
Step0:Apply the bootstrap method to randomly extract K new self-sample sets and use the new sample set to build the K rule tree.Each time the sample that has not been drawn constitutes K out-of-bag data (Out-of-bag,OOB).The bootstrap sample is b=1,2...,B,where B represents the number of training samples.The variable importance metric Djbased on the classification accuracy of the feature Xjis calculated according to the following steps [Rassam,Zainal and Maarof (2013);Lane and Brodley (1900);Helali(2010);Subaira and Anitha (2015)]:
Step1:Setb=1,create a decision tree Tbon the training sample,and mark the out-of-bag data asLboob.Use Tbto classify the data on the data outside the bag,and count the number of correct classifications,denoted asRboob.
Step2:For the featureXj,j=1,2,...,N,perturb the value of the featureXjinLboob,record the disturbed data set asLbjoob,use Tbto classify the data,and count the number of correct classifications,denoted asRbjoob.
Step3:Repeat Steps (1)~(3) forb=2,3...,B.The variable importance metricDjof the feature Xj is calculated by the following formula [Wan,Yao and Jiang (2018);Wu,Zhang,Zhang et al.(2018)]:

Step4:Use grid search:Grid Search to set 10 folds cross-validation,select the number of features with low variance and high variance on the verification set,and generate new process data samples.
Step5:Select three models with good performance and large difference in model principles as the base model.The sample is subjected to 3-fold stratified sampling,each single model is trained,and the 3D prediction samples are obtained by using the verification set.The following three basic models are established by using the python machine learning sklearn library.The model parameters are as follows:
Naive Bayesian model:
sklearn.GaussianNB(priors=None);
Lightgbm model:
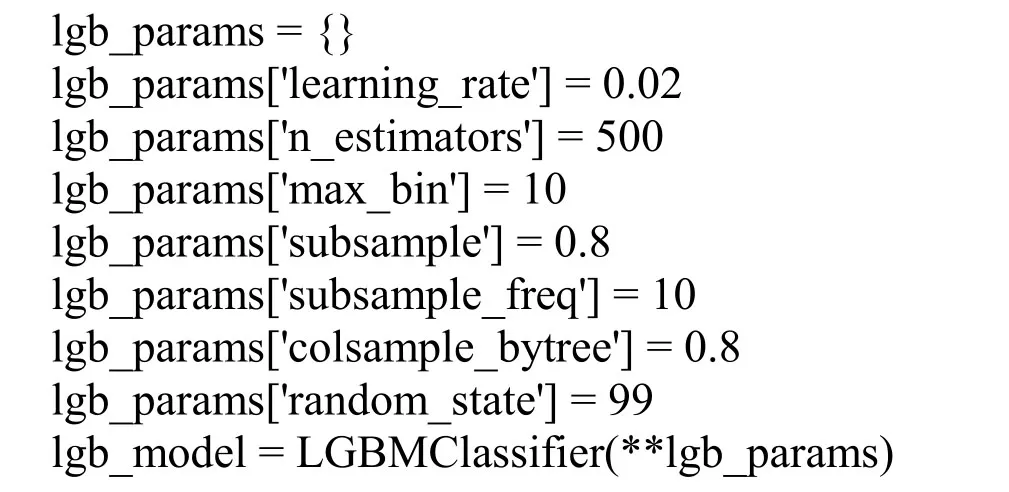
XGboost model:
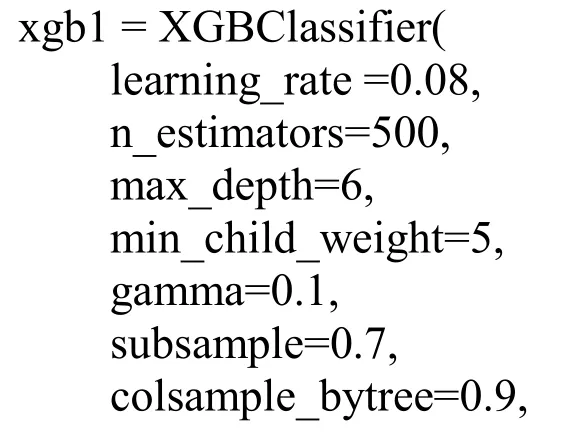

Step6:Train the model with the newly generated 3D prediction samples and a simple logistic regression model,then use the grid search to adjust the regular penalty term C=10 to predict the final test data.
5 Comparison and analysis of experimental results
To carry out the feasibility of anomaly detection process data analysis and comparison of the typical algorithm validation,the research group use the existing industrial safety protection simulation laboratory deploying the model in anomaly detection system.10 rack servers,5 industrial control hosts,3 industrial firewalls,1 abnormal detection system and 1 industrial gate is equipped in the laboratory,which can meet the basic requirements of this experiment.On this basis,this paper designs and sets up the simulation experiment environment.The verification set of 3,000 semiconductor industrial data was imported into the industrial real-time database.Python was used to capture the data in the database in real time,and the highly important dimensional features were extracted with the experimental anomaly detection system and returned to the intrusion detection system for unified supervision.In this paper,the traditional SVM support vector machine,logical regression,and the GBDT model XGboost (XGboost has excellent performance in competitions such as Kaggle and Tianchi Big Data,and is an improved version of the traditional gradient ascension tree) which is generally effective in data mining are compared,the Figs.5-8 are learning curves of the test set using four different models.

Figure5:Two-layer fusion model test set learning curve
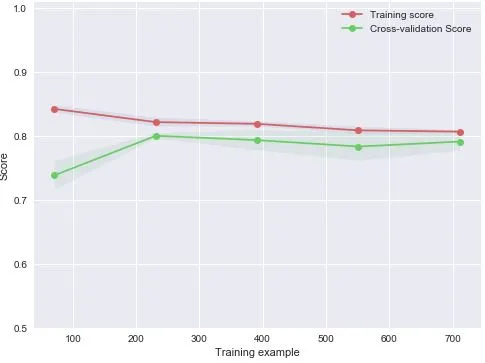
Figure6:SVM model test set learning curve
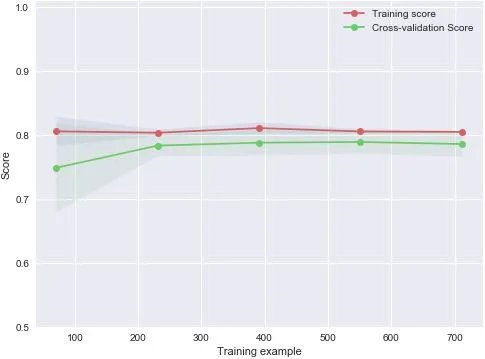
Figure7:XGboost model test set learning curve
According to the results of the simulation experiment,the anomaly detection systems implemented by all the four models have achieved a high level of classification accuracy.The classification accuracy was 79.6 percent,78.5 percent,78.9 percent and 83.4 percent,respectively,in the proportion of 1:1 between abnormal data and normal data.From the comparison of the learning curve,it can be seen that the standard deviation of the accuracy of the two-layer fusion model in this paper is 0.035 in the cross validation of ten folds,which overcomes the disadvantages of large variance and easy overfitting of other models such as logistic regression and retains the advantages of higher prediction accuracy.It effectively enhances the generalization ability of the anomaly detection model,in the meantime,the predictive ability is basically equivalent in the training set and the test set.The experiments show that the two-layer fusion model is effective in improving the generalization ability of the process data anomaly detection model,and the accuracy of the anomaly detection system is improved to some extent.The specific simulation results are shown in Tab.2.
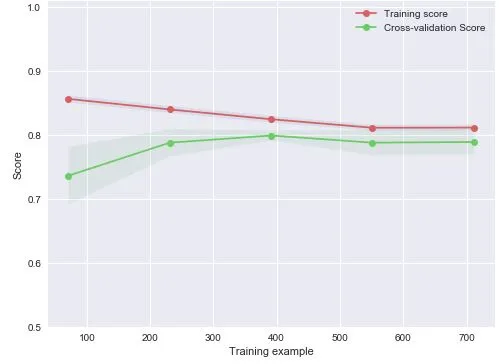
Figure8:Logistic regression model test set learning curve
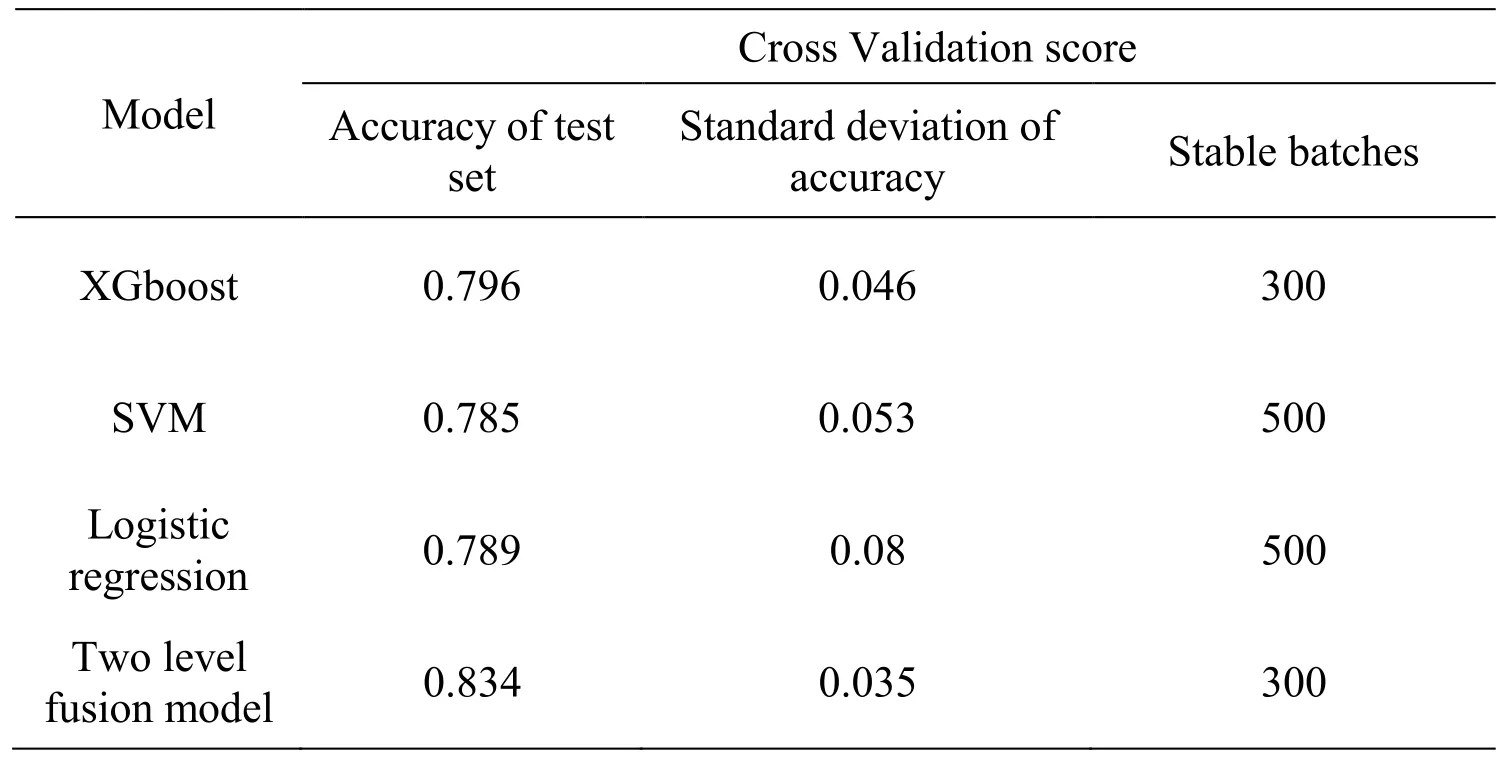
Table2:Stratified sampling cross-validation results
When determining the final number of features,the parameter changes of the rule tree model are as follows:(1) The number of trees is 40,60,80,(2) Tree depth:4,6,8,In each test,a 10-fold cross-validation method was used to verify the features from the top 70 to the top 125,and finally the top 84 dimensions were selected according to the test set effect.The characteristics of “sms_opp_len_rate” and len_count_12_rate of the process data is highly recognized.
6 Comparison and analysis of experimental results
This paper introduces an efficient method for locating key processes and detecting abnormal values of process data in complex production process.In the complex anomaly detection of high-dimensional process data,this method can effectively reduce the data dimension,predict the anomaly samples,and find out the key features that have great impact on the anomaly of process data.Manufacturing enterprises can focus on the protection of these key processes,and industrial control safety personnel can also implement the means of safety protection better.
Comparing with other models,this model can effectively improve the accuracy and variance of anomaly detection,greatly suppress the over-fitting phenomenon of anomaly detection system,and it has better real-time performance compared with traditional anomaly detection models,more conducive to real-time detection of process data.In addition,the fusion structure of the two-model framework in this paper has obvious improvement in model accuracy.And next we will carry out work on how to ensure low variance while effectively improving the accuracy of the model.
Acknowledgement:This work was supported by the National Natural Science Foundation of China,2018.01-2020.12 (No.61773368).The Strategic Priority Research Program of Chinese Academy of Sciences (Grant No.XDC02000000).State Grid Corp of China’s Science and Technology Project “Application of Edge Computing in Smart Grid and Security Protection Technology Research” (52110118001H).
杂志排行
Computers Materials&Continua的其它文章
- Design and Performance Comparison of Rotated Y-Shaped Antenna Using Different Metamaterial Surfaces for 5G Mobile Devices
- A Comparative Study of Machine Learning Methods for Genre Identification of Classical Arabic Text
- Improved Enhanced Dbtma with Contention-Aware Admission Control to Improve the Network Performance in Manets
- Analysis of Bus Ride Comfort Using Smartphone Sensor Data
- Heterogeneous Memristive Models Design and Its Application in Information Security
- Drug Side-Effect Prediction Using Heterogeneous Features and Bipartite Local Models
