A Method for Detecting Short Similar Segments in Music Borrowing
2019-07-30,,,,,,2
, , , , , ,2
(1. School of Computer Science and Technology, Fudan University, Shanghai 201203, China; 2. Shanghai Key Laboratory of Intelligent Information Processing, Fudan University, Shanghai 200433, China)
Abstract: As the first attempt, an algorithm for short similar segments detection is proposed based on the transposition-invariant cross-similarity matrix and the improved sparse cross recurrence plot. To construct the similarity matrix, the center-weighted extended feature is adopted which is able to resist noise and inaccuracy in single frame. Then in order to obtain more accurate position of the similar segments, a combined sparse cross recurrence plot was built by integrating the strength of globally and locally sparse threshold strategies. Experimental results demonstrate the effectiveness of our proposed method, particularly for shorter similar segments.
Keywords: music borrowing;extended feature;similarity matrix;sparse cross recurrence plot
Music borrowing has been pervasive for decades. The music segments borrowed from other musical works are generally short and could be embedded into songs or radio broadcast programs. Music borrowing has several forms with slight difference, such as medley and musical quotation. A medley is generally composed of several segments from other musical works which share some common characteristics, such as singers, record time or genre etc. Musical quotation is generally performed by directly quoting some parts of other music works into a new composition. As mentioned in Ref.[1], in classical music, there has been a long tradition of citing phrases or motives from other composers. It is also very common for popular songs to quote pieces from classical works or other popular songs.
In the digital era, a composer can easily merge several short parts from pre-existing music into his song and release it as his own. Though in a sense such activity can be regarded as creative, it is also likely to be considered as a form of plagiarism and bring copyright infringement. To find short similar segments between two music signals is an interesting and important research topic. From user’s perspective, finding such segments concatenated in a medley or quoted in other songs is full of fun. From the angle of commerce and law, detecting similar segments would be a powerful tool to help protect copyright and judge plagiarism.
The task of detecting similar short segments in music borrowing has something in common with cover song identification and audio fingerprinting. The basic principle of them is to detect similar segments in different audio signals. As shown in Fig. 1, given two audio signalsA1andA2, all the three tasks can be boiled down to the question of judging whether two segmentsS1andS2are similar in content. However, there exists big differences in technical details. Specifically, segments in cover song identification (Fig.1(a)) are usually long and different in tempo, key or instrument, while query snippets in audio fingerprinting (Fig.1(b)) are generally short and only different in signal quality. Compared with the two techniques, the task of music borrowing (Fig.1(c)) is more challenging because segments borrowed are not only short but also possibly different in key, tempo or instruments. That is to say, this task must address the difficulties of both cover song identification and audio fingerprinting simultaneously. Additionally, the lengths (L1,L2) and the segment boundaries ([t1,t2], [t3,t4]) could be any value and are all unknown, which further increases the difficulty.
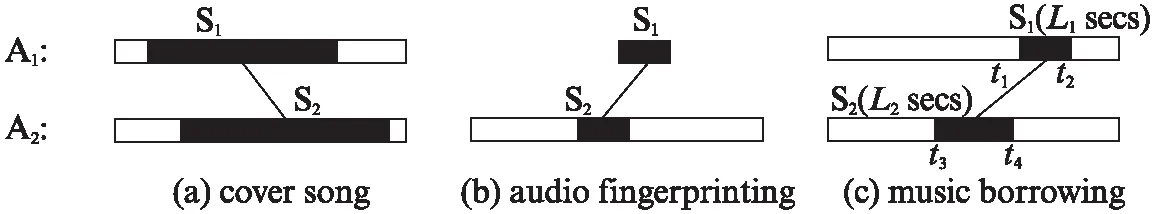
Fig.1 The difference and relationship between cover song identification, audio fingerprinting and music borrowing
To the best of our knowledge, none of the previous audio cover song identification or audio fingerprinting algorithms can be directly applied to automatically solve this problem. As we described above, the technique of detecting short similar segments in music borrowing could be divided into two stages. Firstly, all possible similar segment pairs should be accurately located. Secondly, judge whether they are similar in spite of different key, instruments or tempo.
1 Related work
1.1 Cover song identification
Cover song identification has been a very active area of study over last decades in the Music Information Retrieval(MIR) community. Many techniques have been proposed. Beat-by-chroma feature representations of audio are proposed to make their method resilient to tempo variation. And the cross-correlation in chroma and time makes it resilient to key changes and time skews[2]. A technique based on tonal subsequence alignment is designed in Ref.[3]. In order to obtain a feature matrix that compactly describes a song and is insensitive to changes in instrumentation, tempo and time shift, phase information is removed when computing chroma features. In Ref.[4], beat-synchronous Mel Frequency Cepstral Coefficient(MFCC) sliding windows blocks are extracted, then binary cross matrix is calculated for matching the covers and the originals. The idea of time series shapelets for content based music retrieval is adopted in Ref.[5]. Ref.[6] proposes a fast and effective method for subsequence matching of time-series for cover song identification. For a more in-depth review of cover song identification, the reader is referred to Ref.[7].
1.2 Audio fingerprinting
Audio fingerprinting technique can be used to identify an audio by comparing it to a reference database of audio sequences. A fingerprint system generally consists of two components: extract fingerprints and efficiently search for matching fingerprints in a fingerprint database. The fingerprints are typically computed on the time frequency representation of the audio.In Ref.[8], Bark Frequency Cepstrum Coefficients(BFCC) is adopted and highly overlapping frames are considered to ensure that the query probe can be detected at arbitrary time-alignment. In Ref.[9], AdaBoost technique from computer vision is used to improve the performance of the scheme in Ref.[8]. A scheme based on wavelets is proposed in Ref.[10]. The spectrogram images are converted into a sparse wavelet representation and the popular min-hash technique is used to obtain a 100 byte fingerprint which can be compared directly with byte-wise Hamming distances.
2 Proposed algorithm
2.1 Center-weighed extended feature representation
Chroma feature possesses many prominent properties, such as octave independence, timbre invariance and noise robustness etc.[11-12]. Hence, chroma feature is adopted here as the basis for subsequent processing. We first divide audio frames with Hamming windows of 200 ms and 50% overlap, then use the chroma toolbox described in Ref.[13] to extract 12-dimensional chroma features frame by frame. Then we further introduce a time-delay extended feature representation which is routinely used in nonlinear series analysis[14]to enhance robustness when calculating similarity matrices with chroma. This extended feature representation extends the feature vector of a single frame by concatenating those of its neighboring frames. In this way, it’s able to acquire more temporal information to resist noise and slight tempo variance in audio signals.
However, this time-delay extended feature representation generally blurs the exact positions of start points and end points of matched segment pairs detected in the following sections. To alleviate the negative effect, a Kaiser window[15]is applied to the above extended features. Middle elements of this window corresponding to the current frame are larger than the side elements corresponding to the neighboring frames. Hence the neighboring frames are weakened while the current frame is enhanced. For an audio signal, the center-weighted extended feature E is calculated as follows:
Di(t)=[Ci,t-n,Ci,t-(n-1),…,Ci,t,…,Ci,t+n]⊗w,
(1)
E(t)=[D1(t),D2(t),…,D12(t)],
(2)
whereCis the raw Chroma feature,tis the index of current frame,nis the bidirectional expansion factor,wis a Kaiser window of length (2n+1) with the largest value in the middle. This equation means that thetth frame is centralized and weighted by concatenating its leftnand rightnneighbors. After this process, the center-weighted extended featureE(t) is expanded to (12×(2n+1)) dimensions for thet-th frame. In experiments,nis experimentally set to 25.
2.2 Transposition-invariant cross-similarity matrix
Similar short segments in music borrowing might often be played with different keys, therefore, certain measures must be taken to conquer the transposition problem when calculating similarity matrix. Here, we achieve transposition-invariance by rotating the extended chroma features, similar to the technique of Ref.[16] where each chroma frame is cyclically rotated 12 times when calculating self-similarity matrices to achieve transposition-invariance for music structure analysis. And the difference between our usage and the technique in Ref.[16] is that we use cross-similarity matrix and perform rotations with the center-weighted extended chroma features. The generation of the transposition-invariant cross-similarity matrixSis shown as follows:
(3)
whereS(p,q) is defined as the distance between thepth frame of one musical signal and theqth frame of another one,φrefers to Euclidean distance metric,E1(p) andE2(q) are the center-weighted extended features, andσi(E2(q)) means cyclically rotatingE2(q) byi×(2n+1).
To illustrate the effectiveness of transposition-invariant cross-similarity matrix in finding short similar segments, an example is displayed in Fig.2(a). The unit ofXandYaxis is 500 ms/frame, and the matched parts last about 25 seconds. The left image is transposition-invariant cross-similarity matrix calculated from two songs, whereY-axis represents a songFairytalesung by Malaysian artistGuangLiangandX-axis represents a medley work containing one chorus part of theFairytale. Through careful observation, there are four bright stripes marked with a, b, c and d ranging from 120 to 170 inX-axis. To see more clearly, they are magnified and illustrated on the right. Obviously, these four bright stripes show that there are four segments in the original song similar to one segment in the medley. Listening experiment demonstrates that they are just the four chorus pieces repeated in the original song and the chorus part borrowed in the medley.

Fig.2 (a) An example of transposition-invariant cross-similarity matrix; (b) Short similar stripes extracted
2.3 Improved sparse cross recurrence plot
In this section, the above cross-similarity matrix is binarized to obtain more precise time positions of similar stripes. The binary version is called cross recurrence plot where the value 1 in the point (i,j) means that theith frame of one music signal is similar to thejth frame of another music signal based on a specific threshold policy, and the value 0 means that the two frames are dissimilar. Although cross recurrence plot has been successfully used to mark long similar segments for cover song identification, the above construction method based on simple threshold is untenable in our case, because short stripes spread over the whole image of cross-similarity matrix. Below we propose a two-stage combined threshold strategy. The first stagebinarizes the transposition-invariant cross-similarity matrix by retaining topη% minimum points in a row and a column. The result is called globally sparse cross-recurrence plot denoted asM1in equation (4):
(4)
whereSis the transposition-invariant cross-similarity matrix,rowη(i) andcolη(j) refer to the topηminimum points of theith row and thejth column respectively inS. It is observed in experiments that a smallηtends to generate intermittent stripes and make part of matched segments invisible in the cross recurrence plot, while a bigηresults in some irregular blocks. As a compromise,ηis set as 30 in experiment.
In the second stage, we apply a newly-designed method, named as locally sparse thresholding strategy, on the similarity matrixSto remove those irregular blocks which may interfere with the detection of possibly similar segment pairs. Specifically, we employ a window with lengthLto shift along each column and row in cross-similarity matrixSframe by frame. For each step,rlargest elements inside the window are removed. In other words, those elements with big distance and low similarity value inSare filtered out. This strategy is illustrated in Fig.3(see page 324), where the window of size (L=5) is shifted along a row to get rid of ther(set to 3) largest elements. It shows that currently only the third and the fifth element survive. After such processing on each row and column, the surviving elements are set to 1, while others are set to 0. We denote the cross-recurrence plot generated in this stage asM2, and in implementationrandLare experimentally set as 5 and 10, respectively.

Fig.3 An example of locally sparse threshold strategy with L=5 and r=3
To take advantage of both strategies, a combined solution is adopted to generate the final globally and locally sparse cross-recurrence plotM=M1M2, whererefers to bitwise and operation. The right sub-image in Fig.4 illustrates the effectiveness of the combined strategy. In Fig.4,white-color points stand for 1 and black-color points indicate 0. (a) is the globally sparse recurrence plot withηset to 30, many irregular blocks can be spotted; (b) is the locally sparse recurrence plot withL=10 andr=5; (c) is the sparse recurrence plot with combined strategy. The unit ofXandYaxis is 500 ms/frame. Compared with the left and the middle sub-image, clearer and sparser white stripes can be observed.

Fig.4 An example of globally and locally sparse cross recurrence plot generated based on the transposition-invariant cross-similarity matrix S
2.4 Similar subsegment pairs detection
Inspired by Ref.[17], those points in similarity matrix with the lowest distance value usually indicate true matching. Hence we further select those stripes inMholding the points with the lowest distance value inS. GivenSandMas input, the detailed procedure of detectingNpossibly similar segment pairs is described as below: (1) Pick up the stripe fromMthat holds the point with the lowest value (highest similarity) inS, and record its start and end point information; (2) Those points inSandMbelonging to the extracted stripe are removed to prevent duplicate extraction; (3) Repeat step (1) and step (2) until we have extractedNstripes or no more stripes can be extracted.
To refine the results, we further add some constraints on the above process:
(a) The duration of each detected segment should be longer thantmin(6 seconds in experiment);
(b) If the distance between two stripes is smaller than a threshold value(3 in implementation), these two stripes are merged into one.
Now a set of sparse stripes are obtained, each of which represents one possibly similar segment pair. Note that some segment pairs are actually composed of noise or mute parts, though their similarity might be high. To solve this problem, we draw on a basic assumption that the top-3 largest elements in a 12-dimensional chroma vector are sensitive to acoustic variation[18]. Therefore, if they are changed at least once during a period of time (e.g. 5 sequential frames), the corresponding segment pair is determined to be acoustically related and should be preserved.
After all the above processing, a relatively small number of stripes are preserved, and truly matched segment pairs are included. Fig.2(b) shows the result of extracting short similar stripes between the songFairytale(TongHua) and its medley version, where the possibly matched stripes are clear and sparse. This will significantly facilitate the following similarity calculation.
2.5 Similarity calculation
Finally, we compute the similarity of each detected segment pair corresponding to the stripes preserved. To obtain the key independence, the Optimal Transposition Index(OTI)[2]technique is first exploited to remove key variance between the two segments. The value ofiOTIrepresents the number of bins that one feature vector should be circularly shifted to have maximal resemblance to the other, which is calculated as follow:
(5)
where ‘·’ indicates a dot product,NEis the size of the extended feature vector, andcircshift(q,i) is a function that rotates the vectorqwithipositions to the right. Then the feature vectors are rotated according to the value ofiOTI.

3 Experiments
3.1 Data preparation
To comprehensively evaluate the performance of this proposed algorithm, three simulated and three real-world datasets are set up in experiment. Each simulated dataset is composed of 50 pairs of music signals. For each pair, one is an ordinary song, and the other is a randomly chosen music embedded with one short snippet (8 to 35 seconds) cut from a different version of the ordinary song. Based on the snippet length, the three simulated data-sets are built, named as “DB_sim10” (8 to 15 seconds), “DB_sim20” (16 to 25 seconds), “DB_sim30” (26 to 30 seconds), respectively. Considering the different forms in real life, two real-world datasets are first constructed, named as “DB_medley” contains 30 medley versions and 60 original songs, which are organized into 60 pairs of audio files as each medley work usually corresponds to at least two original songs. The length of perceptually recognizable segments in a medley ranges from 8 to 42 seconds. “DB_quotation” includes 25 pairs of quotation examples where the length of similar segments ranges from 8 to 29 seconds. In addition, we also evaluate the performance of detecting long similar segments. A dataset with regards to cover songs is set up, named as “DB_cover”. It includes 100 pairs of cover songs where the duration of similar parts ranges from 85 seconds to 220 seconds.
3.2 Evaluation method
Given a pair of audio signals, the proposed algorithm detects similar segments and sort them by similarity. Then the start times and end times are output. If the difference between the detected times (t′1,t′2) and the manually annotated ground truth (t1,t2) is within an error range of 2 seconds (5% of total annotated time span in the cover song case), the detection is deemed as correct, which is calculated as follow:
(6)
wheret′1andt′2represent the start time and end time of one detected segment,t1andt2stand for those of the ground truth.
3.3 Experimental results

Tab.1 Experimental results on detecting similar segment pairs
Remarks: Local: with only locally sparse strategy; Global: with only globally sparse strategy; Combined: combined threshold strategy
The experimental results are illustrated in Tab.1. Besides evaluation on the above six mentioned datasets, we also compare the effectiveness of three different strategies constructing the improved cross recurrence plot, i.e., local strategy, global strategy and combined strategy. Detection measure is displayed in the form ofA/B, whereAindicates the number of successful detection andBis the number of total similar pairs in each dataset. With regards to the three strategies, namely global strategy, local strategy and combined strategy to make the improved cross recurrence plot, the combined strategy shows the best overall performance on all datasets. This result is as expected, since it integrates the strengths of both the global strategy and the local strategy.
Specifically, for the method of combined strategy, its detection on the DB_sim10 reaches the level of 90%(45/50). When the length of embedded segments increases, the precision drops down to 82%(41/50) and 78%(39/50) on the DB_sim20 and DB_sim30 datasets respectively. With regards to real-world songs, the detection achieves 73%(44/60) on the medley dataset and 76%(19/25) on the quotation dataset. In general, as a preliminary attempt, these results of finding short similar segments are acceptable and encouraging.
4 Conclusions
A novel algorithm aiming at detecting short similar segments in music borrowing is proposed. By introducing global and local threshold strategies and additional rules, the stripes representing possibly matched segments in the improved cross-recurrence plot becomes sparse and clear to be manipulated. Experiments demonstrate the effectiveness with encouraging results. However, there is a big room to further improve the performance. Replacing chroma with other features which are more suitable for characterizing the main melody, performing more full-scale parameter tuning, or designing more advanced method to refine the candidate matched segments may lead to further improvements.