A Hybrid Model for Anomalies Detection in AMI System Combining K-means Clustering and Deep Neural Network
2019-07-18AssiaMaamarandKhelifaBenahmed
Assia Maamar and Khelifa Benahmed
Abstract: Recently, the radical digital transformation has deeply affected the traditional electricity grid and transformed it into an intelligent network (smart grid).This mutation is based on the progressive development of advanced technologies: advanced metering infrastructure (AMI) and smart meter which play a crucial role in the development of smart grid.AMI technologies have a promising potential in terms of improvement in energy efficiency, better demand management, and reduction in electricity costs.However the possibility of hacking smart meters and electricity theft is still among the most significant challenges facing electricity companies.In this regard, we propose a hybrid approach to detect anomalies associated with electricity theft in the AMI system, based on a combination of two robust machine learning algorithms; K-means and Deep Neural Network (DNN).K-means unsupervised machine learning algorithm is used to identify groups of customers with similar electricity consumption patterns to understand different types of normal behavior.DNN algorithm is used to build an accurate anomaly detection model capable of detecting changes or anomalies in usage behavior and deciding whether the customer has a normal or malicious consumption behavior.The proposed model is constructed and evaluated based on a real dataset from the Irish Smart Energy Trials.The results show a high performance of the proposed model compared to the models mentioned in the literature.
Keywords: Anomaly detection, advanced metering infrastructure (AMI), smart grid, behavior, machine learning, deep neural network (DNN), cyber-security.
1 Introduction
In recent years, there has been a global trend to optimize the use of electrical networks by automating and transforming all parts of the traditional electrical power grid: from the user’s household electrical appliances to the power-generating stations into an interactive and intelligent grid.The need to improve reliability, increase efficiency, enhance flexibility and reduce losses in the conventional power grid has led to the development of smart meters and advanced metering infrastructure, which are the basis for smart grid and smart energy solutions.
AMI is system that replaces traditional mechanical electric meters with a system that integrates electronic smart meters, communication networks, data centers and software to improve and automate meter data collection in order to improve customer service by providing better quality power, dynamic pricing, and billing accuracy.Additionally, the AMI system enables the improvement of power grid operations such as: remote meter reading, load management and demand response, power outage identification and equipment monitoring.
However, digitization and automation of the AMI system exposed this system and even its components to cyber-security risks.Many cyber-security experts [Zetter (2015); Weaver (2015); Ayers (2017)] have proven that the smart meter, which is the foremost component of AMI system, has become a potential target of cyber-attacks and hacking attempts.These malicious attempts (on AMI system) usually aim to realize several outcomes: 1) data theft; 2) electricity theft; and 3) localized or widespread denial of electricity [Wilshusen (2015); Weaver (2017); Foreman and Gurugubelli (2015); Hansen, Staggs and Shenoi (2017)].Electricity theft is among the most dangerous and popular attacks on the AMI system.
According to a recent study, global losses due to electricity theft in 2015 were estimated to around $89.3 billion [Sanders (2016)].Electricity companies have launched smart meters deployment to prevent electricity fraud.However, these digital devices have not proven to be effective defense measures against these phenomena.In May 2010, the federal bureau of investigation (FBI) reported what it considered to be the first case of widespread smart grid fraud.The event dates back to 2009: the puerto rico electric power authority (PREPA) discovered that about 10% of its smart meters were hacked, leading to electricity theft, which cost companies $400 million per year, according to estimates reported in Krebs [Krebs (2012)].In October 2014, BBC News claimed that smart meters in Spain were hacked; causing several fraudulent acts [Ward (2014)].In Quebec, the director of Physical Security estimates that the energy theft can reach up to 1% of the volume of electricity sales ($11.6 billion in 2015) [Boily (2016)].
Experts have recently implemented various approaches to address this situation.These approaches can be categorized as: a) Game-theory based, b) State based, c) Artificialintelligence and machine learning (AI&ML) based
The game-theory based approaches [Amin, Schwartz and Tembine (2012); Cardenas, Amin, Schwartz et al.(2013)], consist in modeling the energy theft detection issue as a game between the power company and the electricity thief.These techniques present a medium detection rate (DR) and medium false positive rate (FPR).The most challenging issue about these models is how to define and formulate interactions between individuals (called “players”) in the form of a utility function.
State-based detection approaches used a monitoring paradigm which can be realized by means of a combination of information generated from advanced devices such as: AMI technologies [Kadurek, Blom, Cobben et al.(2010)], wireless sensors [McLaughlin, Holbert, Zonouz et al.(2012); Lo and Ansari (2013); Yerra, Bharathi, Rajalakshmi et al.(2011)], and RFID [Khoo and Cheng (2011)].State-based models are characterized by a high DR and low FPR.However the cost of implementing these models is very high due to the use of specific equipment.
Artificial-intelligence and machine learning based approaches [Glauner, Meira, Valtchev et al.(2017); Messinis and Hatziargyriou (2018)] play a major role in detecting electricity theft.The main idea of these systems is to perform a behavioral analysis based on smart meters data.This analysis aims at extracting normal or usual energy consumption patterns and building typical consumption profiles.Any deviation from the expected behavior or pattern can be interpreted as a sign of fraudulent or malicious activity.
This paper lays focus on the detection of anomalies in AMI systems as a result of electricity theft.AI & ML approaches are among the most used and efficient solutions in this regard.These approaches can be classified into four subcategories: classificationbased, load forecasting-based, clustering-based and hybrid-based.
In the following part, we review the existing Electricity theft detection models in the literature, according to the AI & ML algorithms utilized.
Supervised classification-based: This subcategory refers to the case where a model or classifier can be constructed only based on labeled dataset in order to classify consumers’ behavior into normal and fraudulent.
Nizar et al.[Nizar, Dong and Wang (2008)] used an extreme learning machine (ELM) algorithm to build an energy theft detection model based on 48 smart meter readings per day.ELM algorithm refers to a type of neural network whose specificity is to have only one hidden layer neurons; the network weights connecting input with the hidden layer neurons are randomly assigned and never updated, while weights between the hidden and output layer neurons are calculated just in a single step.In addition, due to the possible changes in consumer characteristics for some applications (these changes are usually not presented in the current training set); the authors have developed an online version of ELM (OS-ELM) to solve this problem.An intelligent system proposed by Muniz et al.[Muniz, Figueiredo, Vellasco et al.(2009)].This system is composed of two modules: filtering and classification, each one comprises a set of five artificial neural networks.The features used by each neural network are calculated based on historical data and some pre-computed attributes specific to the customer.The filtering module was implemented to identify normal and suspect consumers for the classification module training.In order to improve the detection accuracy rate, this work is extended in [Muniz, Vellasco, Tanscheit et al.(2009)] by introducing a neuro-fuzzy hierarchical system in the classification step.In [Nagi, Yap,Tiong et al.(2010)], the authors used support vector machine (SVM) method to build a binary classifier by using historical data of energy consumption, which is able to detect anomalous consumption behavior, known to be highly associated with fraudulent acts.In addition to the calculation of daily average consumptions features per month, a credit worth ranking (CWR) was calculated to indicate whether a customer delays or evades the payment of bills.These features are usually implemented during the training process in the case of a SVM with a Gaussian kernel.This work is extended in Nagi et al.[Nagi, Yap, Tiong et al.(2011)] where authors combined SVM classifier with a fuzzy inference system-FIS in order to improve the detection hit-rate.The SVM model for energy theft detection was developed in Depuru et al.[Depuru, Wang and Devabhaktuni (2011)].The main idea of this model is to generate an approximation of electricity consumption patterns of customers based on historical consumption data.In the training phase, the SVM classifier was trained with both normal and theft samples.During the validation phase, new samples were classified by a parallel combination of the SVM model and three other rules into three classes: (a) genuine, (b) illegal, or (c) suspicious customers.An extended version of this work is presented in other studies.In Depuru et al.[Depuru, Wang and Devabhaktuni (2012)] a data encoding technique was utilized to minimize the complexity of the instantaneous energy consumption data for evaluation.Furthermore, Depuru et al.applied a system with high performance computing (HPC) algorithms in order to generate a simple and faster classification model for illegal consumers detection with a high accuracy rate [Depuru, Wang, Devabhaktuni et al.(2013)].
Clustering-based methods consist of unsupervised machine learning techniques.Clustering is used to perform an exploratory analysis of unlabeled input data in order to identify hidden patterns in the data or to assemble the similar data into clusters.
In Angelos et al.[Angelos, Saavedra, Cortes et al.(2011)], five features were extracted from historical data of energy consumption of over a period of six months: average consumption, maximum consumption, standard deviation, number of inspections and average consumption of the residential area.These features are used in a fuzzy c-means clustering algorithm to group customers with similar electricity usage profiles.Then, a fuzzy membership matrix and the euclidean distance measure were used to classify normal and irregular customers.Density-based spatial clustering of application with noise (DBSCAN) algorithm was used in Badrinath Krishna et al.[Badrinath Krishna, Weaver and Sanders (2015)] to detect and mitigate electricity theft attempts by detecting abnormal electricity consumption patterns.This approach includes two steps; in the first step, dimensionality reduction is applied using the principal component analysis (PCA) on electricity smart meters readings, where each point refers to a week of consumption readings for a single customer in a 2D space.Afterwards, DBSCAN algorithm is applied to irregular point detection that are far from the dense cluster and represent weeks with anomalous patterns of electricity consumption, which imply the existence of potential electricity theft attempts.Density clustering method is used in Zheng et al.[Zheng, Wang, Chen et al.(2018)] to detect irregular electricity patterns.This method depends on the calculation of two values for each data sample ρi: its local density and its distance δifrom samples with high density.In the majority of cases, the data samples with large γi=ρi∗δiare considered as cluster centers and those with small ρiand large δiare considered as abnormal points.Electricity consumption data of 391 users for a period of one month are used to test and validate this method.The load profiles of 100 users are processed by five types of attacks to evaluate the performance of density clustering method according to the assumed scenarios.
The load forecasting-based techniques can be used to realize an electricity load forecasting model during a specific period of time followed by a comparison of the forecast value of electricity consumption of customer with the one measured in reality.
An auto regressive moving average (ARMA) model is used by Mashima et al.[Mashima and Cardenas (2012)] for the sake of modeling the probability distributions for both normal and abnormal consumption electricity patterns, they also applied the generalized likelihood ratio (GLR) test to detect electricity theft attacks, assuming that the probability distribution applied by the attacker decreases the average value of real consumption.In Krishna et al.[Krishna, Iyer and Sanders(2016)], the authors used an auto-regressive integrated moving average (ARIMA) model to build an electricity theft detection model which consists in comparing the measured and predicted values, assuming that the prediction model has been trained solely with normal samples.The possibility of fraudulent behavior increases with the rise of the difference between the real and the predicted values.In Ford et al.[Ford, Siraj and Eberle (2014); Cody, Ford and Siraj (2015)], authors used respectively a neural network and decision tree algorithm to build a predicting model by learning the electricity consumption behavior of the consumer using historical data.Afterwards, the model will be able to predict future electricity consumption measurements.The root mean squared error (RMSE) is used to detect any deviation between predicted and measured values in order to indentify fraudulent activities.
Hybrid-based methods: researchers designed hybrid methods by combining the different algorithms and techniques described above.In Jokar et al.[Jokar, Arianpoo and Leung (2016); Jindal, Dua, Kaur et al.(2016)] the authors combined an SVM classifier respectively with K-means and the decision tree algorithm to build an electricity theft detection model with a higher detection performance.
According to the above discussion, the proposed machine learning models for electricity theft detection have several shortcomings that can be summed up as follows:
· In most study cases, available datasets are unlabeled; in fact, it is hard to obtain theft samples, which leads to limitations in the DR.
· In the majority of the abovementioned approaches, only electricity consumption data are utilized as inputs.
· Many non-malicious factors such as the number of residents, seasonality and different usage habits during weekdays were not taken into consideration during the development of those models.These factors can alter the electricity consumption patterns and therefore generate false alarms.
This paper is interested in anomaly detection within the AMI data, which is the result of electricity theft.In this context, we suggest a novel hybrid approach based on a combination of two robust machine learning algorithms; K-means and deep neural network algorithm.
The principal idea behind the proposed approach is to model the normal consumption behavior of customers based on electricity consumption data and looking for eventual deviations from this model.
The main contributions of this paper can be summarized as explained below:
1.We present a novel and robust hybrid approach for anomaly detection in AMI data, by combining the advantages of both unsupervised clustering and supervised classification, K-means-DNN approach is particularly effective for anomaly detection in the case of unlabeled and large data sets.
2.Introducing a new neural network model for electricity theft detection by incorporating specific features: residents number, season and day type as input elements.This model provides a practical solution to eliminate non-malicious factors effects and reduces the possibility of false alarms.
3.We evaluate the performance of the K-means-DNN model with real data obtained from the Irish Smart Energy Trials.
In order to assess our proposed model and perform a comparison with the best and most recent electricity theft detection solutions, we generate a synthetic attack dataset based on threat model that has already been defined and used in these solutions.The results obtained demonstrate that the proposed model is quite accurate and significantly effective in detecting electricity theft in comparison with the previous proposals.
Besides the discussion of previous work performed in electricity theft detection, this paper comprises four sections; the first provides the description and preprocessing steps of the available data, the second describes the architecture of the proposed K-means-DNN electricity theft detection model, the following section is devoted to the results obtained, and in the next section we discuss our findings and compare them with the preceding ones, and the last section concludes the whole paper.
2 Data
In Ireland, CER started a process of installing thousands of smart meters in Irish residential consumers, small and medium enterprises (SMEs) buildings, as part of a trial that aimed at studying and adopting smart metering technologies.This experiment lasted eighteen months during which a dataset [Irish Social Science Data Archive (2012)] was generated by collecting readings of smart meters from consumers.In addition, pretrial and post-trial surveys have been contributed by consumers.A pre-trial survey was done with the purpose of getting residential consumers information about the following aspects:
· Demographic profile of residents to provide information such as number of persons residing in each home and their age ranges, household revenue, age categories and employment status.
· Physical features of the residence such as floor size, residence type, number of bedrooms.
· Type and number of electrical devices in the residence.
The smart metering data are stored in six different CSV files, each file has been formatted as follows: meter’s ID, the date and time of data collection, and the amount of consumed electricity in KW each 30 minutes.
2.1 Data preprocessing
The data preprocessing phase is relatively important.This phase determines the quality of the machine learning models generated since, the development of an effective machine learning model does not depend only on the algorithm used but also on the quality of the data with which the model is built and evaluated.Generally, real data are often incomplete (missing values, simplified data), noisy (errors and exceptions), inconsistent (naming, coding).Therefore, to achieve better results in energy theft detection, a variety of data pre-processing techniques were used before implementing any machine learning algorithm [Han, Kamber and Pei (2012)].Fig.1 describes the major data pre-processing methods utilized on the raw energy consumption data: data integration, data cleaning, missing values imputation and feature selection.
2.1.1 Data integration
During the integration phase, we have combined smart metering files and demographic data into a single structure in order to set up single formatted dataset.
2.1.2 Data cleaning
Data in the dataset can comprise several types of errors such as missing information, inaccuracies, and so on.The improper part of the processed data can be replaced, modified or deleted.Data cleansing refers to the operation of detecting, identifying and removing errors that are present within the data stored in the dataset.Electricity consumption data are processed as time series data, so to find the missing values; it suffices to find the missing timestamps.When the percentage of missing values is high for a particular consumer, the data related to this consumer will be eliminated.However, if the missing values for a particular consumer for a specific day and time are scarce, they will be replaced by the average electricity consumption for that particular day and time.
2.1.3 Feature extraction and selection
These are two major methods of pre-processing that directly impact the accuracy of the model.Feature selection is a method of selecting some features out of the dataset and leaving out the irrelevant ones, while the extraction feature consists in transforming, calculating, and combining the original features, to construct a new set of features according to the specific requirements of the ML algorithm.In Section 3, more details about this process will be provided.
3 Proposed methodology
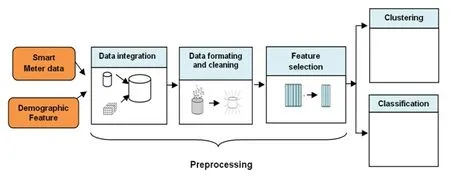
Figure 1: Essential pre-processing steps of data before applying machine learning techniques
This section describes the proposed methodology for the detection of eventual anomalies in AMI system.K-means-DNN methodology has two principal stages, as shown in Fig.2.In the first stage, K-means algorithm is implemented to group customers with similar electricity consumption patterns to understand different types of normal behavior.The second stage utilizes an accurate deep neural network algorithm, besides using electricity consumption data our proposed DNN incorporates specific variables as inputs such as: residents number, season and day type in order to build an accurate detection model capable of classifying customers as a normal or abnormal (malicious) based on consumption patterns.Fig.2 exemplifies the principle idea behind the proposed methodology.The two major steps composing this methodology are explained in the subsequent sections in detail.
3.1 The k-means clustering method
The clustering procedure is an essential step to identify the different normal types of customers.It generates homogeneous clusters from a heterogeneous population of customers, according to their electricity usage behavior.The k-means algorithm is probably the most commonly used clustering method in this context, on the one hand due to its simplicity of implementation and on the other hand because it can provide a good approximation of the desired segmentation.The k-means method groups customers into separate clusters.Thus K-means algorithm serves to construct a typical pattern of electricity consumption by observing different customers clusters.Before starting the clustering process, it is necessary to define or extract a set of features that describes the consumption behavior of each customer.Such features are then used to group customers into k clusters.The features set is constructed by computing the following average and percentage measurements for each customer.
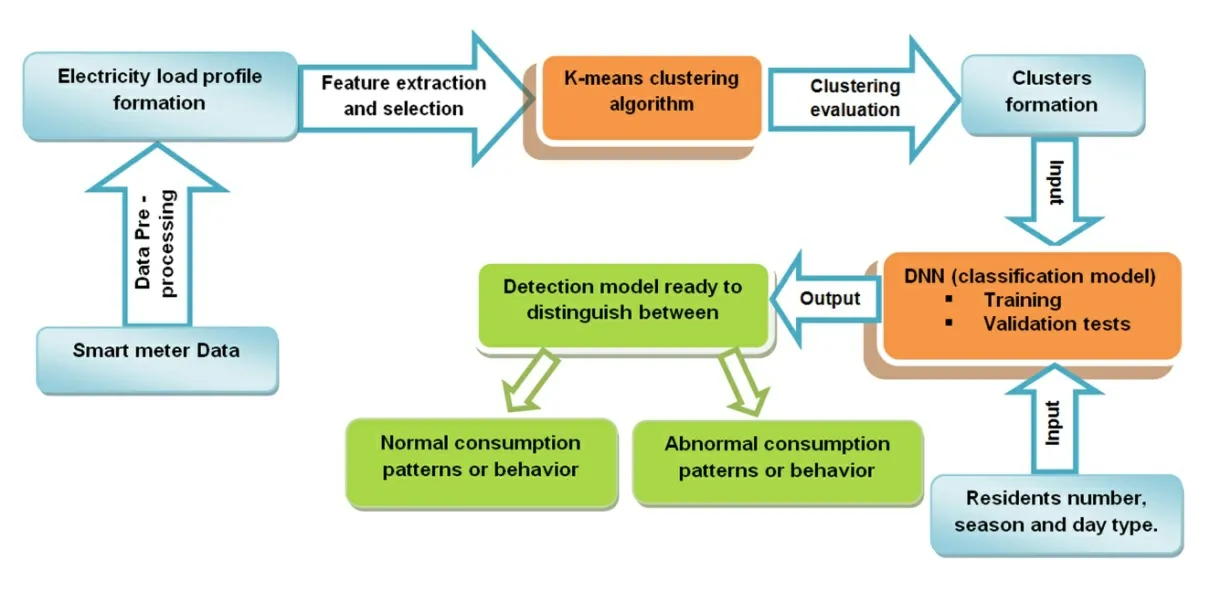
Figure 2: Illustration of the proposed K-means-DNN methodology
· The percentages of electricity consumed during each week day (from Monday through Sunday).
· The percentage of electricity consumed during six different day segments: early morning (7 h-9 h), morning (9 h-13 h), early afternoon (13 h-17 h), late afternoon (17 h-21 h), night (21 h-1 h) and late night (1 h-7 h).
· The total electricity consumed over the test period in KW.
· The average yearly, monthly, weekly, daily, and hourly consumed electricity in KW.· The percentages of electricity consumed over the weekend (WE) and over business days (BD).
The different steps of k-means clustering process are demonstrated in Fig.3.The initial phase consists in performing features extraction from the previously processed data.The extracted features are then used to run k-means clustering.In general, during the k-means clustering process, it is necessary to choose an optimal number of clusters that will highlight the interesting patterns of energy consumption within the dataset.Therefore, the final phase in this process is to assess the k-means clustering process by using the clustering validity indices: silhouette, dunn and davies-bouldin.Afterward, we eliminate groups with a limited number of members.In the next step, only the remaining groups are used for the training of the DNN classifier.Using k-means in this level aims at enhancing classification and reducing false positives.
3.2 Deep neural network methodology

Figure 3: The three Steps of the K-means process
Deep learning is a sub-domain of machine learning which utilizes algorithms inspired from the brain’s neural networks structure and function.For this reason, the models used in the deep learning process are the artificial neural networks (ANNs).An artificial neural network is a computational system that includes many small processing-units called neurons that are arranged in several layers of input, hidden, and output neurons.Their immense capability to learn from massive and complex data has made them the best alternative for machine learning experts.It is worth mentioning that different ANN structures are used to solve machine learning problems.The ANN structure chosen in this paper is a multi-layer neural network (MLNN) that contains multiple hidden layers, also called a deep neural network.A multi-layer neural network is an oriented network of artificial neurons organized into several layers in which information flows from the input layer to the output layer.Neurons are interconnected by weighted connections.The implementation of a multilayer neural network to solve a specific problem requires the determination of the most appropriate weights for each inter-neuronal connection.This determination is carried out through a back-propagation algorithm [Kim (2017)].MLNN consists of a variable number of neurons and layers.A single-layer neural network is the simple architecture of a neural network with single input and output layers.A multilayer neural network is produced by adding hidden layers to a single-layer neural network; therefore, the multi-layer neural network is composed of an input layer, one or more hidden layers, and an output layer.A multi-layer neural network that contains two or more hidden layers is called a deep neural network [Kim (2017)].Fig.4 shows a descriptive representation indicating the mathematical model of an artificial neuron and the structure of a multi-layer neural network with L hidden layers.
In Haykin [Haykin (1999)] the author states that the neuron process can be described mathematically by the following equations:

where, x1, x2...xmare the m input elements.
wi,1, wi,2,..., wi,mare the corresponding weights of the connections.
bi is the bias.

Figure 4: The Multi-layer Neural Network (MLNN) structure with L hidden layers.
fi is called the activation function of the ith neuron.
yi is the output of the ith neuron.
In this study, DNN is used to build an anomaly detection model that is able to detect changes or anomalies in usage behavior and identify whether the customer has a normal or malicious consumption behavior.
It is well known that electricity consumption patterns differ according to several factors such as the number of residents, seasonality, and different consumption habits of the users during weekdays (BD and WE).If these factors are not addressed in an appropriate way, they will increase significantly the FPR.In order to reduce false positives, and unlike most of the previous electricity theft detection systems which were based solely on consumption data, our proposed DNN structure incorporates specific input features: residents number, season and day type.The proposed DNN structure consists of three different types of layers.The first layer (or input layer) includes various features, 24 measurements of electricity consumption per a day, residents number, season and day type (BD or WE).Consequently, 27 is the total number of neurons in the input layer.The second layer usually comprises a few hidden layers having a varied number of neurons.The ultimate layer is an output layer which represents the classification result of the DNN; it consists of two normal or abnormal (malicious) classes.The DNN classifier is trained with scaled conjugate gradient back propagation.The main structure of the proposed DNN is shown in Fig.5, with parameters described in Tab.1.
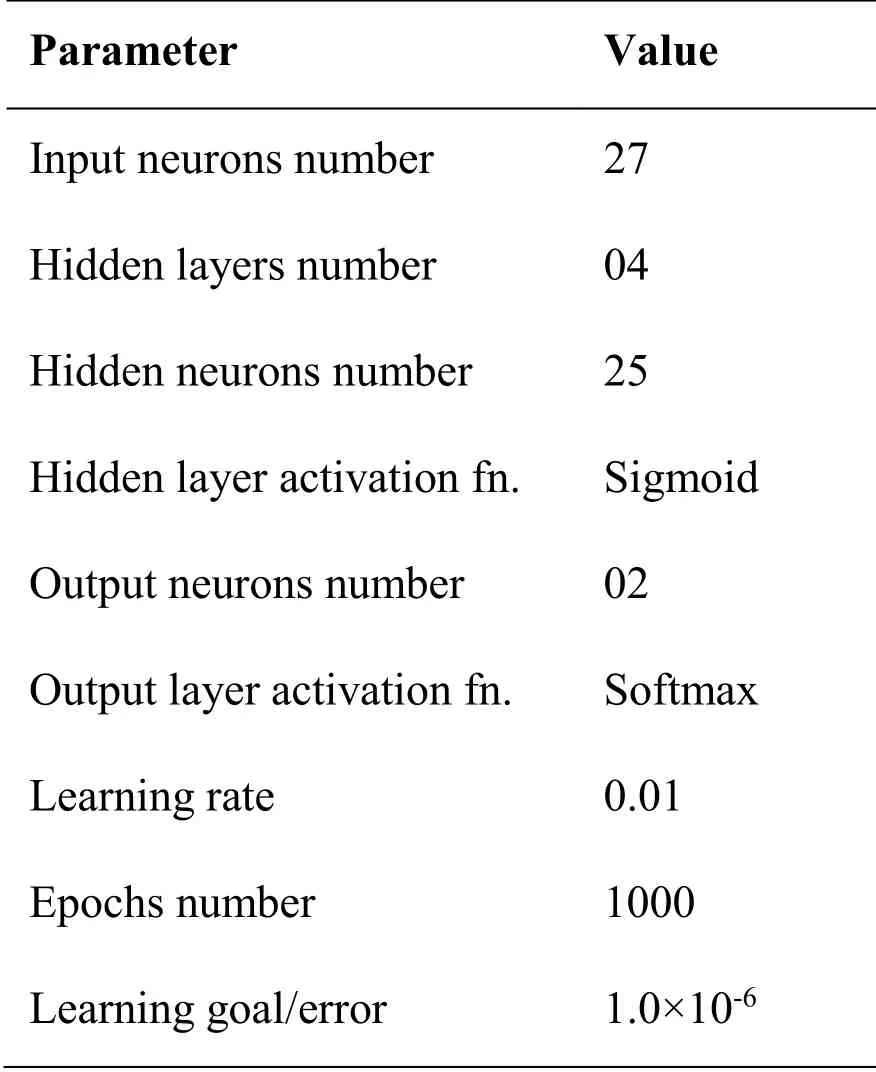
Table 1: Parameters of DNN
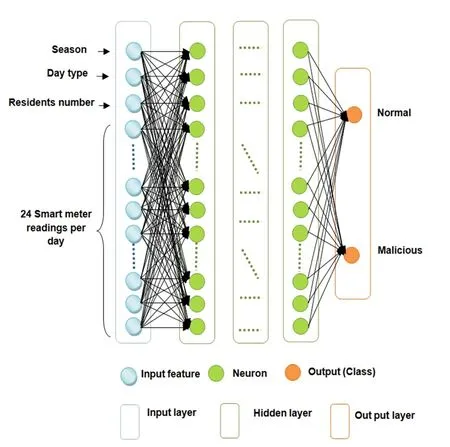
Figure 5: Deep neural network architecture
3.3 Performance metrics
In order to evaluate the performance of the DNN classifier, the detection rate (DR) the false positive rate (FPR) and the accuracy rate were used.These performance evaluation metrics can be calculated from the confusion matrix and defined as explained below.The confusion matrix severs the entire dataset into four (04) parts: true positive (TP), false positive (FP), false negative (FN) and true negative (TN).TP, FP, FN, and TN refer to the numbers of positives correctly predicted as positives, negatives falsely predicted as positives, positives falsely predicted as negatives, and negatives correctly predicted as negatives respectively.
The detection rate (DR) is also referred to as recall, true positive rate, or hit rate in the literature.This evaluation metric indicates the ratio of samples classified as abnormal to the total number of abnormal samples in the dataset.DR is defined as:

FPR is the ratio of the number of samples incorrectly classified as positives (false alarms) to the total number of negatives.FPR is one of the most significant metrics due to the fact that false positives lead to important operational costs to organizations working on electricity theft detection as a result of unnecessary smart meter inspections.FPR is defined as:

The accuracy (ACC) of the classifier refers to the percentage of the correct predictions.

A good classifier has to present high detection and accuracy rates, as well a low false positive rate.
4 Evaluation results
In this section, we present the evaluation results of our hybrid model for electricity theft detection in AMI system.We build and evaluate our proposed model based solely on the data of residential consumers.As a first step, we identify groups of customers with similar electricity consumption patterns to understand different types of normal behavior.With this aim, we execute k-means algorithm based on the features set described in section 3 and vary the number of clusters K from 3-10.The determination of the most appropriate number of clusters k is performed using clustering validity indices; i.e., silhouette, dunn and davies-bouldin.A number k of clusters is considered to be the optimal number if at least two indexes reach their optimal values with it.In the case of an optimal number of clusters, silhouette and dunn indexes must attain their highest values whereas davies-bouldin index must attain its minimum value.Tab.2 describes the value of each clustering validity index obtained after using the k-means algorithm with a number of K clusters varying from 3 to 10.We can observe that the optimal value of the three validity indexes correspond to the number of clusters K=10.Consequently, the optimal number of clusters is considered equal to 10 (k=10).
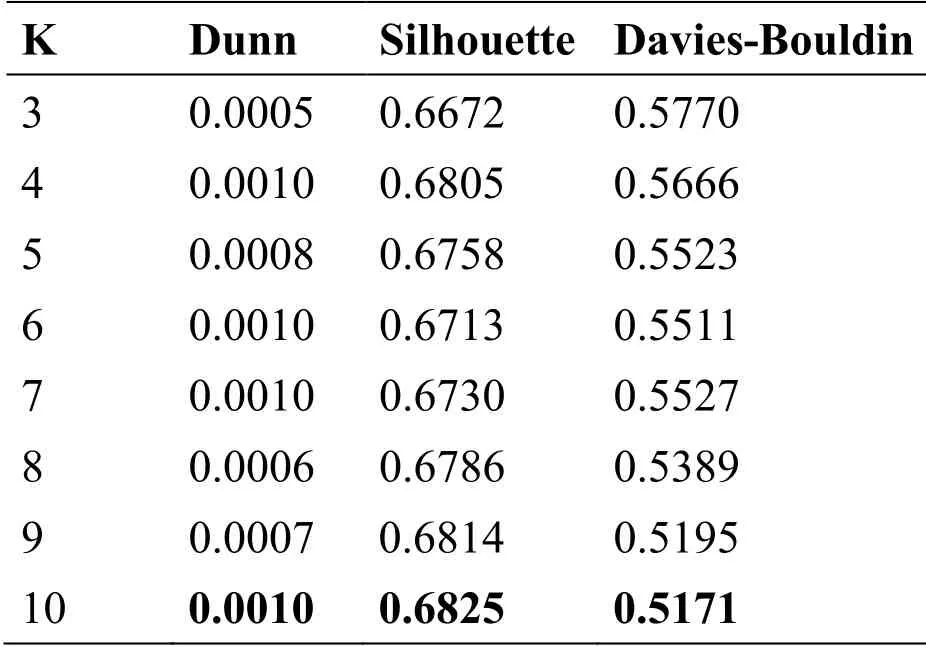
Table 2: Values of different cluster validity indexes with varying numbers of clusters
In order to lessen the contamination of the benign dataset by non-detected threats, we eliminate groups with few members.Clusters that group a large number of customers with similar consumption behaviors are used as benign sample to train and test the DNN classifier.As a second step, we evaluate the DDN anomaly detection model.For this purpose, we use a dataset representing the clusters that group a large number of customers with similar behaviors, obtained by K-means clustering.The dataset consists of only the benign samples which belong to customers with normal behavior.Based on dataset and the pre-trial survey described in Section 2, we generate samples in the appropriate format.For each customer, we create a file that includes 535 samples where each sample is a vector of 27 features representing the detailed 24-hour electricity consumption of the respective day, day type, season and residents number.Then, based on these benign samples, for each sample x = {x1, ..., x27}, we take only features x1.......x24representing the detailed 24-hour electricity consumption to generate a set of six genres of malicious samples as defined in Jokar et al.[Jokar, Arianpoo and Leung (2016)] as explained below:
For t = 1,........., 24:
ℎ1(xt)=αxt, α = random (0.1, 0.8);
ℎ2(xt)=βxt

ℎ3(xt)=γtxt, γt= random (0.1, 0.8);
ℎ4(xt)=γtmean(x), γt= random (0.1, 0.8);
ℎ5(xt)=mean(x);
ℎ6(xt)=x24-t.
In the remaining part of this section, we present the evaluation results of DNN anomaly detector.We perform the evaluation process in two experimental scenarios according to the type of attacks; the fixed type and combined ones.
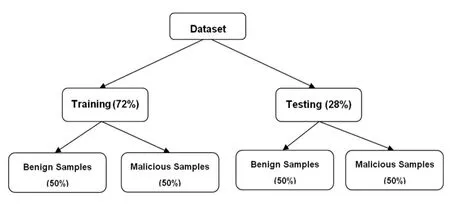
Figure 6: Ratios of benign and malicious samples in training and testing sets
The two experimental scenarios are performed on the basis of data related to approximately 3000 customers, in which each dataset has been divided into a training set (72%) and a testing set (28%) as shown in Fig.6.
4.1 Scenario1- fixed attack
In scenario 1, the performance of DNN classifier in detecting each attack is evaluated and tested separately.For this reason we have generated different datasets for each customer based on the six types of attacks mentioned above.Dataset separation into training and testing sets is an essential part in the evaluation process.This procedure is performed in as follows: within 535 samples of the benign dataset, 383 are used for training and 152 are utilized for testing.During each seven successive days two samples are selected in a random way for the testing set and the other five are selected for the training set.In the same way, for the selected attack type, 535 malicious samples are generated.383 samples are utilized for training and the other 152 samples are used for the testing phase.
Tab.3 describes in detail the statistics of benign and malicious samples utilized in each experiment (i) where i vary from 1 to 6 according to the type of malicious samples used.

Table 3: Statistics of benign and malicious samples used in scenario 1
Tab.4 and Tab.5 present the evaluation results for a certain number of customers in terms of DR and FPR, respectively.

Table 4: Performance results in terms of DR according to scenario 1
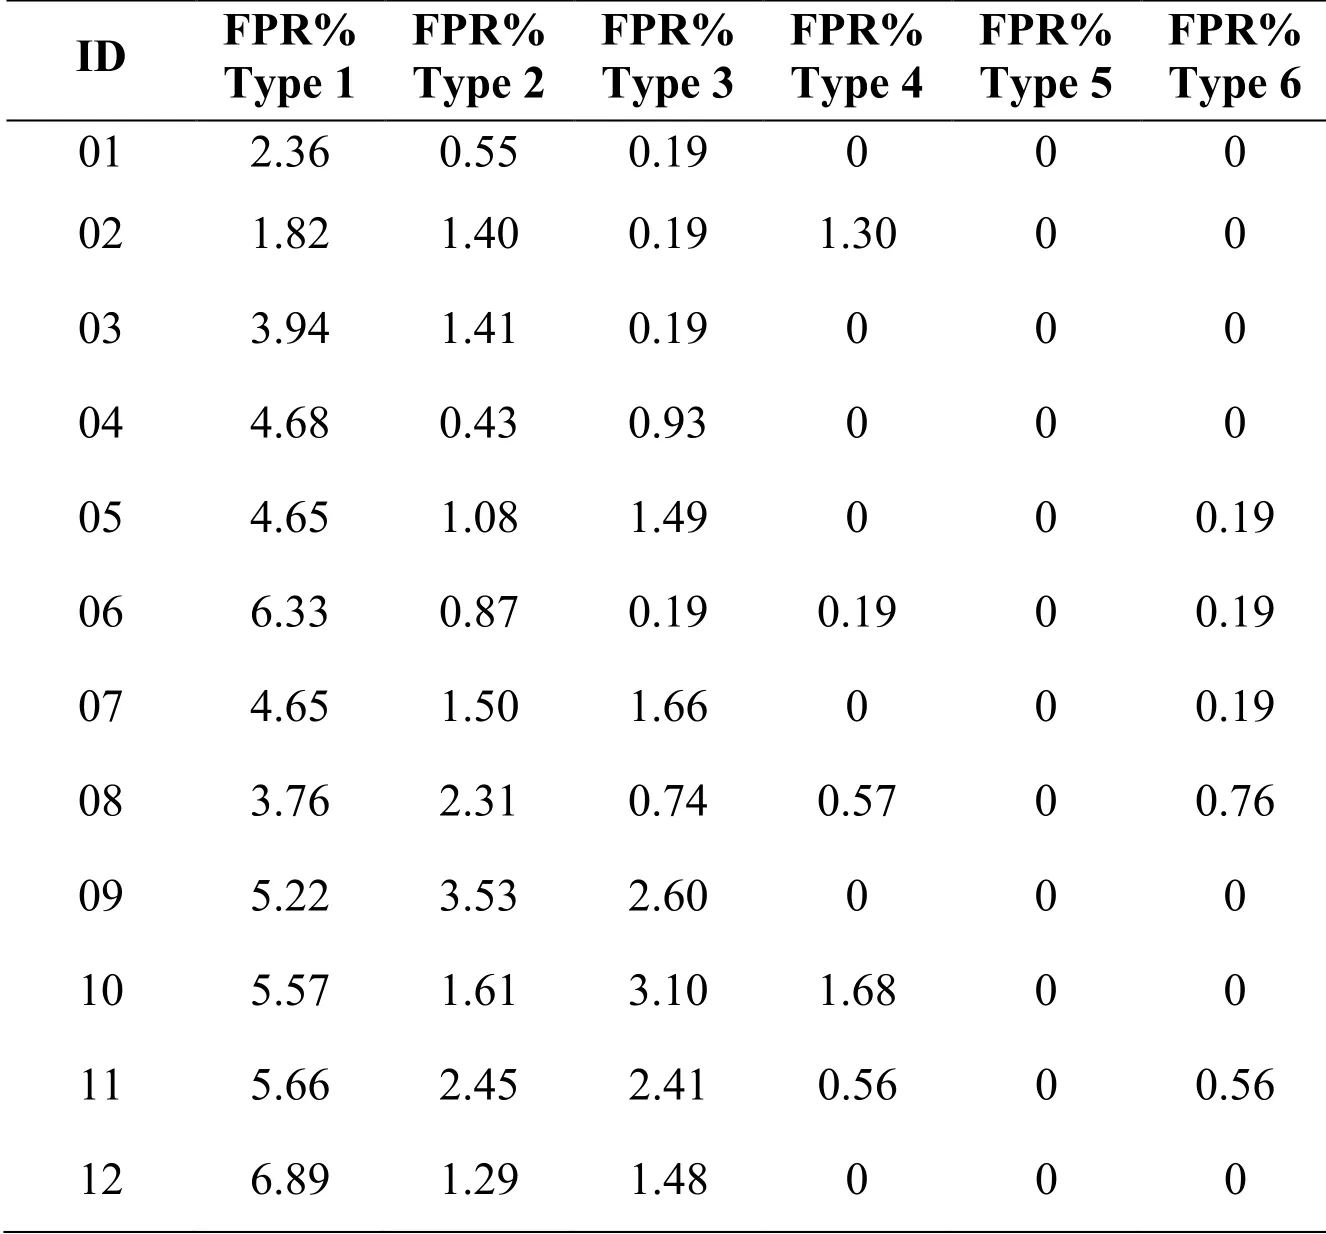
Table 5: Performance results in terms of FPR according to scenario 1.
The evaluation results displayed that the DNN classifier achieved a significantly satisfactory detection performance.Fig.7, Fig.8 and Fig.9 illustrate the ROC curve according to scenario 1, showing the detection performance of three customers: the best, intermediate and worst.

Figure 7: ROC curves for a customer with the best detection performance according to scenario 1

Figure 8: ROC curves for a customer with average detection performance according to scenario 1
4.2 Scenario 2-Combination of six types of attacks
In this scenario, we test and evaluate the efficiency of the DNN classifier in detecting several types of attacks at the same time.The classifier is trained and tested using benign and malicious samples of six types.Tab.6 describes in detail the statistics of benign and malicious samples used in scenario 2.In order to avoid biased results of the classifier towards class of attacks, we have duplicated members of the class comprising benign samples.
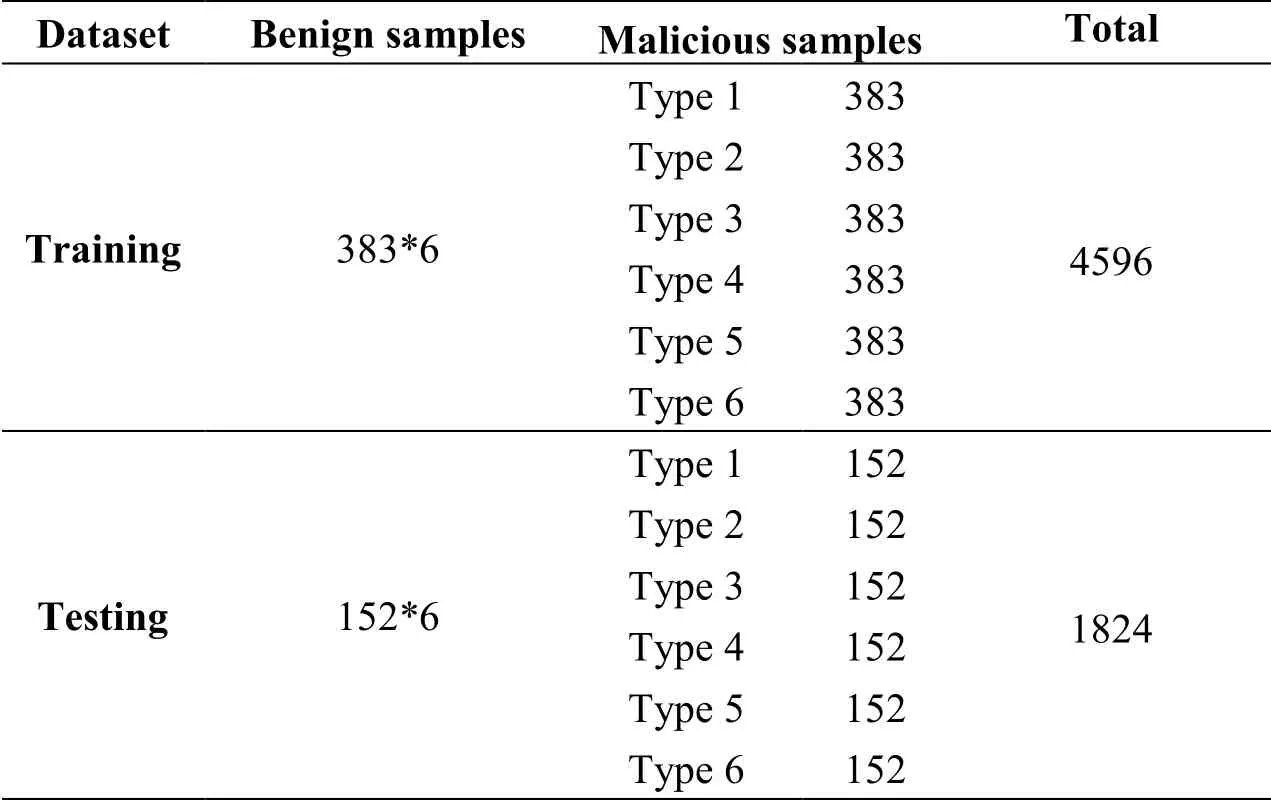
Table 6: Statistics of benign and malicious samples used in scenario 2
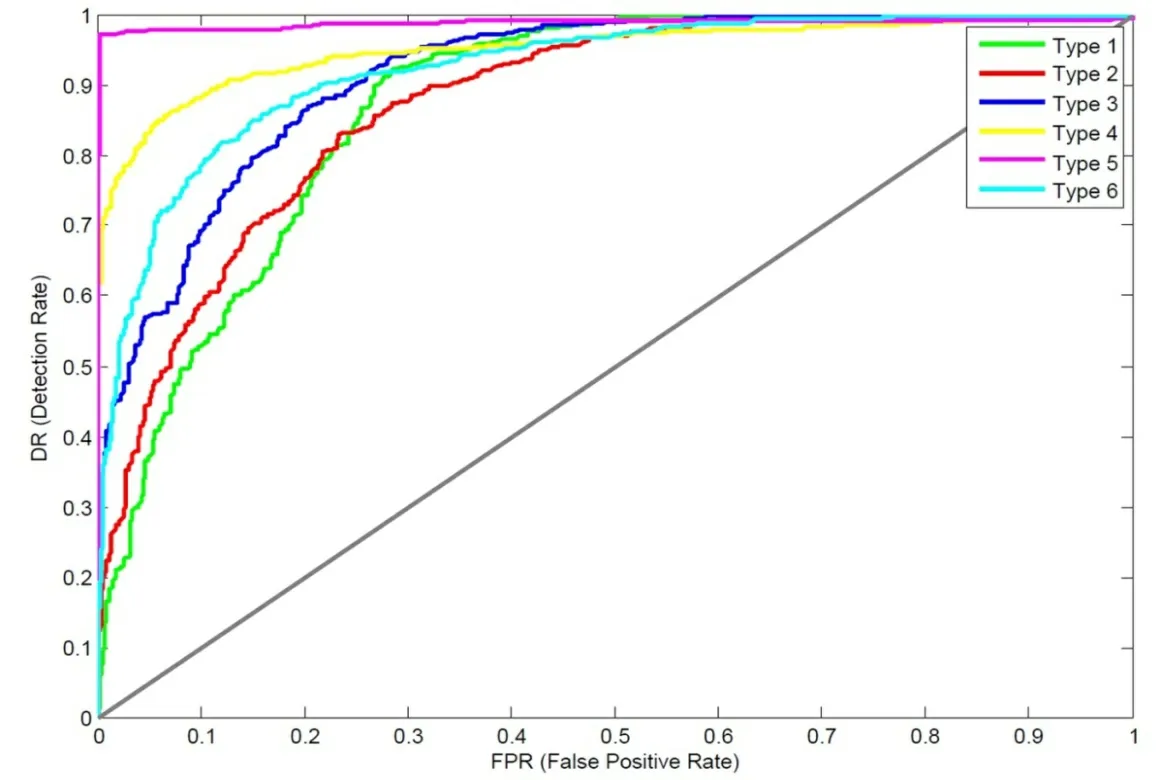
Figure 9: ROC curves for a customer with the worst detection performance according to scenario 1

Table 7: The Performance results in terms of DR, FPR and ACC according to scenario 2 with elimination of specific features
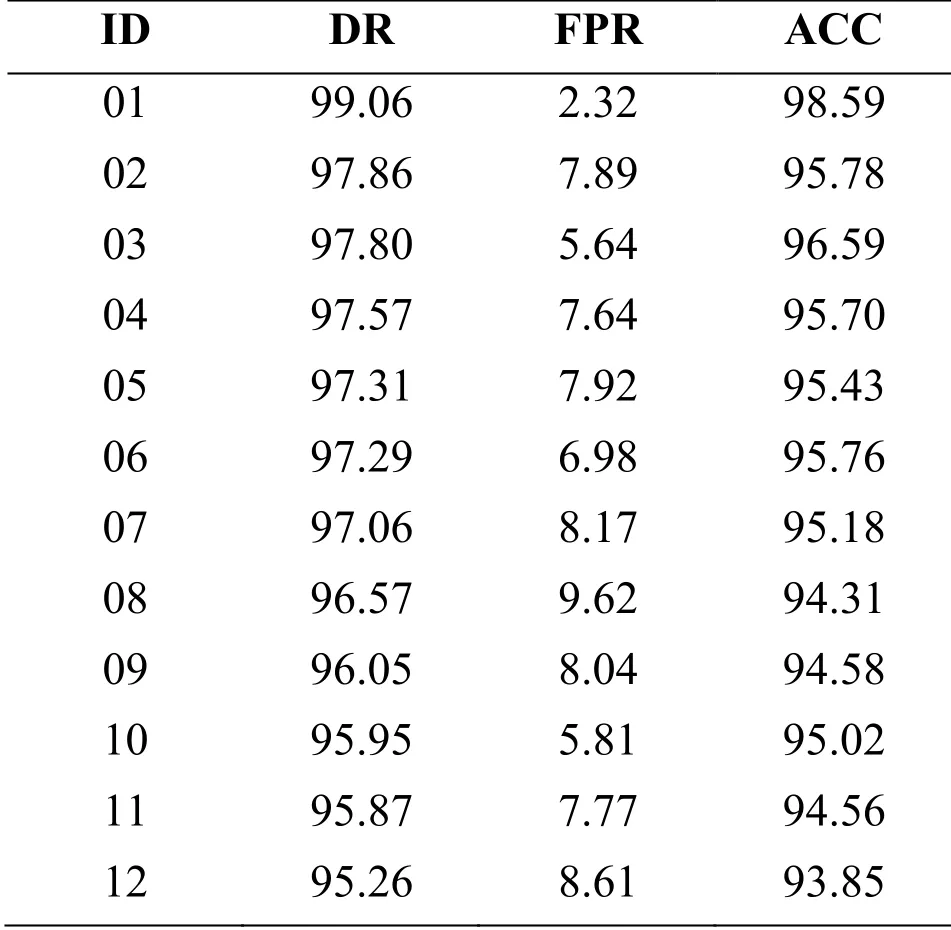
Table 8: The Performance results in terms of DR, FPR and ACC according to scenario 2
For this experimental scenario, the average value of DR and FPR reached 95.38% and 8.86%, respectively, which is very good detection performance.We have re-implemented scenario 2 for a certain number of customers, with one difference that we removed the features related to type of day, season, and residents number.The input features of the classifier in this modified scenario consist solely of consumption data.The evaluation results for this experiment in addition to scenario 2 are classified in terms of DR, FPR and ACC as presented in Tab.7 and Tab.8 respectively.
By comparing the results presented in Tab.7 and Tab.8, we notice that with the elimination of specific features, the DR values decrease and FPR values increase, which limits the detection performance.The results obtained prove the utility of using these features as input variables to enhance the detection performance of DDN anomaly detector.
Fig.10 illustrates the ROC curve for three customers with best, average and worst detection performances.
5 Discussion and comparison
Generally, the normal behavior of electricity consumption varies from one customer to another.(Normal electricity consumption behavior is not the same for every customer).Therefore, it is necessary to identify and extract different normal patterns of electricity consumption especially when dealing with a large and unlabeled electricity consumption dataset.For this reason, the K-means algorithm is used to identify groups of customers with similar electricity consumption patterns to understand different types of normal behavior before training the classifier on these clusters.The aim of the clustering step at this level is to improve the classification process and reduce false positives.

Figure 10: ROC curves for three customers with the best, intermediate, and worst detection performance according to scenario 2
Moreover, several factors can alter the normal consumption pattern of customers such as the number of residents, seasonality and different consumption habits of the customer during weekdays knowing that such factors can cause more false positives.In order to reduce the impact of these factors, we utilized DNN, which is considered as the most successful ML algorithm for classification purposes and trained it with specific and suitable features so as to achieve high classification performance in terms of DR, FPR and ACC.
In Tab.9 and Tab.10 we compare the proposed model with the most recent and best electricity theft detection systems mentioned in the available literature.

Table 9: Comparison among electricity theft detection models

Table 10: Comparison of the proposed model with Density Clustering method in terms of ACC
6 Conclusions
In this paper, we have proposed a novel hybrid approach for detecting electricity theft in AMI system known as the K-means-DNN.This approach consists in modeling the normal consumption behavior patterns of customers.Any significant deviation from this model is identified as malicious patterns.
The numerical results according to the two experimental scenarios demonstrate the effectiveness of the proposed approach for detecting anomalies associated with electricity theft, cascading two machine learning algorithms K-means and DNN anomaly detector provide a high detection performance and make the detection model robust against contamination threats.
Furthermore, the incorporation of specific features such as type of day, residents number, and season as inputs in addition to electricity consumption data reduces the generation of false alarms generated by non- malicious factors.
Moreover, this approach is considered as an initial step towards using deep learning for the sake of electricity theft detection; the results are quite encouraging and pave the way for the use of other deep learning techniques in the future.
In this paper, the proposed model for electricity theft detection can be categorized as entirely data-oriented model because it relies heavily on customer-related data (for example electricity consumption, consumer type etc.).
As a perspective work, we intend to integrate new features such as a weather conditions, number of available appliances and their usage pattern, etc.
Moreover, this model can be hybridized with network oriented models by means of electricity grid data such as network topology or network measurements to achieve higher detection performances.
References
Amin, S.; Schwartz, G.A.; Tembine, H.(2012): Incentives and security in electricity distribution networks.Proceeding of International Conference on Decision and Game Theory for Security, vol.7638, pp.264-280.
Angelos, E.; Saavedra, O.R.; Cortes, O.A.; de Souza, A.N.(2011): Detection and identification of abnormalities in customer consumptions in power distribution systems.IEEE Transactions on Power Delivery, vol.26, no.4, pp.2436-2442.
Ayers, C.E.(2017): The cyber/smart grid tech threat to the integrated north american critical electric infrastructure.https://skyvisionsolutions.files.wordpress.com/2017/03/ayers-testimony-for-mi-housecommittee-7-march-2017.pdf.
Badrinath Krishna, V.; Weaver, G.A.; Sanders, W.H.(2015): PCA-based method for detecting integrity attacks on advanced metering infrastructure.Proceedings of the 12th International Conference on Quantitative Evaluation of Systems, vol.9259, pp.70-85.
Boily, Y.H.(2016): Electricity theft.http://plus.lapresse.ca/screens/2557411e-22c9-4465-97a8-5e52c68add38__7C__BI33naXblYl-.html.
Cardenas, A.A.; Amin, S.; Schwartz, G.; Dong, R.; Sastry, S.(2013): A game theory model for electricity theft detection and privacy-aware control in AMI systems.Proceedings of IEEE Allerton Conference Communication, Control, and Computing, pp.1830-1837.
Cody, C.; Ford, V.; Siraj, A.(2015): Decision tree learning for fraud detection in consumer energy consumption.Proceedings of IEEE, 14th International Conference on Machine Learning and Applications, pp.1175-1179.
Depuru, S.; Wang, L.; Devabhaktuni, V.(2011): Support vector machine based data classification for detection of electricity theft.Proceedings of Power Systems Conference and Exposition, pp.1-8.
Depuru, S.; Wang, L.; Devabhaktuni, V.(2012): Enhanced encoding technique for identifying abnormal energy usage pattern.Proceedings of IEEE North American Power Symposium, pp.1-6.
Depuru, S.; Wang, L.; Devabhaktuni, V.; Green, R.C.(2013): High performance computing for detection of electricity theft.International Journal of Electrical Power & Energy Systems, vol.47, pp.21-30.
Ford, V.; Siraj, A.; Eberle, W.(2014): Smart grid energy fraud detection using artificial neural networks.Proceedings of IEEE Symposium on Computational Intelligence Applications in Smart Grid.
Foreman, J.C.; Gurugubelli, D.(2015): Identifying the cyber attack surface of the advanced metering infrastructure.Electricity Journal, vol.28, no.1, pp.94-103.
Glauner, P.O.; Meira, J.A.; Valtchev, P.; State, R.; Bettinger, F.(2017): The challenge of nontechnical loss detection using artificial intelligence.International Journal of Computational Intelligence Systems, vol.10, no.1, pp.760-775.
Han, J.; Kamber, M.; Pei, J.(2012): Data Preprocessing.Data Mining: Concepts and Techniques.Elsevier, Kaufmann, M., USA.
Hansen, A.; Staggs, J.; Shenoi, S.(2017):Security analysis of an advanced metering infrastructure.International Journal of Critical Infrastructure Protection, vol.18, pp.3-19.
Haykin, S.(1999): Neural Networks and Learning Machines.Prentice Hall, Ontario.
Irish Social Science Data Archive(2012):Irish social science data archive.http://www.ucd.ie/issda/data/commissionforenergyregulationcer.
Jindal, A.; Dua, A.; Kaur, K.; Singh, M.; Kumar, N.et al.(2016): Decision tree and SVM-based data analytics for theft detection in smart grid.IEEE Transactions on Industrial Informatics, vol.12, no.3, pp.1005-1016.
Jokar, P.; Arianpoo, N.; Leung, V.C.M.(2016): Electricity theft detection in AMI using customers’ consumption patterns.IEEE Transactions on Smart Grid, vol.7, no.1, pp.216-226.
Kadurek, P.; Blom, J.; Cobben, J.; Kling, W.(2010): Theft detection and smart metering practices and expectations in the Netherlands.Proceedings of IEEE/PES Innovative Smart Grid Technologies Conference Europe, pp.1-6.
Khoo, B.; Cheng, Y.(2011): Using RFID for anti-theft in a Chinese electrical supply company: A cost-benefit analysis.Proceedings of IEEE Wireless Telecommunications Symposium, pp.1-6.
Kim, P.(2017): Neural Networks and Artificial Intelligence.MATLAB Deep Learning with Machine Learning.Apress, New York.
Krebs, B.(2012): FBI: smart meter hacks likely to spread.http://krebsonsecurity.com /2012/04/fbi-smart-meter-hackslikely-to-spread.
Krishna, V.B.; Iyer, R.K.; Sanders, W.H.(2016): ARIMA-based modeling and validation of consumption readings in power grids.Proceedings of International Conference on Critical Information Infrastructures Security, vol.9578, pp.199-210.
Lo, C.H.; Ansari, N.(2013): CONSUMER: A novel hybrid intrusion detection system for distribution networks in smart grid.IEEE Transactions on Emerging Topics in Computing, vol.1, no.1, pp.33-44.
Mashima, D.; Cardenas, A.A.(2012): Evaluating electricity theft detectors in smart grid networks.Proceeding of Research in Attacks, Intrusions, and Defenses, vol.7462, pp.210-229.
McLaughlin, S.; Holbert, B.; Zonouz, S.; Berthier, R.(2012): AMIDS: A multi-sensor energy theft detection framework for advanced metering infrastructures.Proceedings of IEEE Third International Conference on Smart Grid Communications, pp.354-359.
Messinis, G.M.; Hatziargyriou, N.D.(2018): Review of non-technical loss detection methods.Electric Power Systems Research, vol.158, pp.250-266.
Muniz, C.; Figueiredo, K.; Vellasco, M.; Chavez, G.; Pacheco, M.A.C.(2009): Irregularity detection on low tension electric installations by neural network ensembles.Proceedings of IEEE - INNS - ENNS International Joint Conference on Neural Networks, pp.2176-2182.
Muniz, C.; Vellasco, M.; Tanscheit, R.; Figueiredo, K.A.(2009): Neuro-fuzzy system for fraud detection in electricity distribution.Proceedings of IFSA/EUSFLAT Conference, pp.1096-1101.
Nizar, A.H.; Dong, Z.Y.; Wang, Y.(2008): Power utility nontechnical loss analysis with extreme learning machine method.IEEE Transactions on Power Systems, vol.23, pp.946-955.
Nagi, J.; Yap, K.S.; Tiong, S.K.; Ahmed, S.K.; Mohamad, M.(2010): Nontechnical loss detection for metered customers in power utility using support vector machines.IEEE Transactions on Power Delivery, vol.25, no.2, pp.1162-1171.
Nagi, J.; Yap, K.S.; Tiong, S.K.; Ahmed, S.K.; Nagi, F.(2011): Improving SVMbased nontechnical loss detection in power utility using the fuzzy inference system.IEEE Transactions on Power Delivery, vol.26, no.2, pp.1284-1285.
Sanders, W.(2016): Theft detection algorithm thwarts electricity theft from smart Meters.http://www.siebelenergyinstitute.org/theft-detection-algorithm-developed-withsupport-from-the-siebel-energy-institute-helps-utilities-catch-electricity-thieves.
Ward, M.(2014): Smart meters can be hacked to cut power bills.http://www.bbc.com/news/technology-29643276.
Weaver, K.T.(2015):Investigation: US power grid and ‘smart’ meters vulnerable to hacks.https://smartgridawareness.org/2015/12/21/us-power-grid-vulnerable-to-hacks.
Weaver, K.T.(2017): Smart meter deployments result in a cyber attack surface of “unprecedented scale”.https://smartgridawareness.org/2017/01/07/cyber-attack-surfaceof-unprecedented-scale.
Wilshusen, C.(2015): Critical infrastructure protection: cyber security of the nation’s electricity grid requires continued attention; GAO-16-174T.https://skyvisionsolutions.files.wordpress.com/2015/10/gao-critical-infrastructureprotection-673245.pdf.
Yerra, R.V.P.; Bharathi, A.K.; Rajalakshmi, P.; Desai, U.(2011): WSN based power monitoring in smart grids.Proceedings of IEEE Seventh International Conference on Intelligent Sensors, Sensor Networks and Information Processing, pp.401-406.
Zetter, K.(2015): Countdown to Zero Day: Stuxnet and the Launch of the World’s First Digital Weapon.Broadway Books, New York.
Zheng, K.; Wang, Y.; Chen, Q.; Li, Y.(2018) Electricity theft detecting based on density-clustering method.Proceedings of IEEE PES Innovative Smart Grid Technologies-Asia.
杂志排行
Computers Materials&Continua的其它文章
- A Cross-Tenant RBAC Model for Collaborative Cloud Services
- Outage Capacity Analysis for Cognitive Non-Orthogonal Multiple Access Downlink Transmissions Systems in the Presence of Channel Estimation Error
- Knowledge Composition and Its Influence on New Product Development Performance in the Big Data Environment
- Fuzzy Search for Multiple Chinese Keywords in Cloud Environment
- A Novel Broadband Microstrip Antenna Based on Operation of Multi-Resonant Modes
- Network Embedding-Based Anomalous Density Searching for Multi-Group Collaborative Fraudsters Detection in Social Media
