Hydrogen sulphide detection using near-infrared diode laser and compact dense-pattern multipass cell∗
2019-06-18XingTian田兴YuanCao曹渊JiaJinChen陈家金KunLiu刘锟GuiShiWang王贵师andXiaoMingGao高晓明
Xing Tian(田兴),Yuan Cao(曹渊),Jia-Jin Chen(陈家金),Kun Liu(刘锟),†,Gui-Shi Wang(王贵师),and Xiao-Ming Gao(高晓明)
1Anhui Institute of Optics and Fine Mechanics,Chinese Academy of Sciences,Hefei 230031,China
2University of Science and Technology of China,Hefei 230026,China
Keywords:hydrogen sulphide,wavelength modulation spectroscopy,second harmonic detection,detection limit
1.Introduction
Hydrogen sulphide(H2S)is a toxic,corrosive,and extremely malodorous gas.It has been reported that the H2S contamination is attributed to the second most common cause of death in workplace environments.The threshold limit value is 1 ppmv for an 8-h exposure time and 5 ppmv for a 15-min short-term exposure limit,respectively.However,some workers have been exposed to concentration higher than those values in workplaces such as waste management,petroleum and natural gas extraction.[1-3]The H2S in the atmosphere is related to the increase of acid rain episodes and air pollution events.Natural sources of H2S in the atmosphere are predominantly anaerobic bacteria reduction,degradation of organic matter,and volcanic activities.It has been reported that volcanic eruptions are responsible for releasing up to six thousand times more H2S into the atmosphere.Anthropogenic sources such as petroleum extraction,paper mills,and fossil burning contribute a substantial amount of hydrogen sulphide emitted into the environment.[4-6]The H2S is also a signi ficant amount of natural gas which is extremely corrosive for the gas-pipeline system,especially when it also contains water vapor in high concentration.Thus,the concentration of hydrogen sul fide in natural gas needs to be strictly regulated and controlled.The International Standards Organization(ISO)sets the maximum allowable H2S concentration in natural gas to be 14 ppmv.[7]Therefore,developing a sensor for monitoring H2S in industry and environment is important.
Tunable diode laser absorption spectroscopy(TDLAS),as an important method of on-line real-time analyzing trace gases,has been widely used.TDLAS offers many unique advantages,such as its fast speed,and it is highly selective and highly sensitive in situ quanti fication of gases without any sample preparation.In general,long path length absorption spectroscopy combining with wavelength modulation spectroscopy(WMS)is used to improve the measurement sensitivity and precision.[8,9]Weldon et al.[10]reported that the H2S detection had been implemented by using a distributed feedback(DFB)diode laser emitting at 1.57µm with wavelength modulation spectroscopy,and a detection limit of 10 ppmv for H2S had been achieved.Chen et al.[11]reported a detection limit of 670 ppbv(3σ)for a 2-s averaging time by using offaxis integrated cavity output spectroscopy(OA-ICOS)with a 1571.6-nm DFB laser.Chandran et al.[12]demonstrated H2S detection by using frequency comb laser and OA-ICOS technique.Moser et al.[13]reported sub-ppmv detection of H2S by using a quantum cascade laser with a 100-m astigmatic Herriott multipass gas cell.
In this paper,we report an H2S detection by using a novel,compact,dense-pattern multipass gas cell(DP-MPC)with an effective optical path-length of 29.37 m.The wavelength modulation spectroscopy technique and second harmonic detection technology are employed by using a near-infrared distributed feedback(DFB)diode laser emission at 1.578µm.A minimum detection limit of 13 ppbv is achieved by averaging in 300 s.
2.Experimental details
A schematic diagram of the experimental setup is shown in Fig.1.A fiber-coupled DFB diode laser(157810CE124-01,NEL)operating at 1.578µm and room temperature was used as a light source.The laser current and temperature were controlled with a commercial diode laser controller(Model LDC 501,Stanford Research Systems).Coarse and fine wavelength tunings were performed by changing the laser’s temperature and current,respectively.Wavelength modulation and second harmonic detection were used to enhance the detection sensitivity.[14]The laser wavelength scan was realized by feeding an external voltage ramp from a function generator(DG4162,RIGOL)to the laser diode current which sweeps the laser wavelength back and forth across the absorption line at a rate of 1 Hz.The sine form wave supplied by the sinusoidal signal output of a lock-in amplifier(Model SR 830 DSP,Stanford Research Systems,)with a rate of 3.5 kHz was used to modulate the laser wavelength.The voltage ramp and the sine wave were combined with a home-made adder and then fed to the laser driver.The laser beam was collimated with a fibercoupled collimator(f∼4.8 mm)and subsequently injected into the compact DP-MPC.The laser beam was re flected 243 times in the DP-MPC,and an effective optical path-length of 29.37 m was achieved.The used compact DP-MPC is similar to that reported in Ref.[15],which consisted of two 2′′silver coated concave spherical mirrors separated by a distance of 12 cm.The two mirrors were mounted on an optical board with a dimension of 200 mm×76 mm×10 mm and sealed in a quartz glass tube(Fig.2).The sample volume of the DP-MPC is∼280 cm3,much smaller than that of a traditional concave spherical mirror based Herriott(of∼700 cm3with re flecting 80 times).The output beam was focused onto a photodetector(PDA20CS-EC,Thorlabs)with a lens(f=50 mm).A lock-in amplifier was used to demodulate the absorption signal from the photodetector at a frequency of 2f(where f=3.5 kHz is the modulation frequency of the sine wave).The time constant of thelock-in amplifier wasset to10ms,incombination witha 24-dB/octave slope(detection bandwidth of 7.8125 Hz).The demodulated signal was subsequently digitalized by a DAQ card(NI USB-6210,National Instruments)and displayed on a laptop via a LabVIEW interface.The signal of the photodetector was also acquired to monitor the laser’s power.
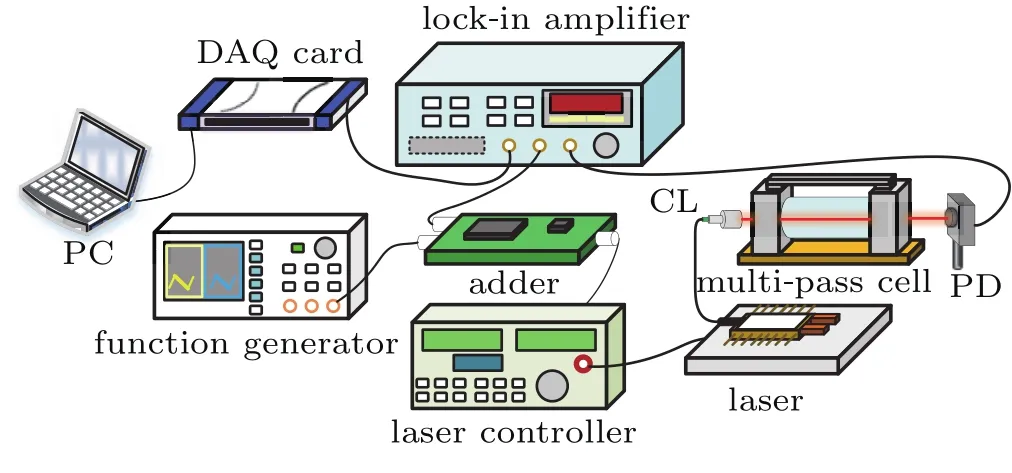
Fig.1.Schematic diagram of experimental device of measurement system.

Fig.2.Spot distribution(left)and photo of multipass cell(right).
3.Results and discussion
3.1.Selection of H 222S absorption lines
The selection of the absorption line for H2S detection is made based on HITRAN 2012 database.[16]The wave length of the used laser is tunable between 6336 cm-1to 6337 cm-1.
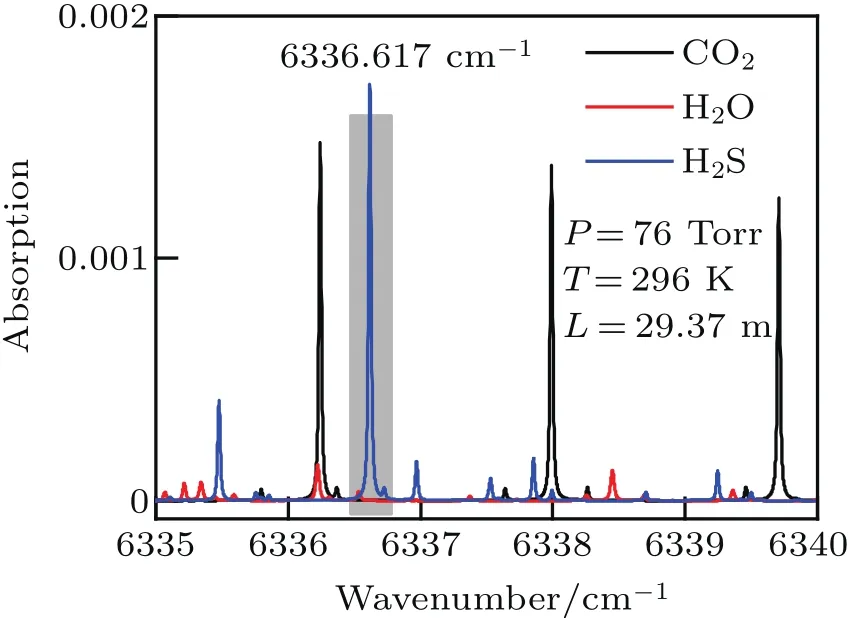
Fig.3.Simulated absorption spectra of 20-ppmv H2S,400-ppmv CO2,and 1%H2O in the tunable range of the laser.
Figure 3 shows the absorption spectrum of 20-ppmv H2S,400-ppmv CO2and 1%H2O in the tunable range of the laser,which is simulated according to the parameters of HITRAN 2012 database at a pressure of 76 Torr(1 Torr=1.33322×10²Pa)with an optical path length of 29.37 m and a temperature of 296 K.The strongest absorption line of H2S,centered at 6336.617 cm-1,without CO2and H2O absorption interference,is selected for H2S detection.The corresponding laser temperature is 19°C,and laser current is 80 mA. The amplitude of the triangular ramp is0.5V(peak-to-peak:1 V),which scans the laser diode current back and forth from 55 mA to 105 mA(50 mA/V).Figure 4 shows the simulated absorption spectra of H2S,CO2,and H2O near the 6336.6 cm-1at a pressure of 760 Torr and 76 Torr,respectively,for the detailed analysis of absorption interference.Figure 4(b)shows that CO2and H2O absorption can influence H2S absorption at normal atmosphere pressure(760 Torr)as a result of pressure broadening.Consequently,the measurement condition of H2S is selected to carry out at low pressure of100Torr.The pressure is controlled by using a pressure controller(MKS)combined with a vacuum pump(SCROLLVAC SC 15D).

Fig.4.Simulated absorption spectra of H2S,CO2,and H2O near 6336.6 cm-1,at pressure of(a)760 Torr and(b)76 Torr,respectively.
3.2.Optimization of modulation parameters
The wavelength modulation spectroscopy(WMS)and second harmonic(2f)detection[17]schemes are applied to the H2S detection.In WMS,the optimization of modulation parameters including modulation amplitude and modulation frequency is required to maximize the 2f signal amplitude and detection sensitivity.[18]To determine the optimum modulation amplitude,2f harmonic signals of 40-ppmv H2S at different modulation amplitudes are investigated and recorded.The 2f harmonic signal amplitude of H2S as a function of modulation voltage is shown in Fig.5.The optimum sine wave modulation amplitude is found to be 0.18 V for H2S detection at a pressure of 100 Torr.The corresponding laser wavelength modulation amplitude is Δνm≈ 0.087 cm-1.According to the HITRAN database,the 40-ppmv H2S line width(HWHM)of the targeted absorption lines is ΔνD≈ 0.04 cm-1.The optimal modulation index “m”is 2.18(Δνm≈ 2.18ΔνD).This value is in agreement with the theoretical result of 2.2(Δνm=2.2ΔνD).[17]

Fig.5.Measured 2f signal amplitude of H2S as a function of laser modulation amplitude.
In addition to the modulation amplitude,the modulation frequency also affects the amplitude of the second harmonic signal.Under the optimal amplitude modulation condition,the influence of modulation frequency on the amplitude of the second harmonic signal is investigated.Figure 6 shows the amplitude of the 2f signal as a function of modulation frequency.The highest 2f signal of H2S is obtained at a modulation frequency of 3.5 kHz.Therefore,the modulation amplitude of 0.18 V and the modulation frequency of 3.5 kHz are selected and used in the following measurements.
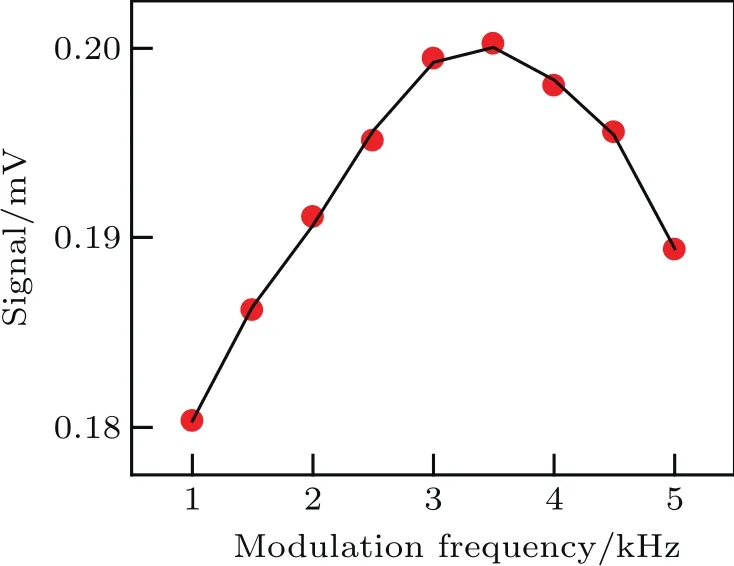
Fig.6.Plot of 2f signal of H2S as a function of laser modulation frequency.
3.3.Background removal
Although wavelength modulation techniques can improve detection sensitivity by reducing 1/f noise,various types of background signals can still be present in wavelength modulation.The main background signals come from residual amplitude modulation(RAM)and optical interference fringes(or etalon effect)caused by the interaction of multiple refl ections in the DP-MPC.[19,20]To reduce the influence of the background signal on the H2S sensor in use,the nitrogen background spectrum is measured by injecting high purity(99.99%)nitrogen into the DP-MPC,as shown in Fig.7.We find that the background signals are almost the same during time series measurement.Therefore,a signal in nitrogen averaged 10 times is recorded as a constant background signal that will be subtracted from the signal of H2S.As an example,figure 8(a)shows a 5-ppmv H2S signal obtained directly from the lock-in amplifier,which contains the background signal.Figure 8(b)shows the 5-ppmv H2S signal after subtracting the background signal,from which a clear 2f signal of H2S is achieved.

Fig.7.Background in nitrogen.
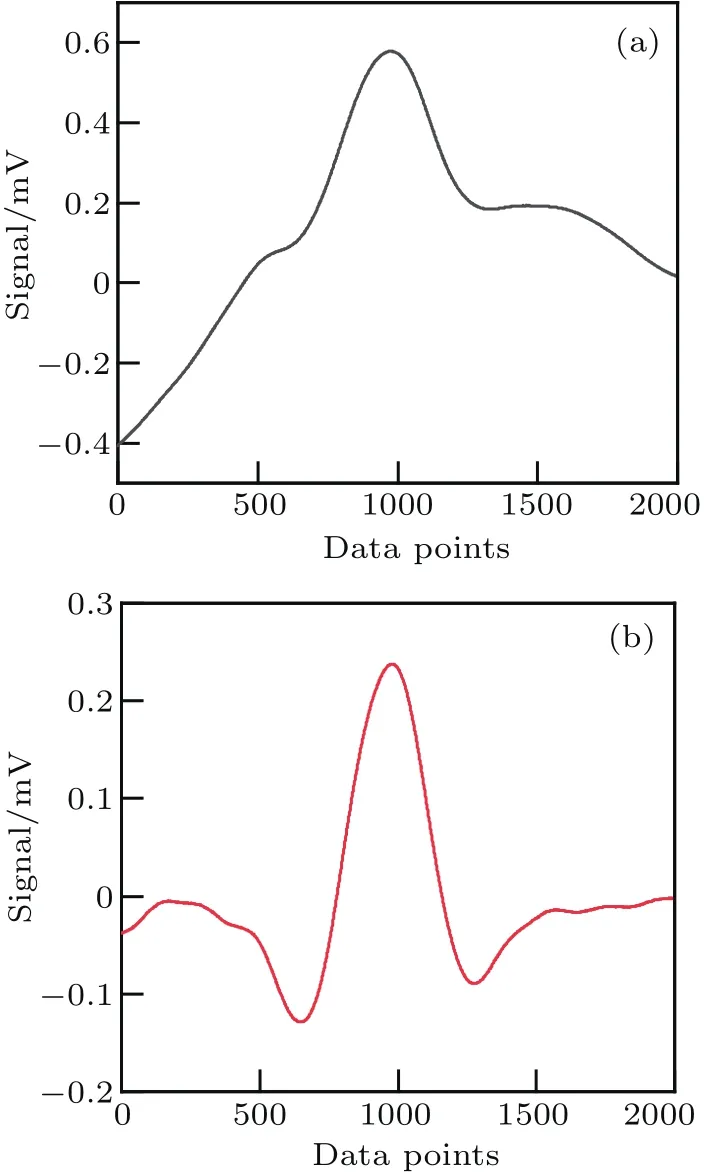
Fig.8.(a)Signal of 5-ppmv H2S with background signal,and(b)signal of 5-ppmv H2S after removing background signal.
3.4.Performance evaluation
To evaluate the H2S sensor’s performance,the linear response of the 2f signal amplitude to H2S concentration is first measured;the results are displayed in Fig.9.In the measurement,a calibrated standard gas of 400-ppmv H2S in N2is mixed with high-purity nitrogen to obtain gas mixtures with different concentrations ranging from 1 ppmv to 35 ppmv by using a gas dilution system(Model 4000,Environics Inc).Figure 9(a)shows 2f signals of H2Sat different concentrations,in which the background signal is removed.Figure 9(b)displays the result of 2f signal amplitude versus H2S concentration.The linear response of the H2S signal to H2S concentration variation is con firmed by fitting the data with a linear slope as shown by a red-solid line in Fig.9(b).The R squared value for linear fitting is>0.99.This demonstrates that a good linear relationship between the 2f signal and concentration is obtained.
Long-term stability and optimum averaging time for the present H2S sensor are evaluated by using an Allan deviation analysis based on a continuous,2-hour,time-series measurement of 5-ppmv H2S.The measured results are shown in Fig.10(a),in which each point was obtained in 1 s,and the unit was changed into ppmv according to the linearity calibration result shown in Fig.9(b).The result of Allan deviation analysis plotted in Fig.10(b)shows that a minimum detection limit is 60 ppbv with an acquisition time of 1 s and a minimum detection limit of 13 ppbv can be achieved by averaging in 300 s.The corresponding noise equivalent absorption sensitivity(NEAS)values are(1σ)7×10⁻¹⁰cm-1·Hz-1/2and 1.5×10⁻¹⁰cm-1·Hz-1/2for 1 s and averaging 300 s,respectively.These results illustrate that the developed H2S sensor can offer good stability and sensitivity.

Fig.9.(a)Measured 2f waveforms for different H2S concentrations at 100 Torr,and(b)2f signal amplitude of H2S and fitting curve as a function of H2S concentration.
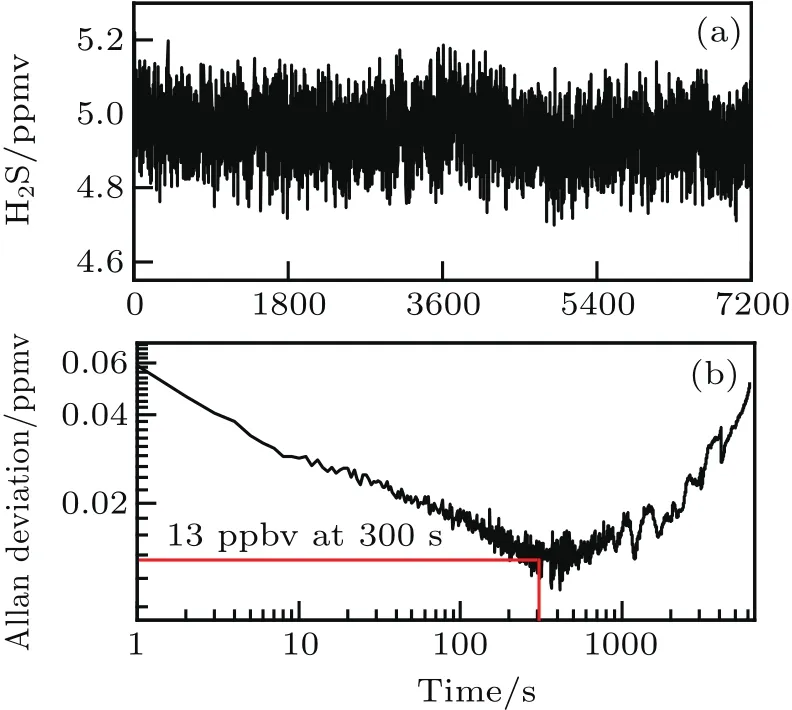
Fig.10.Allan deviation in ppmv of H2S concentration,obtained from time series measurements.
4.Conclusions
Sub-ppmv detection of H2S with near infrared diode laser is achieved by using a compact DP-MPC with a sampling vol-ume of 280 cm3.The absorption line of H2S at 6336.617 cm-1is selected as a target line.A near infrared tunable diode laser operating at 1.578µm is used as a light source,which offers the advantages of low cost,compact size and operation at room temperature.By combining with wavelength modulated absorption spectroscopy technology and back ground removal method,the detection sensitivity of the H2S sensor is improved.Allan variance analysis shows that the detection sensitivity is 60 ppbv in 1 s for H2S detection.The detection sensitivity can be further improved to 13 ppbv by averaging 300 s.Therefore,it is possible to develop a sensitive,compact,handheld H2S sensor for applications in the natural gas industries or in industrial process control.
猜你喜欢
杂志排行

Chinese Physics B的其它文章
- Topological superconductivity in a Bi2Te3/NbSe2heterostructure:A review∗
- The universal characteristic water content of aqueous solutions∗
- Neutral excitation and bulk gap of fractional quantum Hall liquids in disk geometry∗
- Direct deposition of graphene nanowalls on ceramic powders for the fabrication of a ceramic matrix composite∗
- Hard carbons derived from pine nut shells as anode materials for Na-ion batteries∗
- Crystal structures and sign reversal Hall resistivities in iron-based superconductors Lix(C3H10N2)0.32FeSe(0.15<x<0.4)∗