Crystal structures and sign reversal Hall resistivities in iron-based superconductors Lix(C3H10N2)0.32FeSe(0.15<x<0.4)∗
2019-06-18RuiJinSun孙瑞锦ShiFengJin金士锋JunDeng邓俊
Rui-Jin Sun(孙瑞锦),Shi-Feng Jin(金士锋),Jun Deng(邓俊),
Mu-Nan Hao(郝木难)1,2,Lin-Lin Zhao(赵琳琳)1,2,Xiao Fan(范晓)1,2,
Xiao-Ning Sun(孙晓宁)1,2,Jian-Gang Guo(郭建刚)1,2,and Lin Gu(谷林)1,2,‡
1Beijing National Laboratory for Condensed Matter Physics,Institute of Physics,Chinese Academy of Sciences,Beijing 100190,China
2University of Chinese Academy of Sciences,Beijing 100049,China
3School of Physical Sciences,University of Chinese Academy of Sciences,Beijing 101408,China
Keywords:superconductor,Lawrence-Doniach model,dimensionality
1.Introduction
The Fermi surface(FS)topology has been considered as a key ingredient in understanding the mechanism of the ironbased superconductors(SCs).As revealed by angle-resolved photoemission spectroscopy(ARPES)and band structure calculations,the superconductivity and normal state of Fe-based SCs are governed by their electronic structure involving the Fe 3d orbitals crossing the Fermi energy.In iron-pnictide materials,the electronic structure usually consists of hole pockets near the Brillouin zone center(Γ point)and electron pockets near the Brillouin zone corners(M point).[1]The electron scattering between the electron and hole pockets gives rise to a sign-reversed s-wave pairing,[2,3]as proposed by the spin- fluctuation-mediated s±pairing theory.As for the iron-selenide superconductors,experimental evidence suggests quite a similar pairing mechanism for the bulk FeSe and Fe(Te,Se).[4,5]However,the discovery of heavily electron doped(HED)FeSe-based SCs,including AxFe2-ySe2(A=K,Rb,Cs,Tl),[6,7]monolayer FeSe thin films grown on SrTiO3,[8]and the recently discovered(Li,Fe)OHFeSe(FeSe-11111),[9-11]raise a challenge to the aforementioned pairing mechanism.Based on the extensive investigation of ARPES[7,9,12]and STM,[13]it is now widely accepted that the‘hole pockets’,which are crucial in the above pairing mechanism,do not exist in these superconductors.
Without electron doping,FeSe is a typical compensated semimetal with its FS consisting of both hole and electron bands.[1,12]In fact,the Hall coefficient of bulk FeSe changes sign several times with rising temperature.[14]A notable feature of this compound is that it undergoes a ‘nematic’structural transition at Ts∼87 K,below which the Fermi surface is still comprised of hole bands,but the Hall resistivity becomes negative.[12]High pressure can depress the nematic phase and significantly increase the Tcof pristine FeSe from 8 K up to 37 K.[15,16]Meanwhile,Sun et al.recently reported that the normal-state Hall resistivity of FeSe also changed signfrom negativeto positiveunderhigh pressure,[17]demonstrating enlarged hole pockets and enhanced interband spin fluctuations,similar to the observations in high-Tcpnictide systems.However,the FS topology of FeSe-based materials is dramatically changed when suf ficiently high electrondoping(∼1021/cm3)is introduced,leading to an uncommon FS consisting of only ‘electron pockets’.[7,8,10]Unlike the scenario on FeSe,subsequent Hall resistivity measurements on AxFe2-ySe2and(Li,Fe)OHFeSe,[18-21]indicates neither the elevating temperature nor applied extremely high pressure will lead to sign reversal of Hall coefficient,indicating that in these materials the ‘hole bands’are far below the Fermi energy.Meanwhile,a sign reversal of Hall resistance with temperature rising was observed in few-layered FeSe film deposited on SiTO3substrate,[22]suggesting the ‘hole pockets’reemerged in electron-doped few-layered FeSe films.Considering the difference in response of Hall resistance between bulk AxFe2-ySe2or(Li,Fe)OHFeSe material and few-layered FeSe film,it may suggest that the sign change of the Hall constant can be related to the decrease of dimensionality.To answer that question,it is signi ficant to investigate the crystal structures and temperature-dependent hall resistivities of another family of quasi-2D FeSe superconductors,i.e.,the FeSe intercalated by large organic molecules.
In this study,we report the crystal structures,superconductivities and Hall s of 1,3-diaminopropane molecular intercalated FeSCs,Lix(C3H10N2)0.32FeSe(x=0.15,0.2∼0.4).Our results demonstrate that the two new high-Tcsuperconducting phases with FeSe layer distance extended up to∼10.9˚A.Further fitting to the resistivity in terms of the Lawrence-Doniach model and the results of T-dependent diamagnetic responses suggest that the superconductivities in the two compounds possess obvious quasi-2D characteristics.Interestingly,asignofHallcoef ficient(RH)reversingfromnegative to positive is observed at∼185 K in both superconducting phases with temperature increasing,whether their symmetries and doping levels are different or not.First principle calculations reveal that the increase in FeSe layer distance will lift up a ‘hole band’associated with dx2-y2character,and significantly increase the hole carriers around Γ point.
2.Experimental method
All sample manipulations were carried out in an argonfi lled dry box with an O2and H2O content below 1 ppm.Tetragonal Fe1+δSe was synthesized following the method described in Ref.[12].Anhydrous 1,3-diaminopropane(1,3-DIA)(Sinopharm Chemical Reagent,99.0%purity)was puri fied following the method in Ref.[23]. Polycrystalline Lix(C3H10N2)yFeSe(x=0.15,0.2,0.25,0.4,0.6)samples were prepared by the solvent-thermal method.In a typical synthesis,0.0045-mole Fe1+δSe powder,nominal-mole-ratio Li pieces(Alfa Aesar,99.9%purity)and 10-mL ultra-dried 1,3-diaminopropane were placed in a silica ampoule and then sealed.Theampulewasheatedat473.15Kfor12hinanoven,followed by opening the ampoule in an argon- filled dry box and thoroughly rinsing with fresh 1,3-diaminopropane.Finally,the solvent was removed under vacuum,and the dark black product was loaded into the measurement cell for characterizing the structure and physical properties.
The x-ray powder diffraction patterns were used for the characterizing the phase and structure solution.Room temperature power x-ray diffraction(PXRD)spectra of nominal Lix(C3H10N2)yFeSe(x=0.15,0.2,0.25,0.4,0.6)were collected by using a PANalytical X’pert Pro diffractometer with Cu Kα radiation(40 kV,40 mA)and a graphite monochromator in a re flection model(2θ =5°to 80°,step=0.017°(2θ)).Well-grounded fine powder samples on glass slides were loaded into a homemade airtight accessory to prevent the sample from oxidizing during collecting the diffraction pattern.Laboratory in situ PXRD measurements were made by using a Rigaku SmartLab instrument(Cu Kα radiation)equipped with an Anton Paar HTK-600 N oven sample stage(10-2Pa,80 K-300 K).The room-temperature diffraction pattern(at 300 K)was first obtained as a standard,and the low temperature data were collected over the 2θ range of 5°-100°in steps of 0.017°at 85 K,130 K,150 K,170 K,200 K,250 K,respectively.Structure determination and Rietveld refi nement were performed using Fullprof suites.For solving the structures,C3H10N2molecular and FeSe layers were used as independent motifs in a simulated annealing approach,a preliminary structural model is built up with space group P-4(phase I)and P4/nmm(phase II),and then Li position is located by Fourier difference analysis.Finally,Rietveld refi nement against the PXRD data was obtained based on this structure model,with the site occupancies constrained to the sample composition during the re finement.
The sample composition(Li:Fe:Se)were determined by inductively coupled plasma mass spectrometry(ICP-AES).The nitrogen content in each of the samples was determined by using an oxygen and nitrogen analyzer(ONA,Senbao TN-306,Shanghai),with a stand deviation of 0.1 ppm and nitrogen concentration in a range between 0.0005%and 20%.
Magnetization and resistivity measurements were carried out using a SQUID PPMS-9 system(quantum design).Magnetic susceptibility measurements were made in a direct current(DC) field of 40 Oe(1 Oe=79.5775 A·m-1)and a temperature range of 10 K-300 K after cooling in zero applied field and in the measuring field.To ensure metallic contact between the polycrystalline grains,the resistivity and Hall measurement were conducted based on the pressurized samples that are further annealed at 150°C for 12 h.Temperature dependence of the resistivity ρ(T)of Lix(C3H10N2)0.32FeSe was measured in a standard four-probe con figuration with an applied current of less than 2 mA.The Hall coefficient(RH)of Lix(C3H10N2)0.32FeSe was obtained by a linear fit of ρxyand B from-9 T to 9 T at each of the temperatures of 50 K,100 K,150 K,200 K,250 K,and 300 K.
The first principles calculations were performed with the Vienna ab-initio simulation package(VASP).[24,25]We employ the generalized gradient approximation(GGA)in the form of the Perdew-Burke-Ernzerh of(PBE)for the exchange-correlation potential.[26]The energy cut-off for the plane wave expansion is 500 eV.The Brillouin zones were sampled by the Monkhorst-Pack method with meshes of 9×9×12. The structural model of FeSe and Li0.15(C3H10N2)0.32FeSe were based on the experimental structure parameters.The model of(C3H10N2)0.32FeSe was made by omitting the Li in Li0.15(C3H10N2)0.32FeSe,which is appropriate to evaluating the influence of expanded layer distance on electronic structure.To simplify calculations,we omitted the charge neutral 1,3-DIA molecules.Doping was simulated by adding extra electrons into the system,together with a compensating uniform positive background.The added electrons were 0.15 “extra”electrons per Fe atom compared with stoichiometric FeSe,which was in consistent with the experimental result.
3.Results and discussion
3.1.Molecule intercalated phases
Figure 1(a) shows the PXRD patterns of the as-synthesized compounds co-intercalated by 1,3-DIA molecules and Li metal ions with nominal compositions Lix(C3H10N2)yFeSe(x=0,0.15,0.2,0.25,0.4,and 0.6).With the assistance of highly reductive lithium solution(0.15<x<0.6),a series of new phases with much enhanced lattice parameters appear.The first phase pure sample without residue FeSe is obtained at x=0.15(phase I).Based on extinction conditions,the diffraction peaks of phase I is indexed into a primitive tetragonal cell,with lattice parameters a=3.8136(4)˚A and c=10.617(1)˚A.With the increase of Li concentration(0.15<x<0.25),the initial set of re flections rapidly diminishes and is replaced by a new set of re flections.The new phase(phase II)without residue phase I is first obtained at x=0.25,and the pattern is indexed into a primitive tetragonal supercell,with lattice parameters a=3.7906(2)˚A and c=21.632(1)˚A.Strikingly,the diffraction pro files of the new tetragonal phase persist up to x=0.4,suggesting that the phase II tolerates an Li concentration range c from x=0.25 to 0.4.Finally,phase II is decomposed at suf ficiently high Li concentration(x>0.4),with a considerable quantity of impurities Li2Se appearing at x=0.6.The lattice parameters of the phases at different nominal x values are summarized in Table 1.It is worth noting that the tunable dopant concentrations in Lix(C3H10N2)yFeSe(phase II,0.25≤x≤0.4)are in contrast to the discreet metal concentrations found in known intercalated FeSe systems,[27,28]suggesting that the organic molecule intercalated FeSe may serve as an ideal platform to investigate the influence of carrier concentration on the superconductivity in FeSe system.
As shown in Table 1,the ICP-AES analyses indicate that slight lithium loss occurs during the reaction.Meanwhile,the ONA analyses indicate that the intercalated molecules are almost invariant with x value increasing,assuming that all nitrogen species come from C3H10N2molecules.The measured compositions of the two phase pure samples at x=0.15,0.25∼0.4 are Li0.13(C3H10N2)0.32FeSe and Lix(C3H10N2)0.33FeSe(x=0.22∼0.34),respectively.
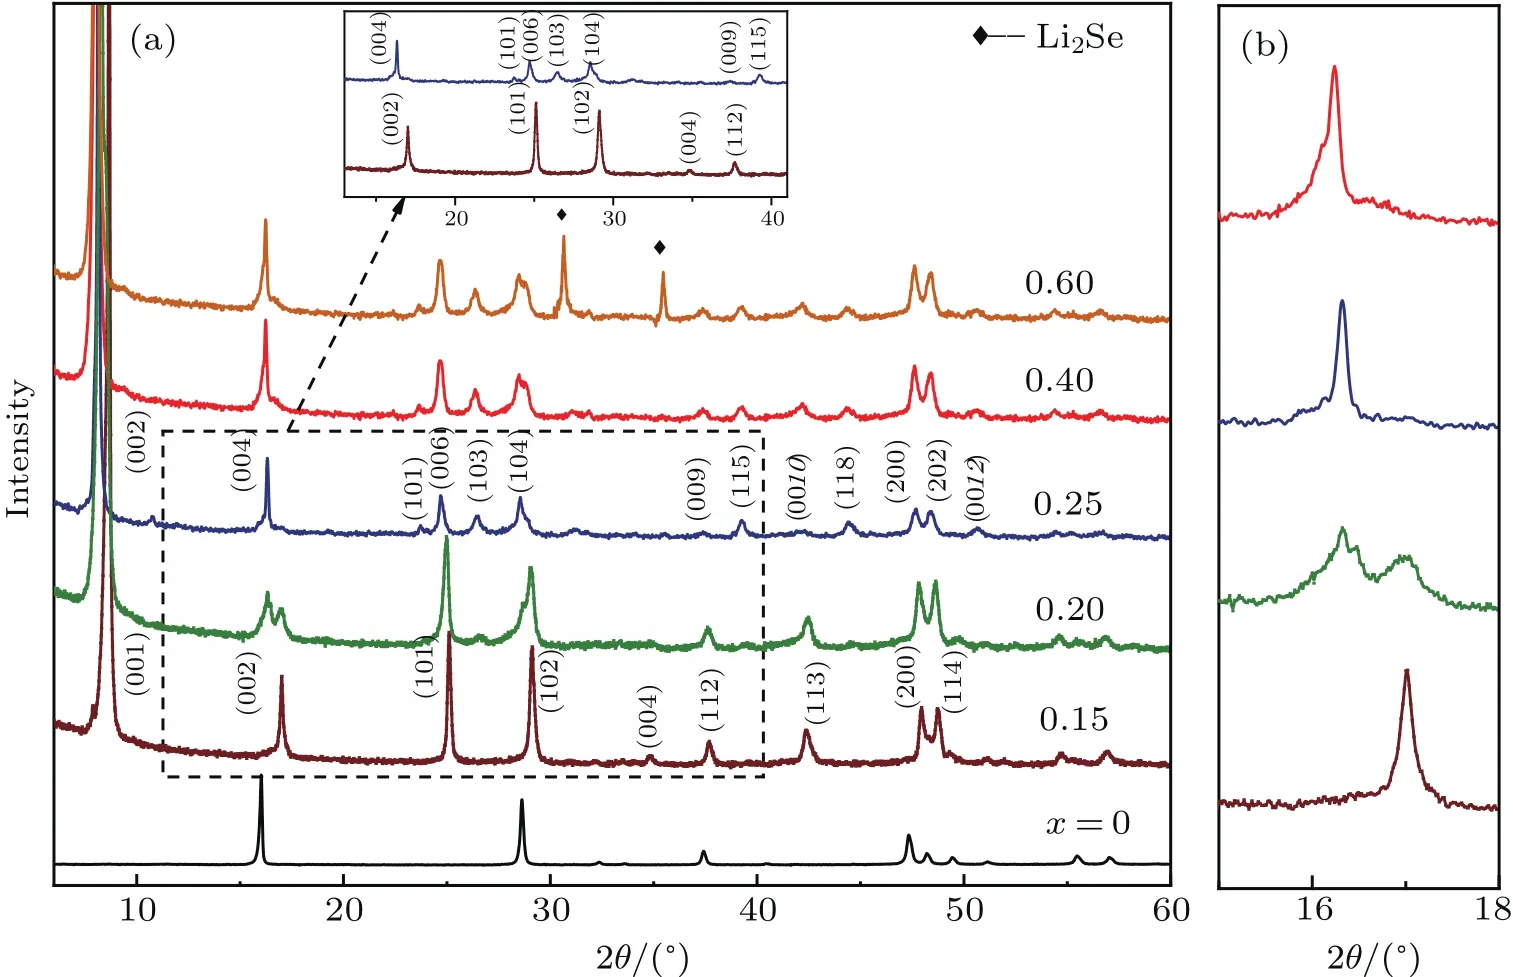
Fig.1.(a)Powder x-ray diffraction patterns of Lix(C3H10N2)yFeSe,with inset showing enlarge view of XRD patterns of x=0.15 and 0.25,and(b)enlarged view of(00l)peak,showing a two-phase region between x=0.15 and x=0.25.
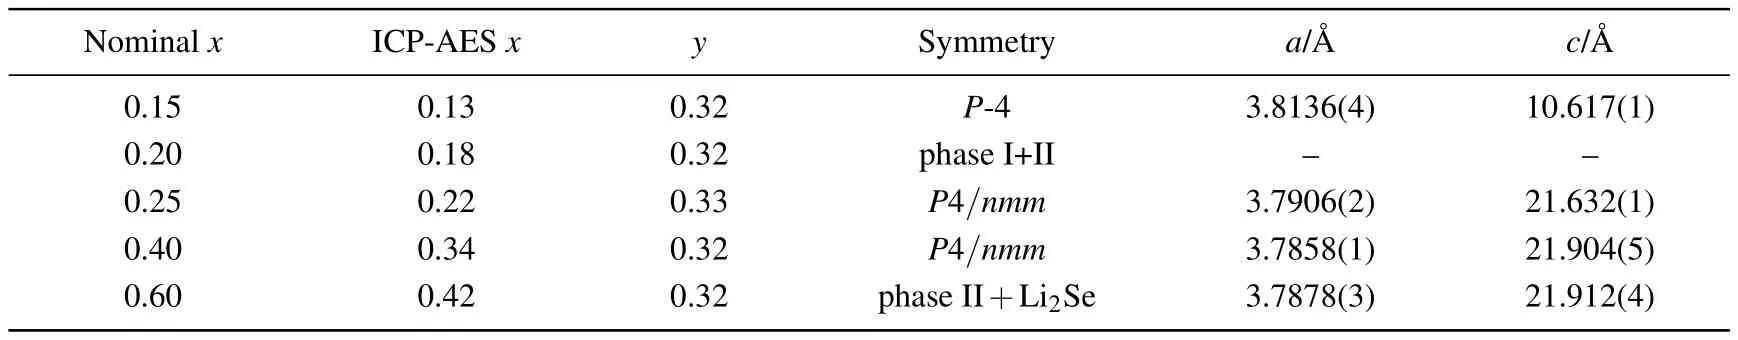
Table 1.Chemical analyses and crystallographic parameters from indexed PXRD data at 298 K for Lix(C3H10N2)yFeSe.
3.2.Crystal structures
Asshown in Fig.2(a),the crystalstructure of Li0.15(C3H10N2)0.32FeSe(phase I,space group P-4)is resolved by ab initio structure determination from PXRD data.Rietveld refinement is performed based on this structure model and produces a satisfactory fit to the diffraction pattern,with Rp=2.35%and Rwp=3.56%at 295 K.As shown in Fig.1(a),the intercalated C3H10N2molecules are centered at the general crystallographic positions 4h site:(x,y,z),and disordered over four diagonal orientations.Under the re fined structure model,the two shortest H-Se distances in the compound are 2.765(4)˚A and 2.779(2)˚A,respectively,which are in consistence with those in the normal hydrogen bonding interactions.[27,29]The two Fe atoms are located at 1a site:(0,0,0)and 1c site:(1/2,1/2,0),and the Se atoms are located at 2g(0,1/2,z)site.Li ions are located at the position adjacent to the FeSe layers at sites 2g(0,1/2,z)site.Moreover,the compressed FeSe4tetrahedra found in Fe1+δSe are retained,with Se-Fe-Se bond angles of 104.0(1)°and 112.3(1)°compared with values of 103.9(2)°and 112.3(4)°in Fe1+δSe.[12]
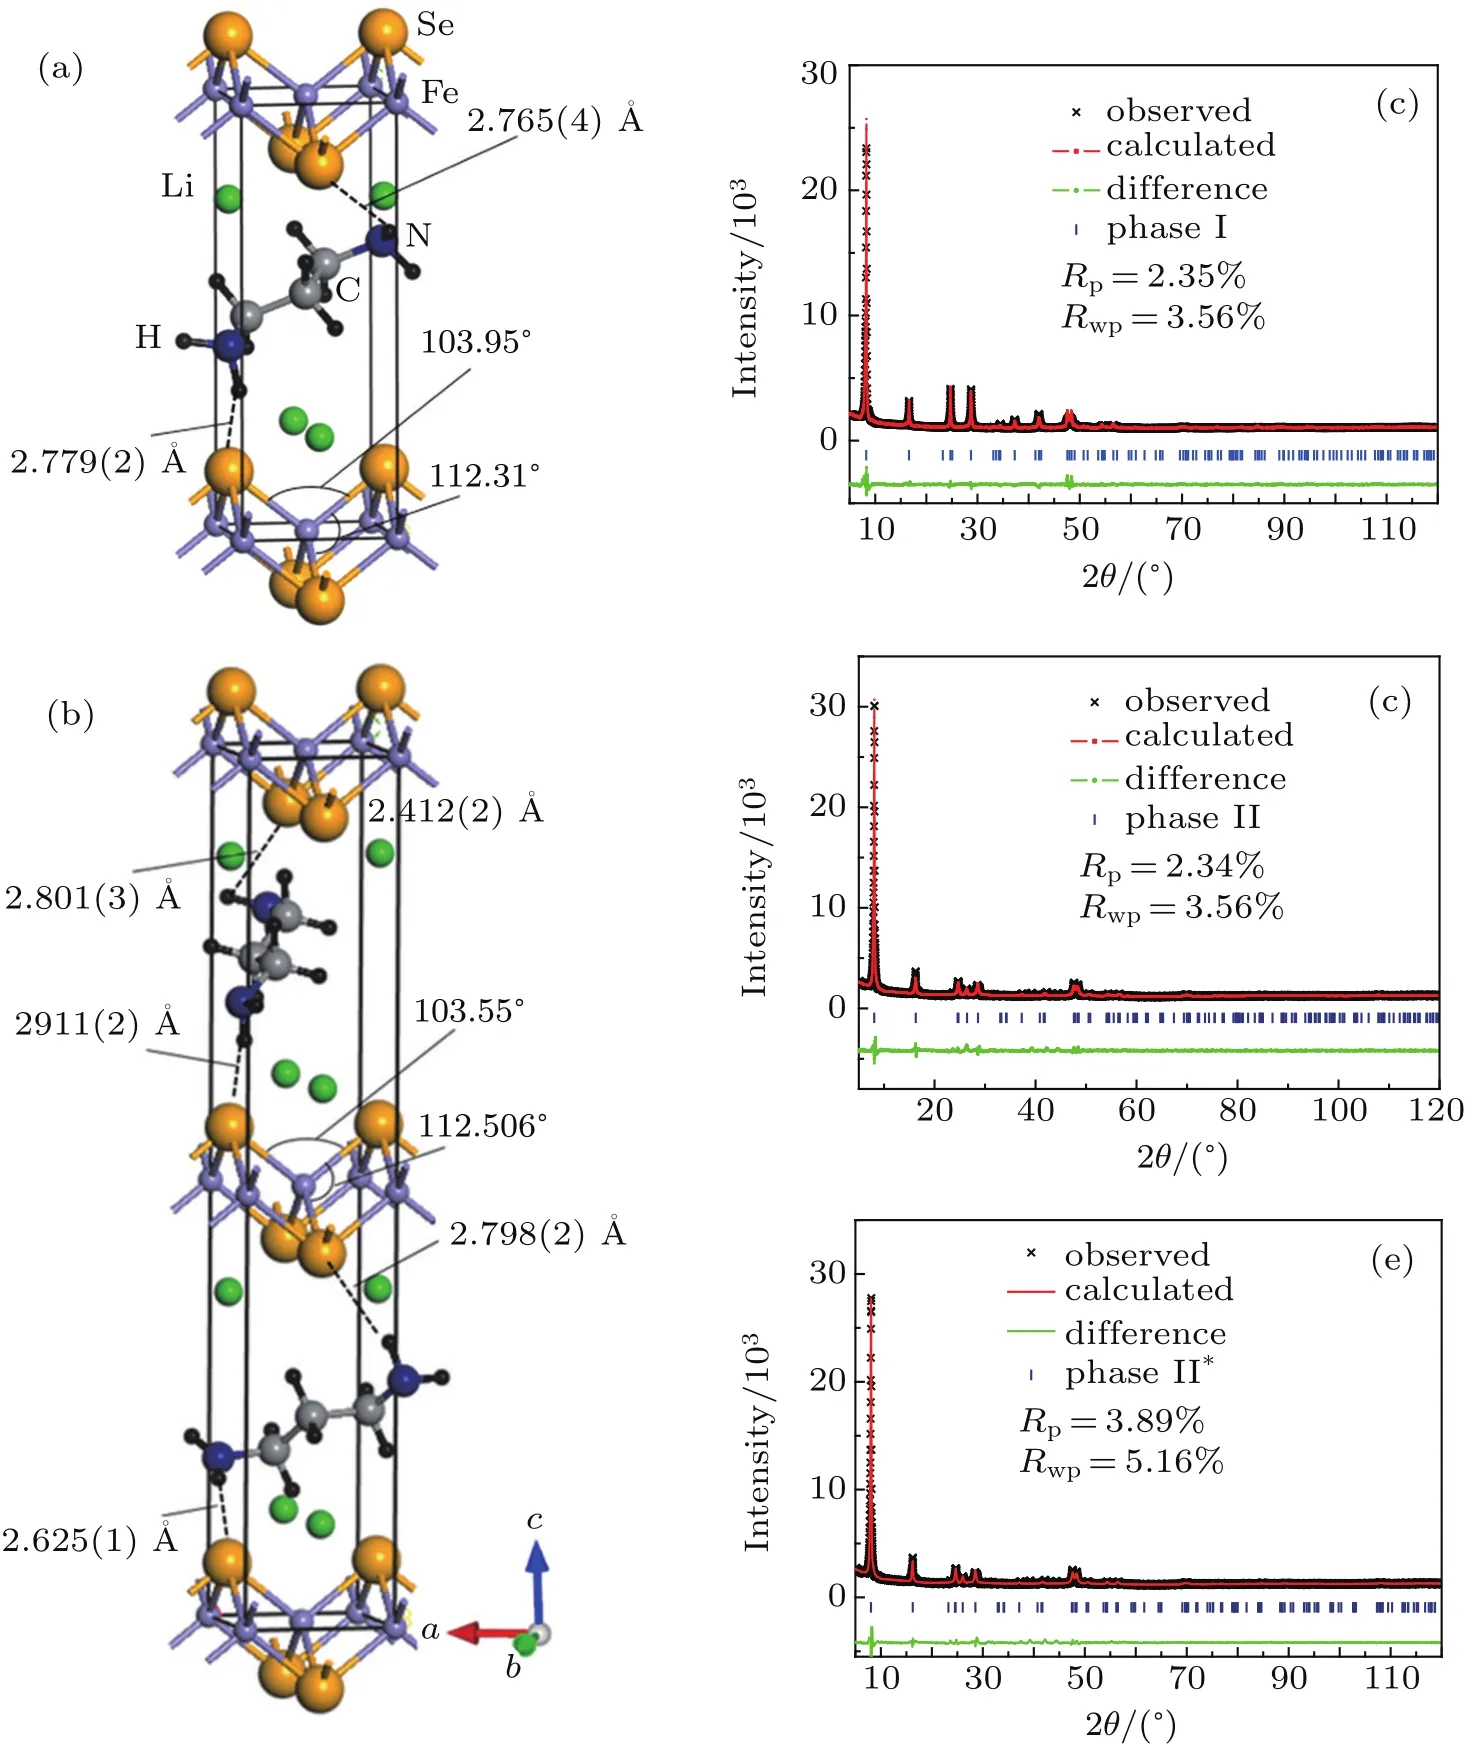
Fig.2.Crystal structures and Rietveld re finements for two phases in 1,3-DIA intercalated FeSe at 300 K.(a)Structural model of phase I.(b)Structural model with orientational disorder of molecules for phase II(x=0.25).(c)Re finement against powder x-ray diffraction data of phase I(x=0.15).(d)Re finement against powder x-ray diffraction data of phase II(x=0.25).(e)Re finement against powder x-ray diffraction data of phase II(x=0.4).
Asshown in Fig.2(b),the crystalstructure of Li0.25(C3H10N2)0.33FeSe(phase II)is successfully determined in a similar manner in space group P4/nmm.The main structural difference between the two phases lies in the fact that with Li concentration increasing,the orientations of the intercalated molecules in phase II between the adjacent FeSe layers become inequivalent to each other.Subsequently,the unit cell is doubled along the c axis.Along with the phase transition,the FeSe interlayer distance is further extended from 10.617˚A to 10.816˚A.There is also hydrogen bonding between the hydrogen atoms and the anion of FeSe layers,with the short HSe bond distances being around 2.63˚A-2.91˚A.[27,29]Moreover,the FeSe4tetrahedra in phase II become more distorted with electron doping increasing.As shown in Fig.1,the Se-Fe-Se bond angles increases from 112.31°to 112.51°,the values are comparable to the results in ammonia intercalated Li0.6(1)(ND2)0.2(1)(ND3)0.8(1)Fe2Se2(112.84(3)°).[27]As shown in Fig.1(e),we also re fine the crystal structure of phase II compound at x=0.4,with the final reliability factors Rp=3.89%and Rwp=5.16%reached.The re fined structural parameters con firm that the doping continuously increases the distortion of FeSe4tetrahedron,with the Se-Fe-Se angle furtherincreasingto112.61°.Meanwhile,the anion height with in the FeSe layer also monotonically increases from 1.491(6)˚A(x=0.15)to 1.497(3)˚A(x=0.4).
3.3.Low-temperature crystal structures
For iron pnictide,a tetragonal-to-orthorhombic structural transition(from C4 symmetry to C2 symmetry)is often observed in the under-doped state.To determine the evolution of Lix(C2H8N2)0.5Fe2Se2crystal structure at low temperatures,x-ray powder-diffraction data are collected for the least electron doped sample(x=0.15)at T=85 K,110 K,130 K,150 K,170 K,200 K,and 295 K,respectively.Figures A2-A8 shows the observed,calculated,and difference diffraction pro files for Li0.15(C3H0N2)0.32Fe2Se2.The low temperature patterns can all be well fitted by the room temperature structure model in the space group P-4,indicating no‘nematic’phase transition occurring between 85 K and 250 K.The temperature-dependent unit-cell parameters a and c values,the Se-Fe-Se bond angles,Fe-Se bond lengths as well as the anion height at the measured temperatures are plotted in Figs.3(a)-3(d)respectively.From 85 K to room temperature,the lattice parameter a increases only by 0.075%,whereas the lattice parameter c expands more obviously by 0.25%.The temperature-dependent structural details are presented in Fig.3.
Fig.3.Response of lattice parameters,anionic Se height,Fe-Se bond length and Se-Fe-Se bond angles of Li0.15(C3H10N2)0.32FeSe to elevating temperature at 85 K,110 K,130 K,150 K,170 K,200 K,and 295 K,respectively.Dashed lines are guides for the eyes.
3.4.Quasi-2D Superconductivity behavior
Figure 4(a)shows the plots of temperature-dependent zero- field cooling(ZFC)magnetic susceptibility of three phase pure Lix(C2H8N2)yFe2Se2(x=0.15,0.25,0.4)samples under an external magnetic field of 10 Oe.The magnetization of the three samples in the whole temperature range up to 300 K are presented in Figs.A9-A11.With the carrier doping from intercalated Li,sharp transitions from normal state to superconducting state are observed at temperature range from 40 K to 45 K in the measured samples.Meanwhile,no noticeable magnetization anomaly is found beyond Tc(Fig.A11),indicating no nematic phase transition occurring in the com-pounds,which is in consistent with the powder XRD data.In Figs.4(b)and A12-A14 we also present the resistivity data of the three compounds,respectively.Similarly,no resistivity kink that may correspond to nematic phase transition is presented in a temperature range from 20 K to 300 K.
The as-synthesized Li0.15(C3N2H10)0.33Fe2Se2shows a diamagnetic transition at Tcup to 40 K with a considerable shielding fraction of 49%at 10 K in the zero- fieldcooling condition.Further con firmation of superconductivity is shown in Fig.4(b),which shows the temperaturedependent electrical resistivity measured on cold-pressed pellets.Apart from the metallic normal state above the Tcin Li0.15(C3N2H10)0.32Fe2Se2,a rapid decrease of resistivity appearsaround 40 K, and zero resistivity is reached at 37 K.With further increasing doping concentration in phase II,the maximum Tcup to 45 K is realized in Li0.25(C3N2H10)0.33Fe2Se2,equal to the optimal Tcvalue of the ammonia-intercalated FeSe.Correspondingly,the electrical resistivity shows the transition around 45 K,and zero resistivity is realized at 42 K.From x=0.25 to 0.4,the Tcis found to slightly depress to 44 K at high Li concentration,indicating that the system enters into an over-doped region.Meanwhile,the superconducting volume fraction continually increases with x value increasing for two phase II samples,with their maximum value reaching 76%,con firming the bulk superconductivity.
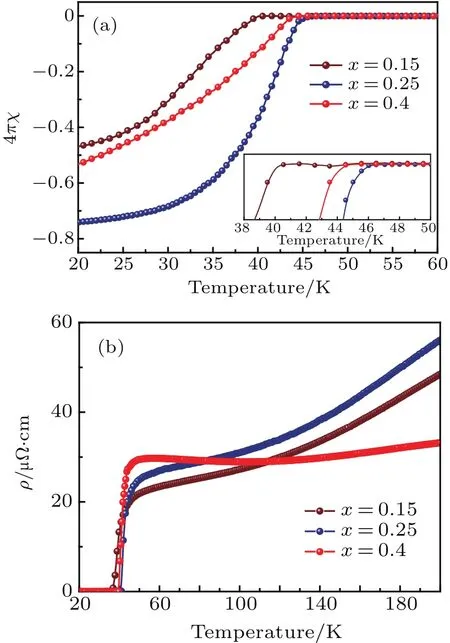
Fig.4. (a)Magnetic susceptibilities of three phase of pure Lix(C3H10N2)yFeSe(x=0.15,0.25,0.4)with inset showing enlarged view. (b)Electrical resistivity of three phase of pure Lix(C3H10N2)yFeSe(x=0.15,0.25,0.4)samples.
For the Lix(C3H10N2)0.32FeSe sample,the intercalation of 1,3-DIA molecule significantly enlarges the distance between the adjacent superconducting FeSe layers,which will weaken the correlation strength along the c-axis for this FeSCs system.The effects of fluctuation on transport property and thermodynamic property are studied for classical layered superconductors,and more extensively,for the high-Tcmaterials.Figures 5(a)and 5(c)display the curves of temperature dependent electric resistivity of Lix(C3H10N2)0.32FeSe at several temperatures,respectively,for the cases of x=0.15 and 0.25.As a signature of the quasi-2D superconductivity in Lix(C3H10N2)0.32FeSe,the resistivity transition near Tconsetbecomes too smooth to determine a mean- field transition point,especially in the presence of a magnetic field. Under zero magnetic field,the transition range from Tconsetto Tczeroof the two samples are quite narrow,i.e.,sample x=0.15 is in a temperature range of 40 K-37 K and sample x=0.25 is in a temperature from 45 K to 42 K.Such narrow transitions are comparable to the transitions of many single crystal samples as shown in Ref.[30],indicating good sample homogeneity.Under external magnetic fields from 0 T to 9 T,the diamagnetic responses of the two samples each show obviously a tailing effect,while the shift of Tconsetis not obvious.This unusual behavior,which has been observed also in high-quality single crystals of layered high-Tcmaterials,[31]has been attributed to the effect of superconducting fluctuations in quasi-2D superconductors.
The fluctuation magnetoconductivity above the superconducting transition temperature(Tc)is hence analyzed in terms of the Lawrence-Doniach(LD)(Eqs.(1)and(2))approach for 2D superconductivity[31,32]
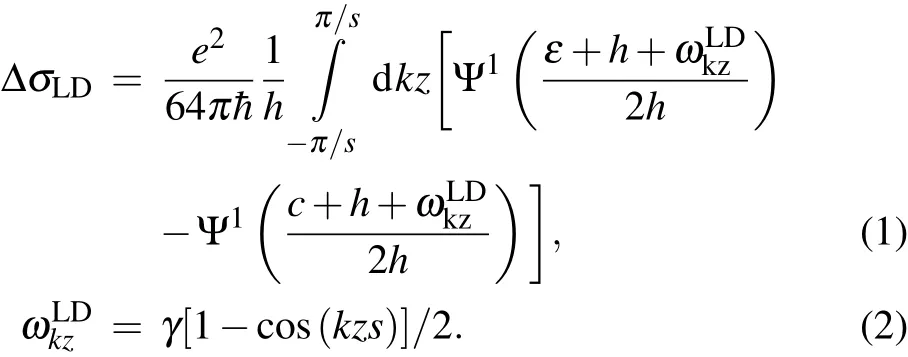
Here,Ψ1is the first derivative of digamma function,e is the electron charge,h is the reduced magnetic field,ε is the ln(T/Tcmid),s is the distance between adjacent FeSe layers,and r is a fitting parameter corresponding to coherence length amplitude ζ(0).Figure 5(b)presents the fluctuation contribution to the conductivity Δσ which varies with temperature under external magnetic fields from 0 T to 9 T.The Δσ is obtained from ρ(T)Hthrough Δσ =1/ρ(T)H-1/ρB(T)H,where the background resistivity ρB(T)His obtained for each field by a linear fit from 55 K to 60 K,above the onset of fluctuation effects.The fittings lead to an averaged ζ(0)=0.9652A˚,a value which is one order of magnitude smaller than the FeSe inter-layer distance.As shown in the inset of Fig.5(b),the experimental Δσ value strongly deviates from the calculated one from the 3D anisotropic Ginsburg-Landau(GL)model,and accords well with that from the Lawrence-Doniach model,clearly showing that the superconductivity of Li0.15(C3H10N2)0.32FeSe is quasi-two-dimensional in nature.Moreover,the fitting also yields a zero-temperature upper critical field Hc2(0)=89 T.As for Li0.25(C3H10N2)0.33FeSe,a similar quasi-two-dimensional superconducting behavior also clearly exists.The fitting based on the Lawrence-Doniach function yields a coherence length amplitude ζ(0)=0.8425˚A,andthezero-temperature uppercritical fieldHc2(0)isobtained to be 82 T.
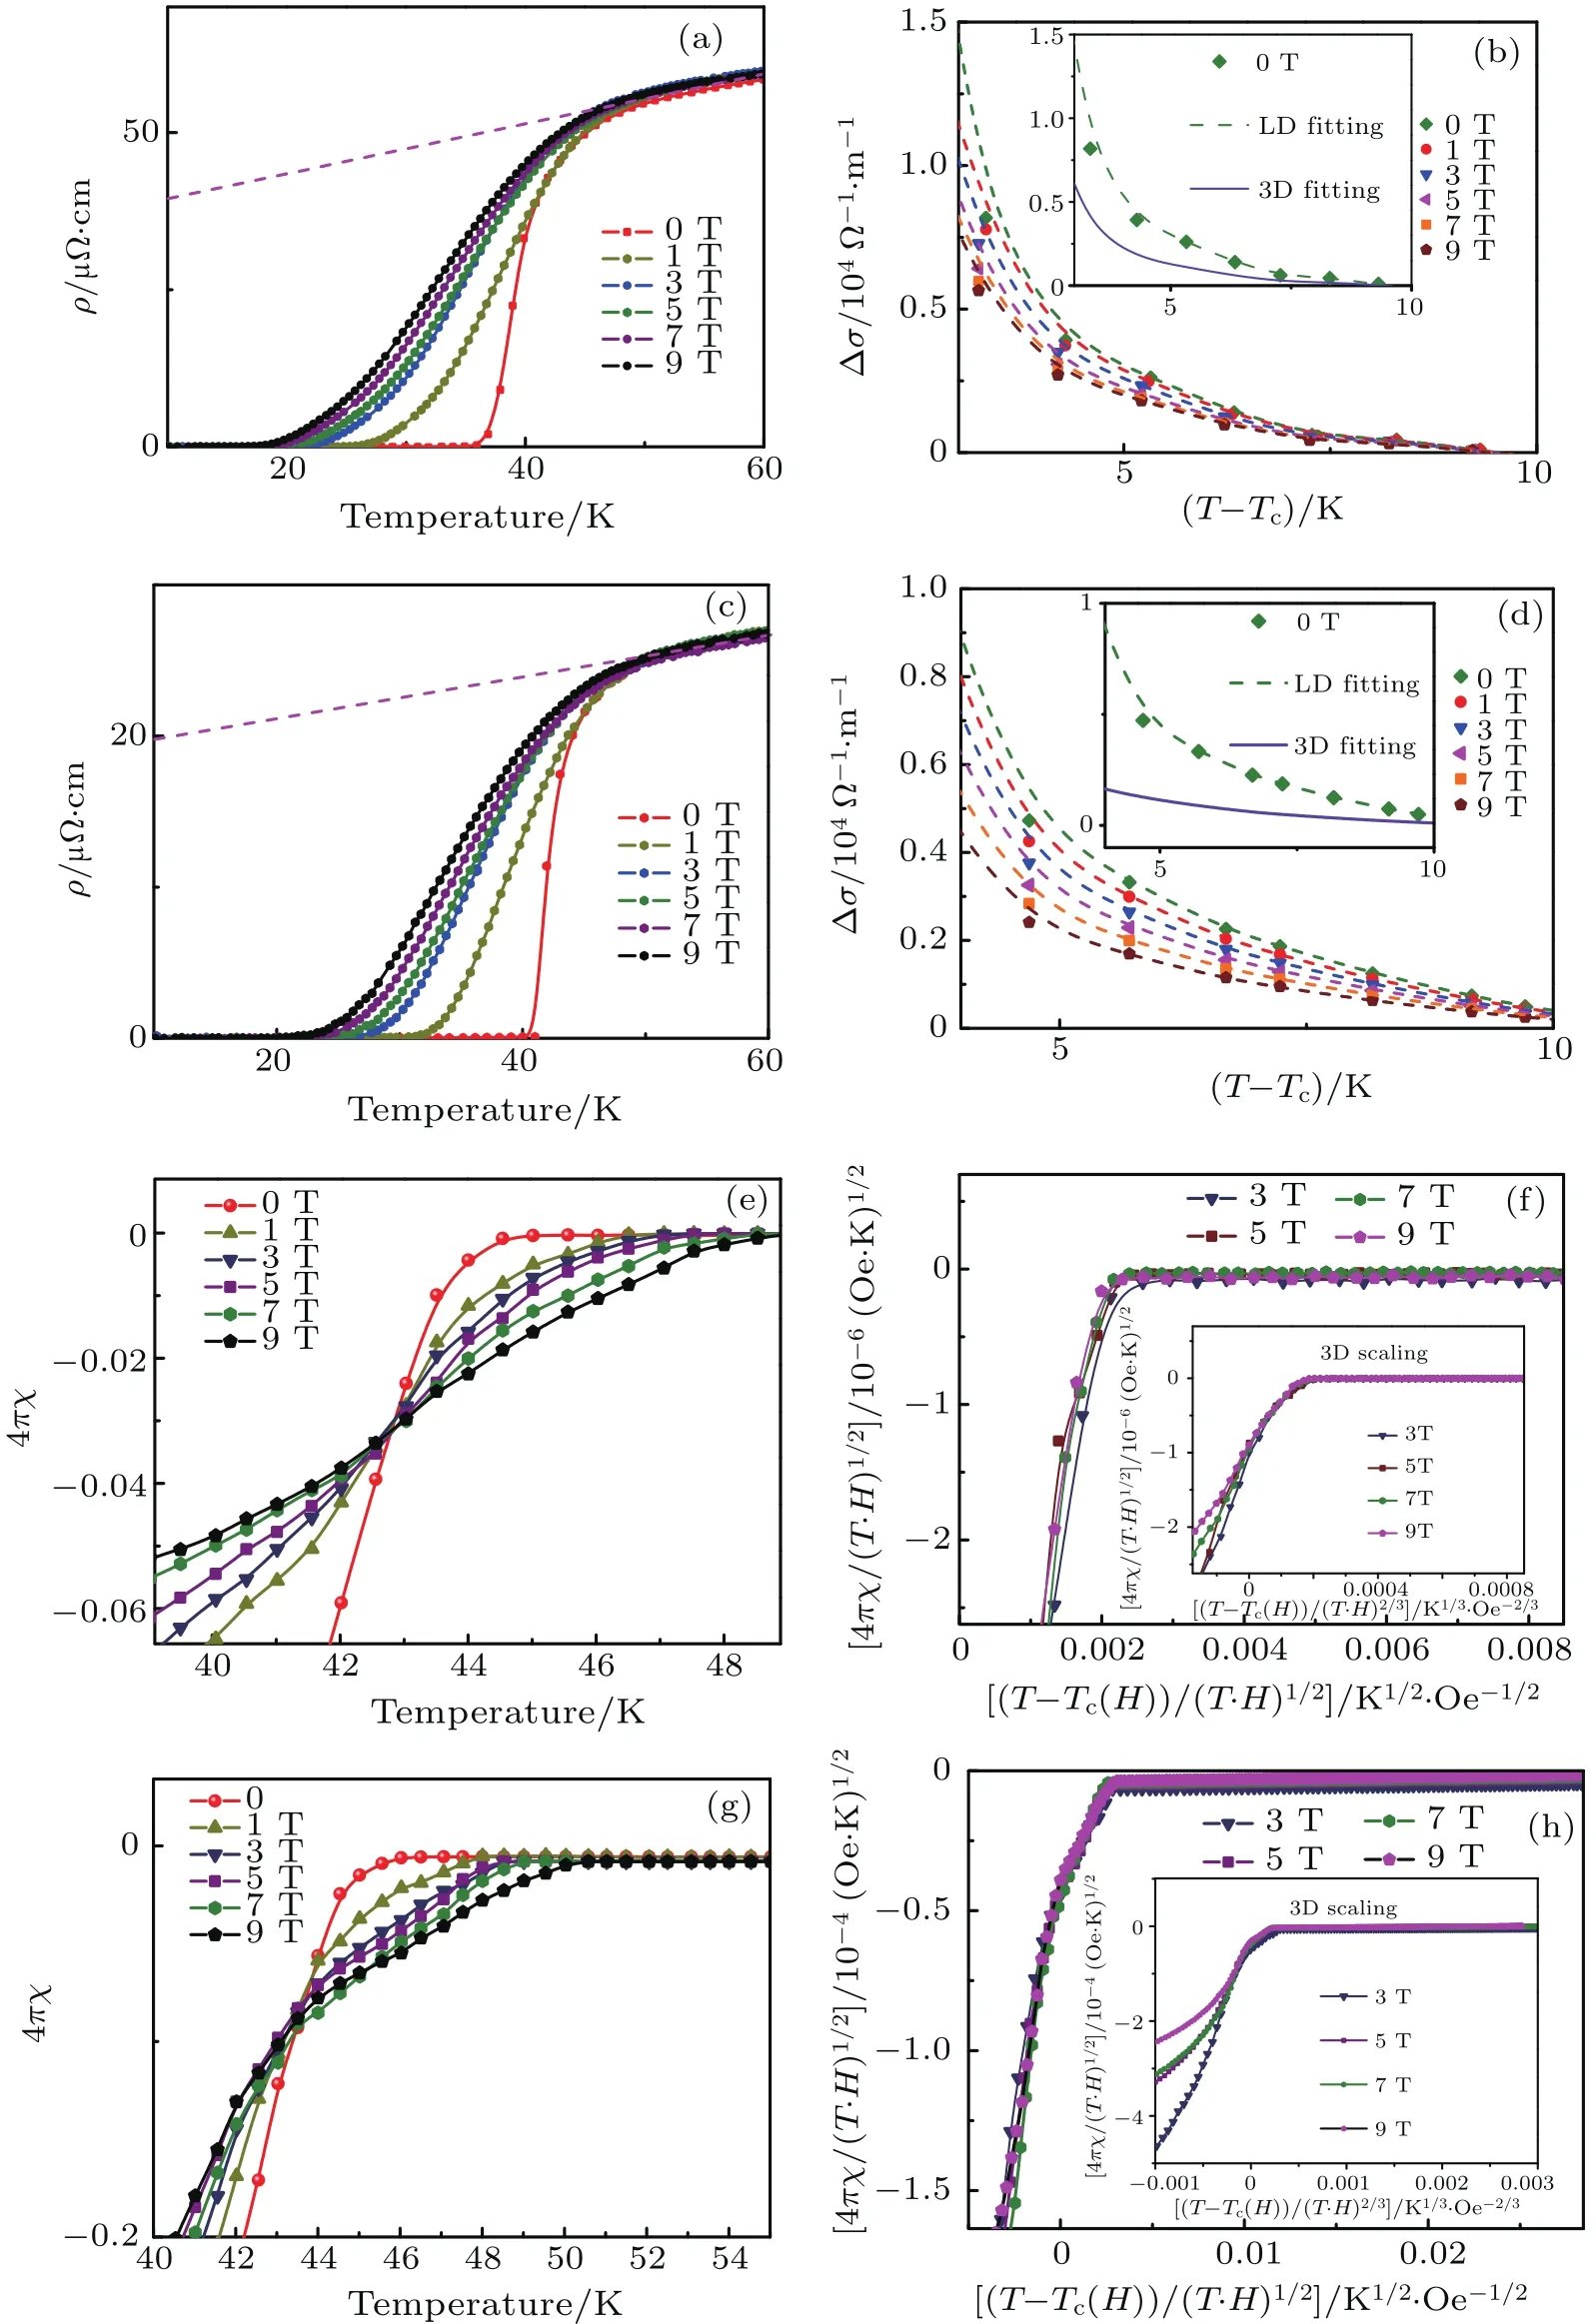
Fig.5.Quasi-2D superconductivity behavior of Lix(C3H10N2)0.32FeSe(x=0.15,0.25).(a)and(c)Temperature-dependent resistivity around Tcof Lix(C3H10N2)0.32FeSe(x=0.15,0.25)under increasing magnetic fields.The lines are for examples(forµ0H=9 T)of background contribution,as determined by a linear fit above 42 K,where fluctuation effects are expected to be negligible.(b)and(d)The fluctuation contribution to the conductivity Δσ varies with temperature under external magnetic fields up to 9 T for Lix(C3H10N2)0.32FeSe(x=0.15,0.25).The inset shows the fitting of Δσ versus temperature with the quasi-2D Lawrence-Doniach model(green dash line)and 3D anisotropic Ginsburg-Landau model(brown solid line).(e)and(g)Expanded view of temperature dependence of magnetization for Lix(C3H10N2)0.32FeSe(x=0.15,0.25)under external magnetic fields.The data are corrected for T-independent background.(f)and(h)2D scaling of high- field magnetization curves for Lix(C3H10N2)0.32FeSe(x=0.15,0.25),with inset showing 3D scaling behavior.
Figures 5(e)and 5(g)show the magnetization curves on an expanded scale close to the superconducting transition for Lix(C3H10N2)0.32FeSe(x=0.15,0.25)under external fields H=1 T to 9 T.The data are corrected for the T-independent diamagnetic normal-state magnetization.A peculiarity of both sets of data is the existence of a crossing point M(T,H)at which the magnetization is field independent.This unusual behavior is also attributed to the effect of superconducting fluctuations in quasi-two-dimensional superconductors,a similar effect has been observed in Bi2Sr2CaCu2O8.[33]Besides the crossing point,the scaling behavior in the diamagnetic response is also widely used to judge the dimensionality of materials.[34,35]For the temperature-dependent diamagnetization a scaling form is expected to be a function of the following form 4πχ/(T ·H)n=F[[T-Tc(H)]/(T·H)n]under the external magnetic field H,where F is a scaling function,n=2/3 for anisotropic 3D material,and n=1/2 for a 2D system.[34]Figures 5(f)and 5(h)show the magnetization data under fields from 0 T to 9 T that are scaled in the proper two-dimensional form and three-dimensional form(inset),respectively.For both of the compounds,the two-dimensional scaling has apparently higher quality than the three-dimensional scaling,the observations further con firm that the superconducting fluctuation is large due to the strong two dimensionality of Lix(C3H10N2)0.32FeSe(x=0.15,0.25).
3.5.Hall resistivity
In Fig.6,we show the transport properties of Lix(C3H0N2)yFe2Se2(x=0.15,0.25,0.4)samples at a normal state.In the whole temperature region,Hall resistivity ρxy(µ0H)of Li0.15(C3H10N2)0.32FeSe sample shows good linear relation against magnetic field up to 9 T.The derived Hall coefficient RH= ρxy/µ0H at 9 T exhibits strong temperature dependence(Fig.6(a)).The RHis negative below 200 K and the absolute values decrease rapidly with temperature increasing.Finally,the RHbecomes positive at higher temperature,i.e.,there is a sign change at∼185 K.It suggests that there exist two different types of charge carriers in Li0.15(C3H10N2)0.32FeSe,the dominant carriers are of electron-type at low temperatures and become hole-type carriers at high temperature.
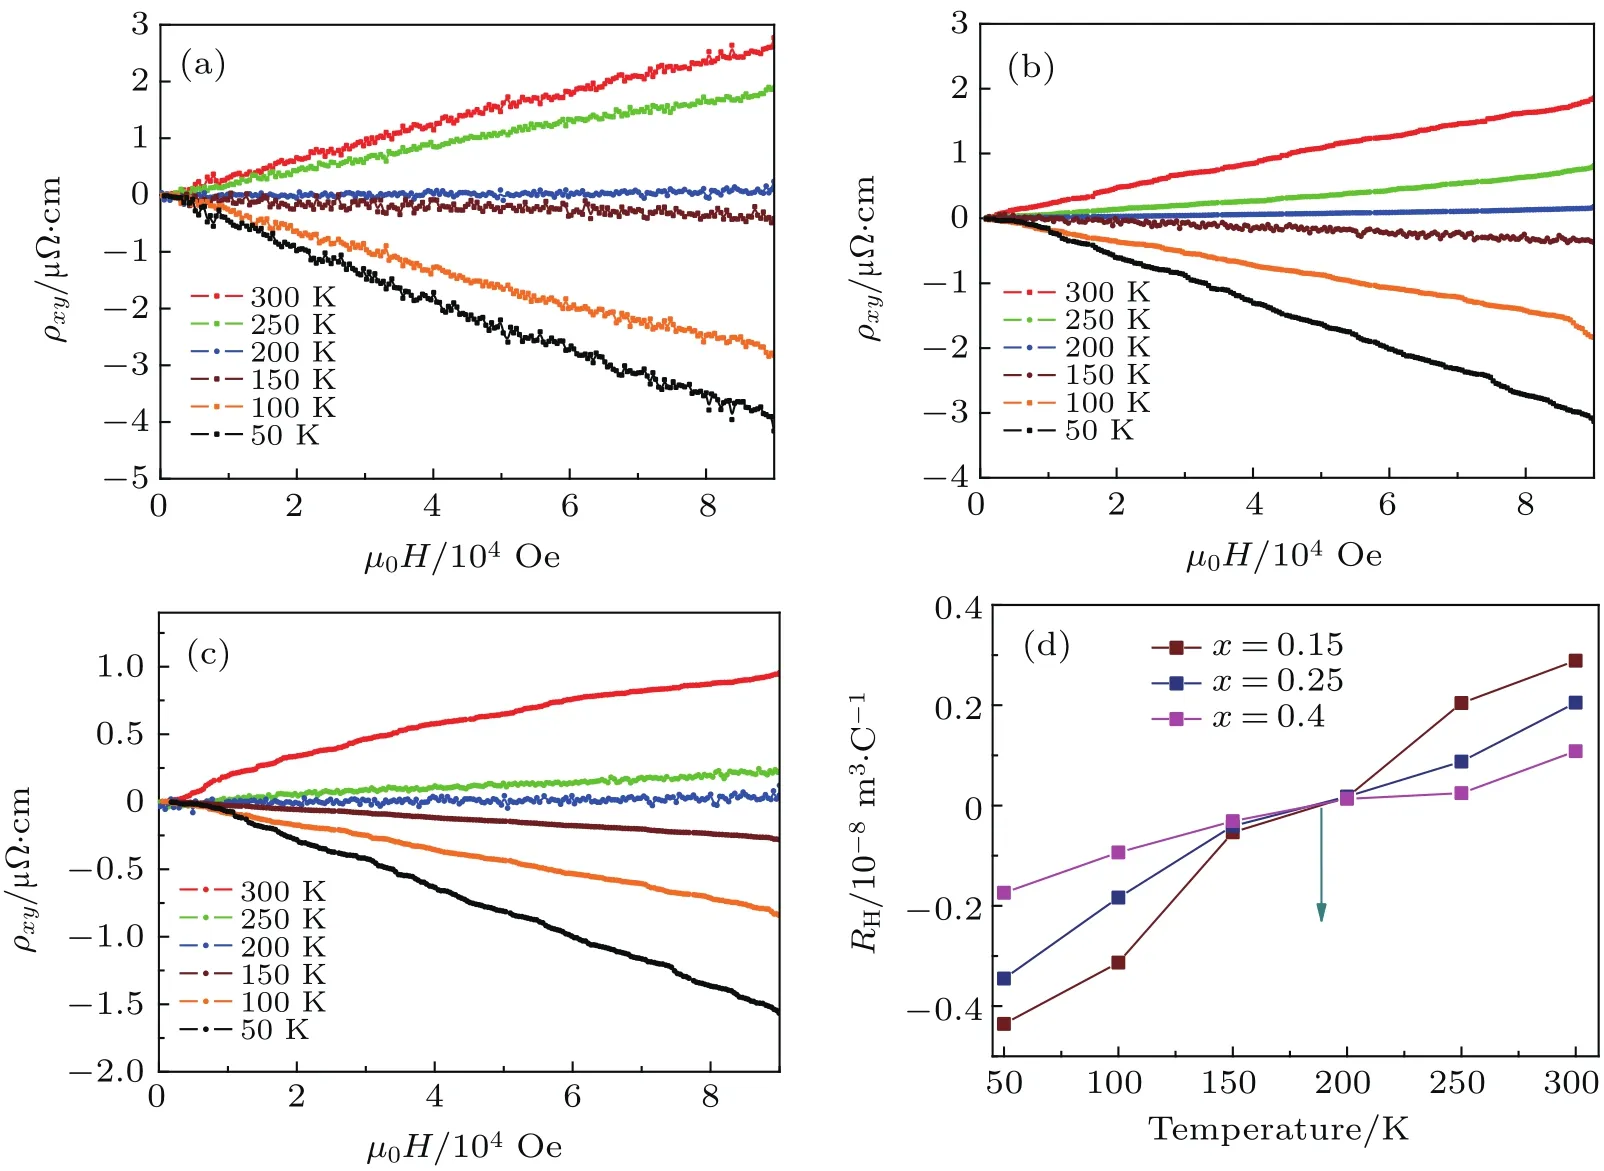
Fig.6.Hall effect transverse resistivity ρxymeasurement.(a)-(c)Field-dependent Hall effect transverse resistivity ρxyfor Lix(C3H0N2)yFe2Se2(x=0.15,0.25,0.4)samples.(d)Temperature-dependent Hall coefficient for three samples,RHchanges sign from negative to positive at a similar point about 185 K,demonstrating dominant hole carriers appear above 185 K.
Forelectron-dopedFeSematerials,includingKFe2Se2,[7]K-coated FeSe,[8]and(Li,Fe)OHFeSe,[10]the intensive ARPES and STM results both con firm that there exist only electron pockets in their electronic structures.[36]A reasonable scenario based on these results is that the low temperature Fermi surface topology in Lix(C3H10N2)yFeSe should also include only electron pocket,and no hole carriers should be present in the compounds.Therefore,the observed sign change of Hall resistivity RHat∼185 K should be a direct evidence that the ‘hole pocks’originally lacking in other‘electron-doped FeSe materials reoccur in the Fermi surfaces of Lix(C3H10N2)yFeSe at high temperatures.
Figures 6(b)and 6(c)show the plots of Hall resistivity ρxyversus µ0H respectively for two phase II samples with much higher dopant concentration x=0.25 and 0.4,.The increase of Li concentration significantly reduces the absolute value of ρxy(µ0H)of each sample above Tc.Strickingly,as shown in Fig.6(d)and Table 2,the RHvalues of both samples also increase rapidly with temperature rising,and their signs change at almost the same temperature(around 185 K).The values of Hall resistivity ρxy(µ0H)of samples x=0.12 and 0.25 show similar linear dependence on magnetic field from 50 K to 300 K.But the ρxy(µ0H)of sample x=0.4 is not linear at 300 K,which is a signature of the multiband behavior.Such multiband behaviors could be a consequence of the more complex electronic structure after the appearance of the hole pockets.
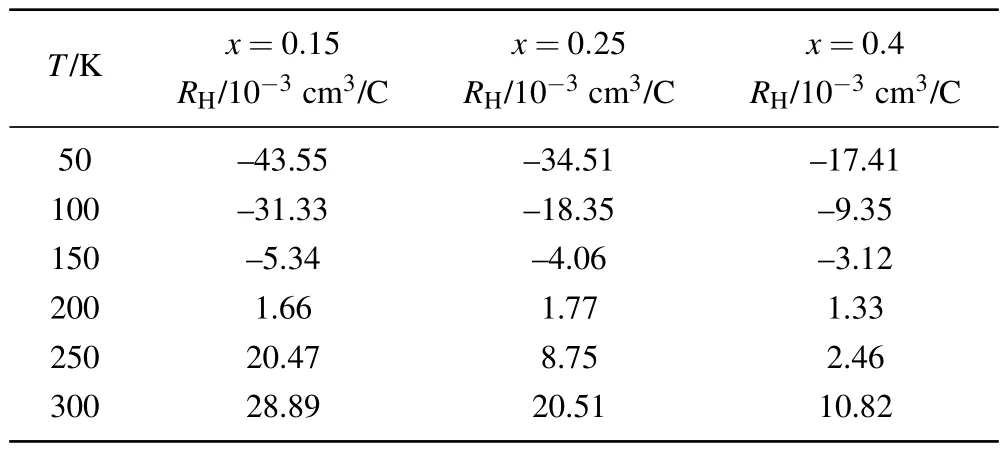
Table 2.Hall coefficients from 50 K to 300 K for x=0.15,0.25 and 0.4.
For electron-doped FeSe systems,the sign change of RHat high temperatures is very uncommon.The Hall coefficient of both KxFe2-ySe2[18]and(Li0.8Fe0.2)OHFeSe single crystals[19,20]are negative and exhibit the concave shape of RHin the measured temperature range.Meanwhile,the RHvalues of superconducting Lix(NH3)yFeSe crystals are also negative below room temperature but increase monotonically with temperature rising.[13]The negative RHin heavy electron-doped FeSe is consistent with their novel electronic structure consisting of only electron pockets.We note that a sign reversal of Hall resistance with temperature increasing is only observed in another low-dimensional FeSe system-few-layered FeSe film on an SiTO3substrate,and the RHvalues of 1-to-14-unitcell(UC)-thick FeSe films show a similar crossover from electron conduction to hole conduction at∼150 K.[22]The sign reversal of RHobserved in both FeSe films on SrTO3and the title compounds with largely expanded FeSe layers suggest the decrease of dimensionality in FeSe may play a role in the occurring of hole carriers at high temperatures.
3.6.Electronic structure
To clarify the influence of expanded FeSe layer distance on the electronic structure,the band structure of FeSe and(C3H10N2)0.32FeSe(charge neutral)are calculated by first principles calculations.The orbital resolved DFT band structures from M to Γ route are presented in Fig.7,and the more complete band structures are shown in Fig.A15.For bulk FeSe,there are four bands crossing the Fermi level,with two hole-like bands around the zone center(Γ point)and two electron-like bands around the zone corner(M point).Figures 7(c)and 7(e)show the Fermi surface for bulk FeSe,the volumes enclosed by the Fermi surface are found to be 0.230 holes/cell and 0.231 electrons/cell,respectively.The results corresponding to a carrier density of 2.93×10²¹holes/cm3and 2.96×10²¹electrons/cm3are in consistence with the almost compensated for electronic and hole carriers in bulk FeSe.The results are similar to the previous DFT calculations and ARPES measurements.[37,38]
By expanding the FeSe layer distance up to 10.62˚A,the band structure of(C3H10N2)0.32FeSe exhibits a nearly flat dispersion along the F-Z route with a quasi-2D character,suggesting that the dispersion along the c axis is weakened as the molecule is intercalated(Fig.A15).Meanwhile,the interaction has a profound influence on the electronic structure aroundΓ point.As shown in Fig.7(a),bulk FeSe has two hole pockets at Γ point,which are dominated by dxz/yzorbital.Notably,the molecule intercalation in(C3H10N2)0.32FeSe triggers a new dx2-y2hole pocket above the Fermi level around Γ point(Fig.7(b)).Apart from this,an empty-state band dominated by dxz/yzorbital sinks significantly as the FeSe layer is expanded.This sinked empty band was recently observed through STM in another low-dimensional FeSe system(1UC FeSe film on SrTiO3substrate).[39]Figures 7(d)and 7(f)show the Fermi surface for(C3H10N2)0.32FeSe,and the volume enclosed by the hole-like Fermi surface is found to increase significantly compared with the scenario for bulk FeSe,meanwhile,the electronic Fermi surface is almost unchanged.In particular,in the volume enclosed by Fermi surface the holes and electrons per cell are 0.791 and 0.525,namely the concentration of hole carriers and electron carriers are 5.12×10²¹holes/cm3and 3.41×10²¹electrons/cm3,respectively.The results suggest that the quasi-2D structure will reconstruct the Fermi surface around Γ point and significantly increase the hole carrier concentration.
The heavy electron doping in FeSe is known to significantly elevate the Fermi level and sunk all the hole pockets below the Fermi energy,leaving only electron pockets in the Fermi surface(Fig.7(g)).Meanwhile,it is also known that as the temperature rises,the chemical potential decreases and the Fermi level sinks continually.Our first principle calculations indicate that the increase in FeSe layer distance can lift up the‘hole band’around Γ point toward Fermi energy.Therefore,the enhanced hole pockets due to low dimensionally and the reduced chemical potential at high temperature are proposed to be responsible for the sign reversal of hall resistivity in Lix(C3H0N2)yFe2Se2(x=0.15,0.25,0.4).[13,40]Recently,the study of77Se,7Li,and1H nuclear magnetic resonance(NMR)of the ethylenediamine intercalated Lix(C2H8N2)yFe2-zSe2identi fies strong temperature dependence of77Se NMR shift and spin-lattice relaxation rate,1/77T1.[41]The phenomenon is attributed to the hole-like bands moving close to the Fermi energy at high temperatures.Our observed sign reversal of RHin Lix(C3H0N2)yFe2Se2proves more direct evidences that at least one of the hole pockets beneath the EFcrosses the EFat high temperate,and thus leads to a change in the Fermi surface topology.Furthermore,considering similar band structures in intercalated FeSe and monolayer FeSe, the same picture is also applicable to the explanation of the sign reversal of Hall resistance at around 150 K in few-layered FeSe films deposited on SiTO3.[42]Moreover,it is expected that the sign reversal of Hall resistance can be observed for other organic molecule intercalated FeSe materials with largely expanded layer distances.
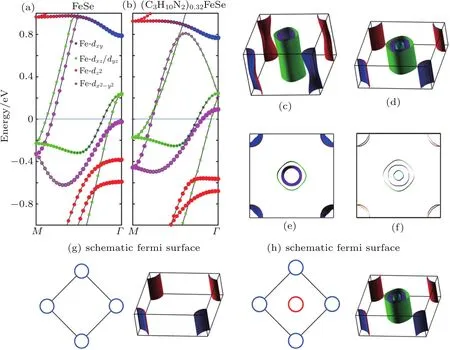
Fig.7.Electronic structure of bulk FeSe and(C3H10N2)0.32FeSe.(a)and(b)Band structure along M to Γ route of bulk FeSe and(C3H10N2)0.32FeSe.(c)and(f)Fermi surface of bulk FeSe,(C3H10N2)0.32FeSe(Γ point is in the center and M point is at the corner).(g)-(h)Schematic diagram for Fermi surface of Li0.15(C3H10N2)0.32FeSe at LT(low-temperature)and after sign change of Hall coefficient at HT(high-temperature).The Fermi energy is set to be zero.
4.Conclusions
In this work,two tetragonal superconducting phases are identified in Lix(C3H10N2)0.32FeSe (x=0.15∼0.4)system,i.e.,Li0.15(C3H10N2)0.32FeSe(phase I)and Lix(C3H10N2)0.32FeSe(phase II,0.25<x<0.4).The lithium concentration is revealed as a key parameter controlling both the crystal structure and the Tc.The determined structures demonstrate that between the FeSe layers,the orientation of 1,3-DIA molecules is coupled with Li concentration,and the FeSe layer distance is expanded up to∼10.9˚A.Superconductivity is observed at 40 K in phase I,and the highest Tcup to 46 K is realized in phase II at x=0.25.The Hall coefficient RHvalues of the two phases are negative at low temperature,indicating dominant electron-type carriers due to Li doping.Meanwhile,a sign reversal of RHat 185 K is observed in both phases and at three different doping levels,implying that the hole pockets appear in all these superconductors at high temperature.Fitting of resistivity in terms of the Lawrence-Doniach model and the measured field-dependent diamagnetic response suggests that the two superconductors belong to the quasi-2D system.Further DFT calculations reveal that the increase in FeSe layer distance will lift up a ‘hole band’associated with dx2-y2character around Γ point toward Fermi energy.
Appendix A:Supplemental material
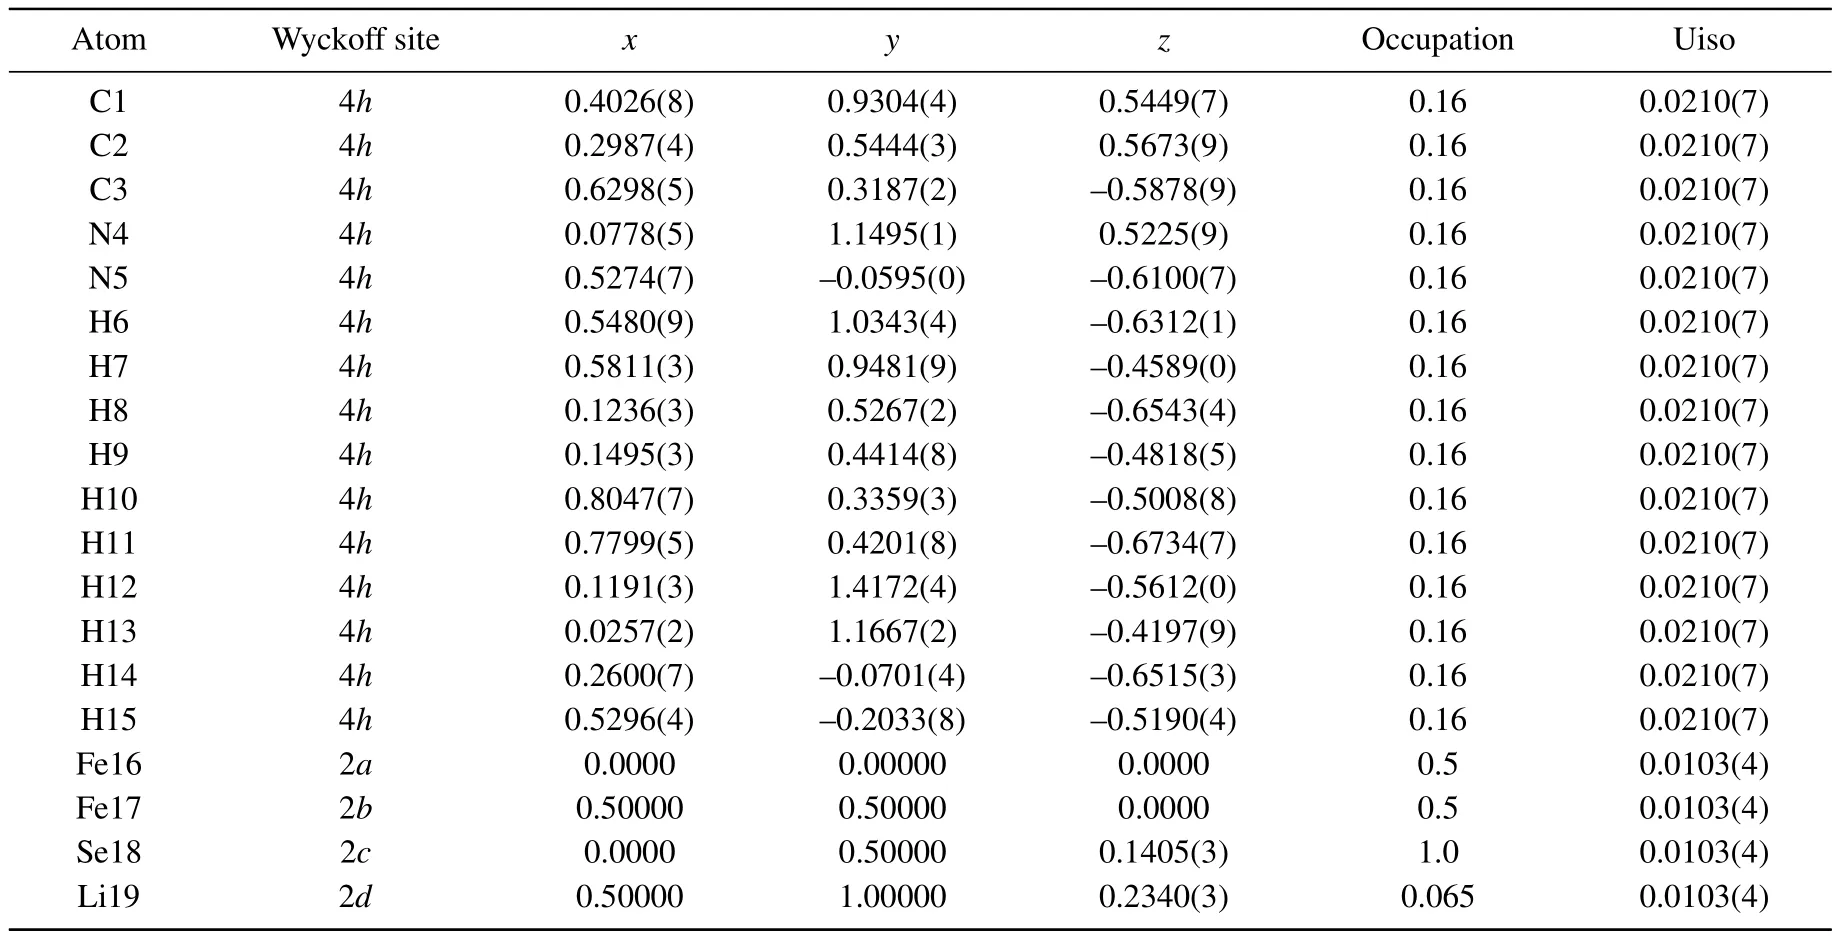
Table A1.Crystal structure parameters for phase I.
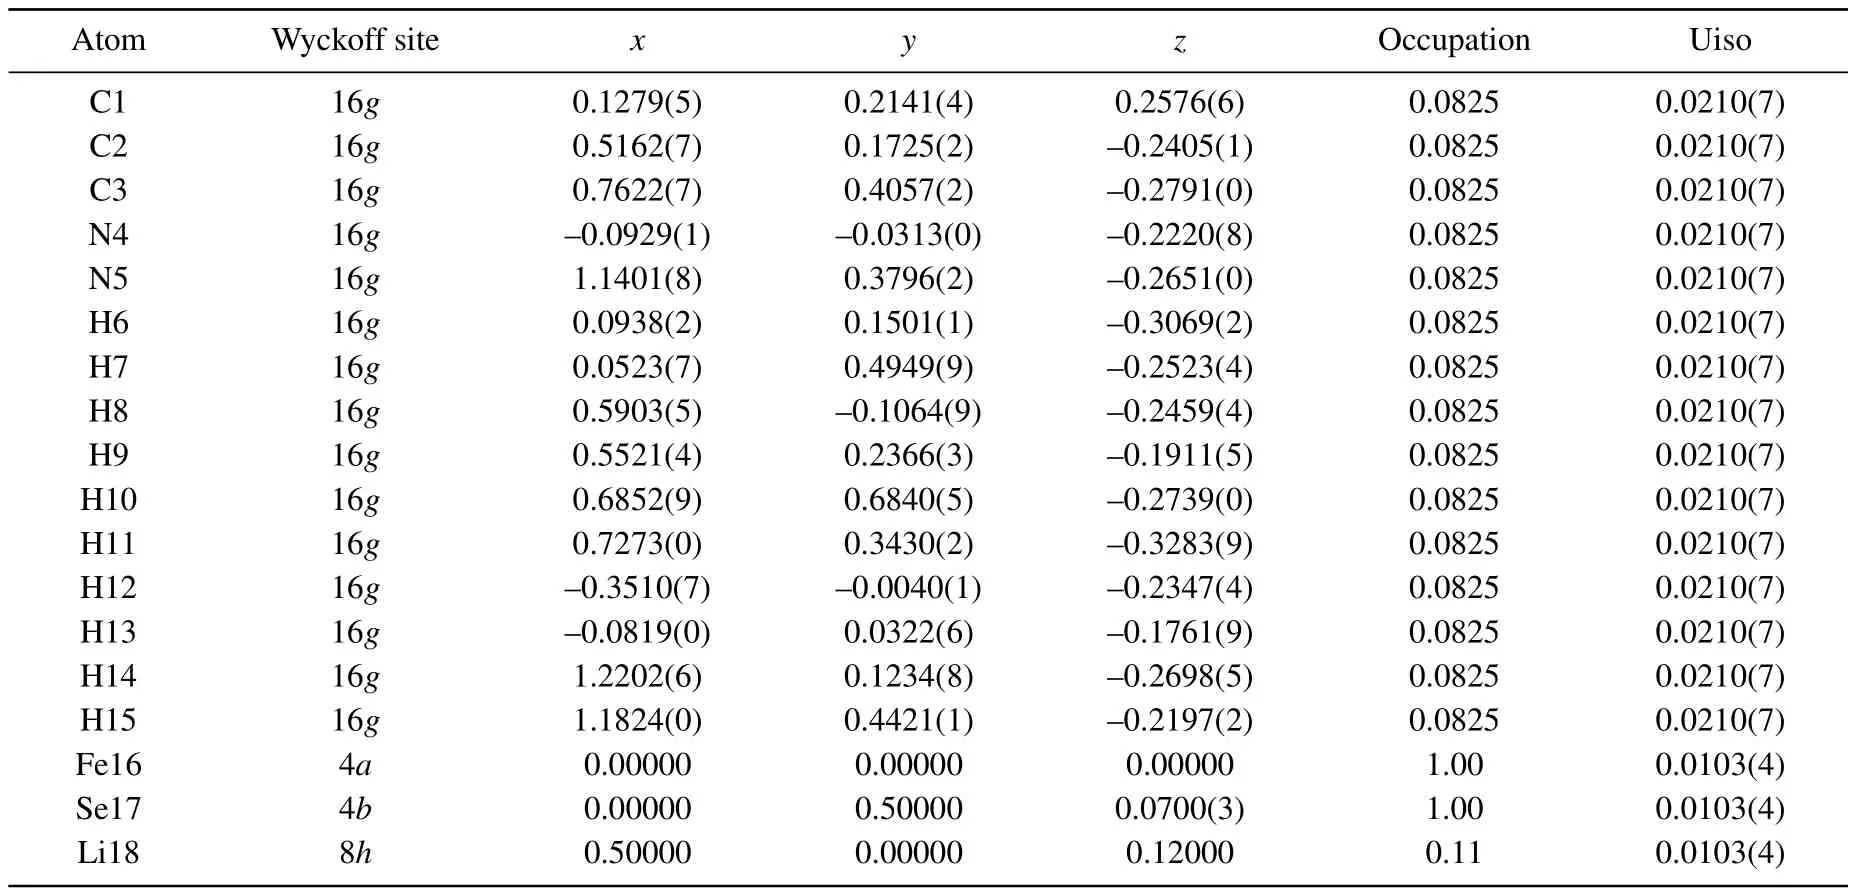
Table A2.Crystal structure parameters for phase II.
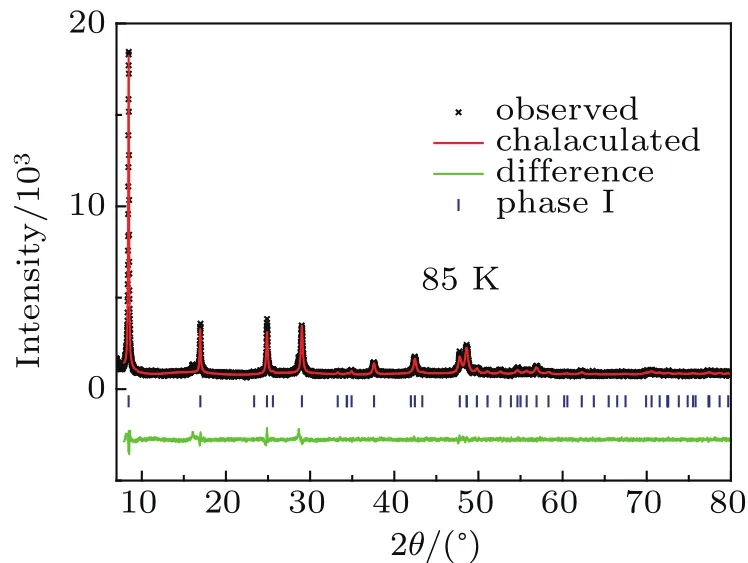
Fig.A1.Powder x-ray diffraction data for Li0.13(C3H10N2)0.32FeSe at 85 K.
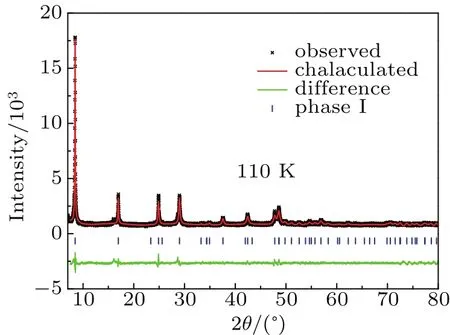
Fig.A2.Powder x-ray diffraction data for Li0.13(C3H10N2)0.32FeSe at 110 K.
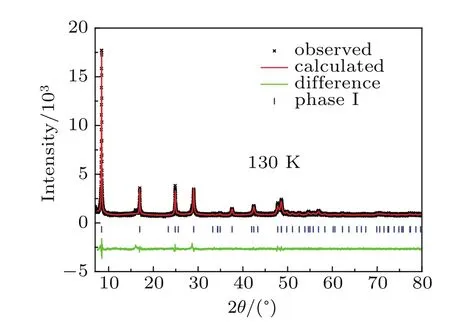
Fig.A3.Powder x-ray diffraction data for Li0.13(C3H10N2)0.32FeSe at 130 K.
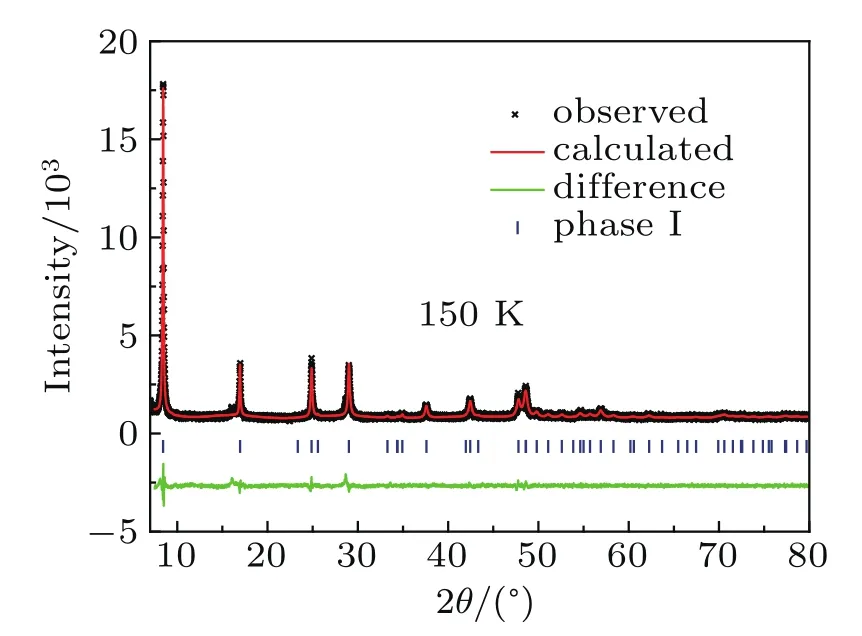
Fig.A4.Powder x-ray diffraction data for Li0.13(C3H10N2)0.32FeSe at 150 K.
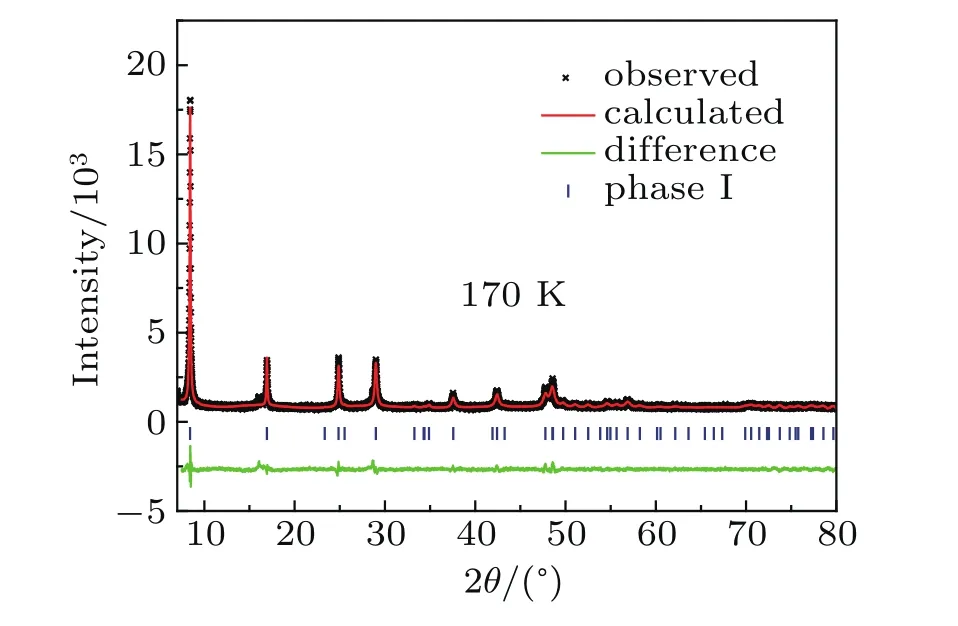
Fig.A5.Powder x-ray diffraction data for Li0.13(C3H10N2)0.32FeSe at 170 K.
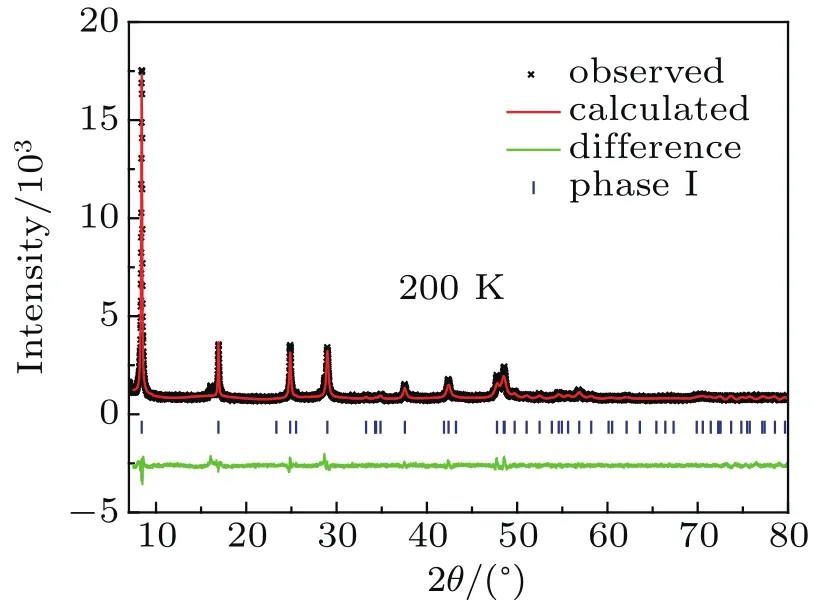
Fig.A6.Powder x-ray diffraction data for Li0.13(C3H10N2)0.32FeSe at 200 K.
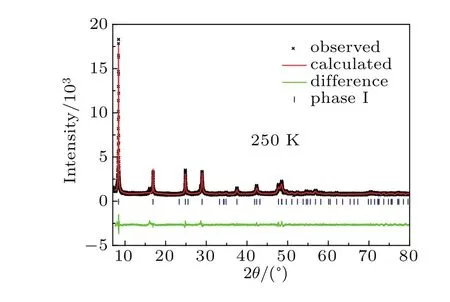
Fig.A7.Powder x-ray diffraction data for Li0.13(C3H10N2)0.32FeSe at 250 K.
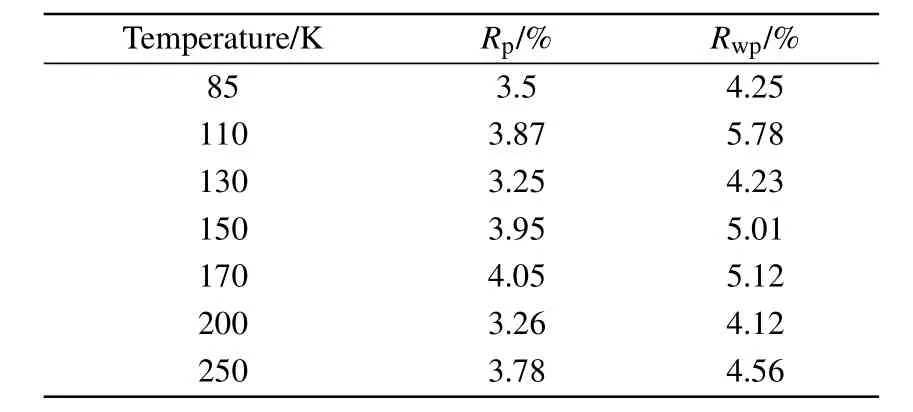
Table A3.Rpand Rwpfor low-temperature PXRD re finements.
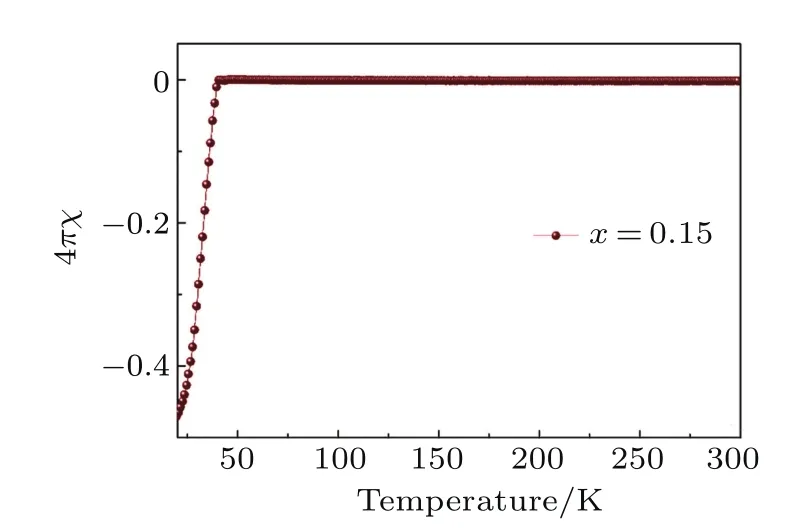
Fig.A8. Zero- field-cooled magnetic susceptibilities forLi0.15(C3H10N2)0.32FeSe.
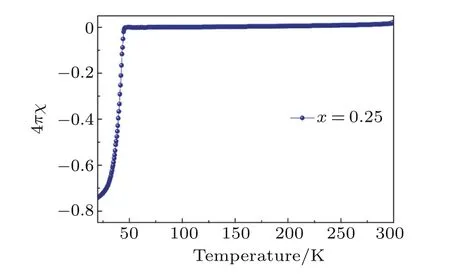
Fig.A9. Zero- field-cooled magnetic susceptibilities for Li0.25(C3H10N2)0.33FeSe.
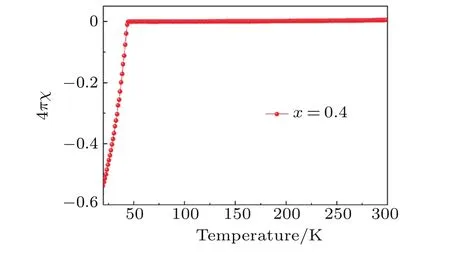
Fig.A10. Zero- field-cooled magnetic susceptibilities for Li0.4(C3H10N2)0.32FeSe.
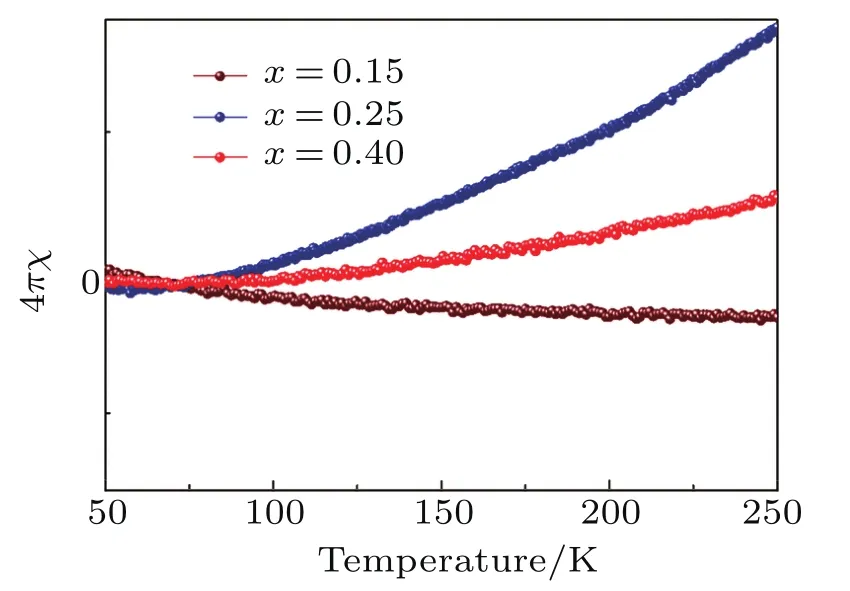
Fig.A11.Enlarged view of zero- field-cooled magnetic susceptibilities for Lix(C3H0N2)yFeSe(x=0.15,0.25,0.4)from 50 K∼250 K.
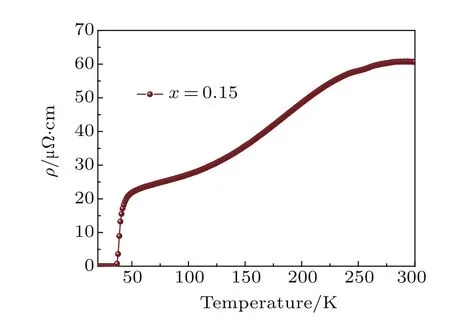
Fig.A12.Electrical resistivity of Li0.15(C3H10N2)0.32FeSe.
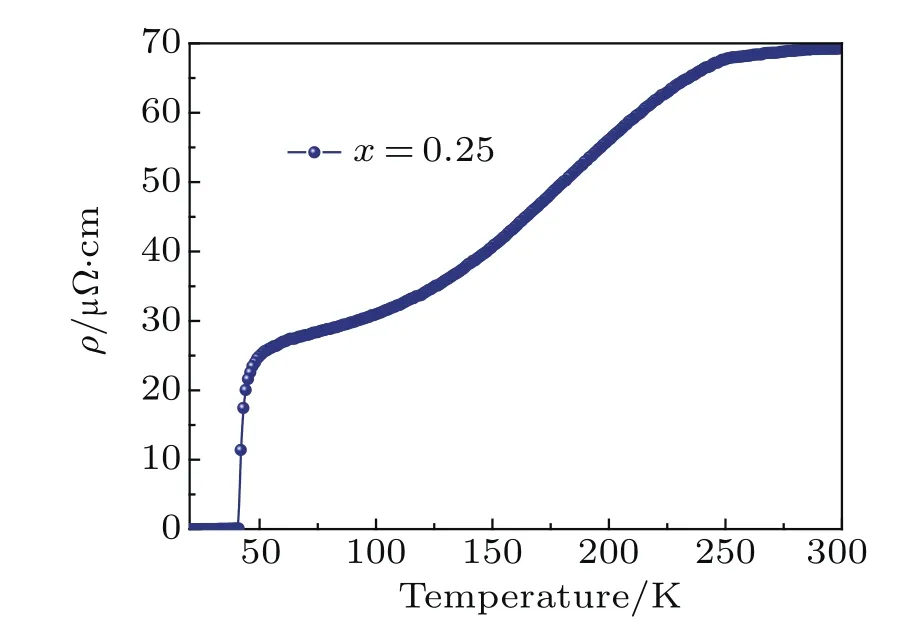
Fig.A13.Electrical resistivity of Li0.25(C3H10N2)0.33FeSe.
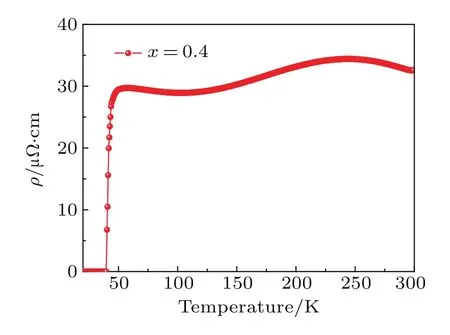
Fig.A14.Electrical resistivity of Li0.4(C3H10N2)0.32FeSe.
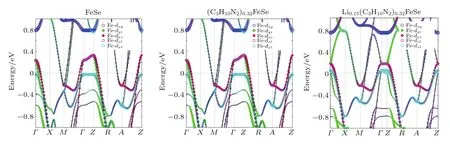
Fig.A15.Orbital resolved electronic structures of FeSe,(C3H10N2)0.32FeSe,and Li0.15(C3H10N2)0.32FeSe.
杂志排行

Chinese Physics B的其它文章
- Topological superconductivity in a Bi2Te3/NbSe2heterostructure:A review∗
- The universal characteristic water content of aqueous solutions∗
- Neutral excitation and bulk gap of fractional quantum Hall liquids in disk geometry∗
- Direct deposition of graphene nanowalls on ceramic powders for the fabrication of a ceramic matrix composite∗
- Hard carbons derived from pine nut shells as anode materials for Na-ion batteries∗
- Improved electrochemical performance of Li(Ni0.6Co0.2Mn0.2)O2 at high charging cut-off voltage with Li1.4Al0.4Ti1.6(PO4)3 surface coating∗