Rules of Changes in Soil Nutrients and Enzyme Activities of Larix principis-rupprechtii in Different Forest Ages
2019-05-24
Institute of Land Engineering and Technology, Shaanxi Provincial Land Engineering Construction Group Co., Ltd., Xi’an 710075, China; Shaanxi Provincial Land Engineering Construction Group Co., Ltd., Xi’an 710075, China; Key Laboratory of Degraded and Unused Land Consolidation Engineering, the Ministry of Land and Resources, Xi’an 710075, China; Shaanxi Provincial Land Consolidation Engineering Technology Research Center, Xi’an 710075, China
Abstract In this study, three different ages of Larix principis-rupprechtii forests in 5, 10 and 20 years were selected as the research objects, and the changes in soil nutrient and soil enzyme activities in different growth stages were analyzed. The results showed that the contents of organic matter and available phosphorus in the soil of different growth stages showed a significant downward trend with the increase of soil depth. For different forest ages in the same soil layer, the soil available phosphorus content declined with the increase of the forest age. The organic matter content of 40-60 cm in 20 years of forest age was the lowest in July, which was 4.17 g/kg, significantly lower than that in other soil layers. Besides, the soil available phosphorus content of 5 years of forest age reached the maximum in July, with an average of 4.44 mg/kg, which was higher than the available phosphorus content in soil in May and September, but the difference between the three months was not significant. The changes in ammonium nitrogen and nitrate nitrogen content in soil with different forest ages were consistent with the changes in the soil depth, showing a downward trend. In the new leaf stage, the ammonium nitrogen content of the L. principis-rupprechtii forest land in 5 years of age at 20-40 and 40-60 cm of the soil depth was 13.47 and 9.09 mg/kg, respectively, which was 46.9% and 64.2% lower than that at 0-20 cm (25.36 mg/kg) of the soil depth. The soil nitrate nitrogen content of 20 years of forest age was 19.24 mg/kg, which was 25.8% lower than that of 10 years of forest age, showing significant difference (P<0.05). In addition, with the increase of the age of L. principis-rupprechtii, soil catalase (CAT), alkaline phosphatase (ALP) and urease (Ure) decreased, and the decline of ALP was slow, while CAT and Ure decreased significantly. In summary, it is concluded that the soil fertility of forest land declined with the increase of forest age on the basis of change trend of soil nutrient and soil enzyme activity in the surveyed forest age.
Key words Larix principis-rupprechtii, Forest age, Soil nutrient content, Enzyme activity
1 Introduction
With the rapid development of China’s economy, the demand for wood is increasing sharply. At present, the existing natural forest resources have been unable to support such high demand, and the production cycle of plantations is relatively short, and cultivation can be achieved according to demand, and the efficiency is high, so the artificial afforestation industry has risen rapidly, it plays an important role in solving the problems of the shortage of timber and environmental protection in the world[1].LarixgmeliniiRupr. is a deciduous arbor of the genusLarix, and it is widely distributed in high altitude areas of China. The survival rate of special varietyLarixprincipis-rupprechtiiin the high mountains of North China is relatively high.L.principis-rupprechtiiis strong positive tree species with the height up to 30 m. This variety can grow rapidly, the timber quality is excellent, and it has a good effect on the maintenance of water and soil, thus it is one of the main choices for afforestation[2-3]. In 1958, Shaanxi Province started the introduction ofL.principis-rupprechtii. In 1986, the afforestation area reached 3.2×10³ha only in Qinling Mountains. In the early stage ofL.principis-rupprechtiiintroduction, the trees grew well, but the growth trend of large-scale artificial afforestation becomes slow in recent years. In this situation, how to manage and maintain a large area ofL.principis-rupprechtiiplantation becomes very important[4-5]. Due to some limitations in the early state of planting, such as dense planting, single species, and no hierarchical structure, the management of plantations is relatively extensive, productivity has been declining from generation to generation, leading to serious problems such as soil fertility decline[6]. Therefore, focusing on how to solve the problem of decline of soil fertility in plantation forest is favorable for the sustainable development of plantations in China[7].
The soil nutrients complement the growth of the plants. The soil nutrients can effectively protect the growth and development of the plantation forests, while the artificial forests will affect the physical and chemical properties of the soil through the decay of the fallen leaves, root exudates and symbiotic microorganisms[8-9]. Soil enzymes can promote soil metabolic processes by changing physical and chemical properties of the soil[10-11]. In this experiment, we intend to study the decline of soil fertility inL.principis-rupprechtiiforests from the basic soil nutrients and related enzyme activities. We surveyed and analyzed the increase and decrease in the basic soil nutrient and soil related enzyme activities in different forest ages ofL.principis-rupprechtiiforests, to explore the specific forms and stages of the forestland degradation. In this survey, we selected three gradients of forest age, namely 5, 10 and 20 years, analyzed the soil nutrient and soil enzyme activities of forest land, in the hope of revealing the trend of soil fertility and related enzyme activities in different forest ages, to provide important guiding significance for studying the decline ofL.principis-rupprechtiiforest land.
2 Materials and methods
2.1 General situation of the study areaIn this survey, we mainly selected Nantan Nursery of Taibai Forestry Bureau Forest Farm in Taibai County, Shaanxi Province. The forest farm is located at the foot of Qinling Mountain, about 4 km southeast of Taibai County. Its climate belongs to the Qinling Gorge microclimate zone, with an average altitude of about 1 660 m. The annual average rainfall is 580-1 020 mm, frost-free period is 155 d, annual average temperature is 7.7℃, and the annual temperature range is -25.3℃-32.9℃. The soil pH of the forest farm is 6.52-6.71, and other basic nutrient conditions are listed in Table 1[12].
Table 1 Basic soil fertility characteristics of the surveyed forest farm

Soil depth∥cmSoil water∥%Nitrate nitrogen∥mg/kgAmmonium nitrogen∥mg/kgAvailable phosphorus∥mg/kgOrganic matter∥g/kg0-2013.9630.822.486.4522.8520-4014.5419.312.014.9819.3240-6015.6515.48.244.0116.22
2.2 Experiment designIn this experiment, we selected theL.principis-rupprechtiiforest land in different ages as the experimental objects, the forest ages are 5, 10 and 20 years, marked as LD-1, LD-2 and LD-3, respectively. All three experimental areas are located in the northeast direction in the middle of the slope with a slope of about 15-25 degrees. In LD-1 forest land, the average tree height is 4.8 m, the diameter at breast height (DBH) is 14.5 cm; in LD-2 forest land, the average tree height is 8.6 m, the diameter at breast height (DBH) is 22.3 cm; in LD-2 forest land, the average tree height is 10.2 m, the diameter at breast height (DBH) is 10.2 cm. The area of the forest plots of different ages is 20 m × 20 m. The sampling time was: May 12, 2014 (new leaf stage), July 15, 2014 (vigorous growth stage) and September 15, 2014 (early defoliation stage). The sampling was carried out by W type five-point sampling method. In each area, we randomly selected three sampling points, and collected the soil at 0-20, 20-40 and 40-60 cm depth respectively at a distance of 45 cm from the forest. We stored the collected soil samples in two parts: one fresh soil for the determination of ammonia nitrogen and nitrate nitrogen was stored at 4℃, and the other soil for determining soil nutrient and soil enzyme activity was naturally dried, ground, screened with 1 mm and 0.149 mm sieves, respectively, and kept for use.
2.3 Measurement items and methodsSoil organic matter was measured by potassium dichromate volumetric method-external heating method, soil nitrate nitrogen and ammonium nitrogen were determined by AA3 continuous flow analyzer, soil available phosphorus was extracted by 0.5 mol/L NaHCO3and measured by molybdenum antimony colorimetric method[13].
Soil urease activity: using indophenol colorimetry, urease activity was expressed in milligrams of NH3-N in 1 g soil after 24 h(mg/g); soil phosphatase activity: disodium phenyl phosphate colorimetric method, its activity was expressed using the amount of P2O5mg in the 1 g soil after 2 h (mg/g); the soil catalase activity: potassium permanganate method, and its activity was expressed in milliliters of 0.02 mol/L KMnO4consumed by 1 g of soil (mL/g)[14].
3 Results and analyses
3.1 Changes in soil nutrients ofL.principis-rupprechtiiin different forest ages
3.1.1Changes in soil organic matter content ofL.principis-rupprechtiiland. From Table 1, it can be seen that the changes in soil organic matter content in forest at different stages are consistent, that is, decline with the increase of the soil depth. In the new leaf stage of tree growth, the soil organic matter content of the 20 years old forest land was 24.90, 7.58 and 4.51 g/kg from the surface soil to the bottom, and the latter two layers decreased by 229% and 452% compared with 0-20 cm, and both were significantly lower than 0-20 cm (P<0.05), but the difference between the two was not significant. The organic matter content in surface soil increased with the increase of forest ages. The content of organic matter in other soil layers declined with the increase of forest ages. During the vigorous growth stage, LD-3 had the lowest organic matter content at 40-60 cm soil depth, 4.17 g/kg, which is significantly lower than that in other soil layers. The soil organic matter content in the forest land from LD-1 to LD-3 declined significantly, which is a form of decline of the forest soil quality. Besides, the organic matter of LD-3 surface soil is higher than that of LD-1 and LD-2, possibly influenced by the humus produced by litter decay on the soil surface.
Table 2 Changes in soil organic matter content ofLarixprincipis-rupprechtiiland in different forest ages

MonthDepth∥cmOrganic matter∥g/kgLD-1LD-2LD-3May0-2019.72 bA20.96 bA24.90 bA20-4013.05 cB11.57 cB7.58 dB40-607.62 bC9.02 bC4.51 cBJuly0-2018.22 cA18.21 cA23.41 bA20-4013.12 bB13.10 bB5.41 cB40-609.26 bC9.26 bC4.17 cBSeptember0-2023.31 bA18.83 cA19.50 cA20-4015.29 bB12.84 cB9.02 dB40-6012.83 aB12.03 b8.55 cB
Note: Different lowercase letters in the same row indicate significant difference at 5% level (P<0.05) between forest ages. Different uppercase letters in the same column indicate significant difference at 5% level (P<0.05) between different soil depth or the difference between different months (P<0.05). It is the same as below.
3.1.2Changes in ammonium and nitrate nitrogen contents of forest soil in different forest ages. From Table 2, it can be known that the ammonium nitrogen content in the soil gradually declined with the increase of the growing month. At the same growth stage, the ammonium nitrogen content in the soil declined with the deepening of the soil layer, and declined with the increase of forest ages. At the new leaf stage of forest growth, the average ammonium nitrogen content of the forest LD-3 was 6.39 mg/kg, which was significantly lower than that of LD-1 (15.86 mg/kg) and LD-2 (11.22 mg/kg). At the vigorous metabolism stage, the average ammonium nitrogen content of the LD-1, LD-2 and LD-3 in the forest farm was 9.07, 6.32 and 2.31 mg/kg, and the difference between them was significant (P<0.05). At the new leaf stage of forest growth, the ammonium nitrogen content of LD-1 at 20-40 and 40-60 cm soil depth was 13.36 and 8.98 mg/kg, respectively, declined by 88.9% and 181% compared with that at 0-20 cm soil depth (25.24 mg/kg); during the growth stage and defoliation stage, the ammonium nitrogen content in the forest LD-3 declined from soil surface layer to deeper layers, specifically 6.97, 5.43 and 4.37 mg/kg respectively, and the difference in ammonia nitrogen content between the topsoil and the other two layers was significant. From Table 2, it can be seen that the nitrate nitrogen content in the soil ofL.principis-rupprechtiiforest land declined with the increase of soil depth at the new leaf stage and the defoliation stage, but at the vigorous growth stage, the changes in nitrate nitrogen content in the soil were not consistent, that is, first increase then decline. At the vigorous growth stage, the difference in nitrate nitrogen content in the LD-1 and LD-2 forest soil was not significant between different soil layers. However, at the new leaf stage of forest growth, the nitrate nitrogen content in the soil declined first and then increased with the increase of the forest age. The nitrate nitrogen content of LD-3 forest soil was 19.24 mg/kg, which was 34.8% lower than that of LD-2 (25.93 mg/kg), and the difference between the two was significant (P<0.05); in July and September, the nitrate nitrogen content in the soil increased slowly with the increase of the forest age, it was 22.96 mg/L in LD-1 in September and 22.58 mg/kg in LD-2, both were significantly lower than 32.94 mg/kg in LD-3.
Table 3 Changes in nitrate nitrogen and ammonium nitrogen contents of forest soil in different forest farms
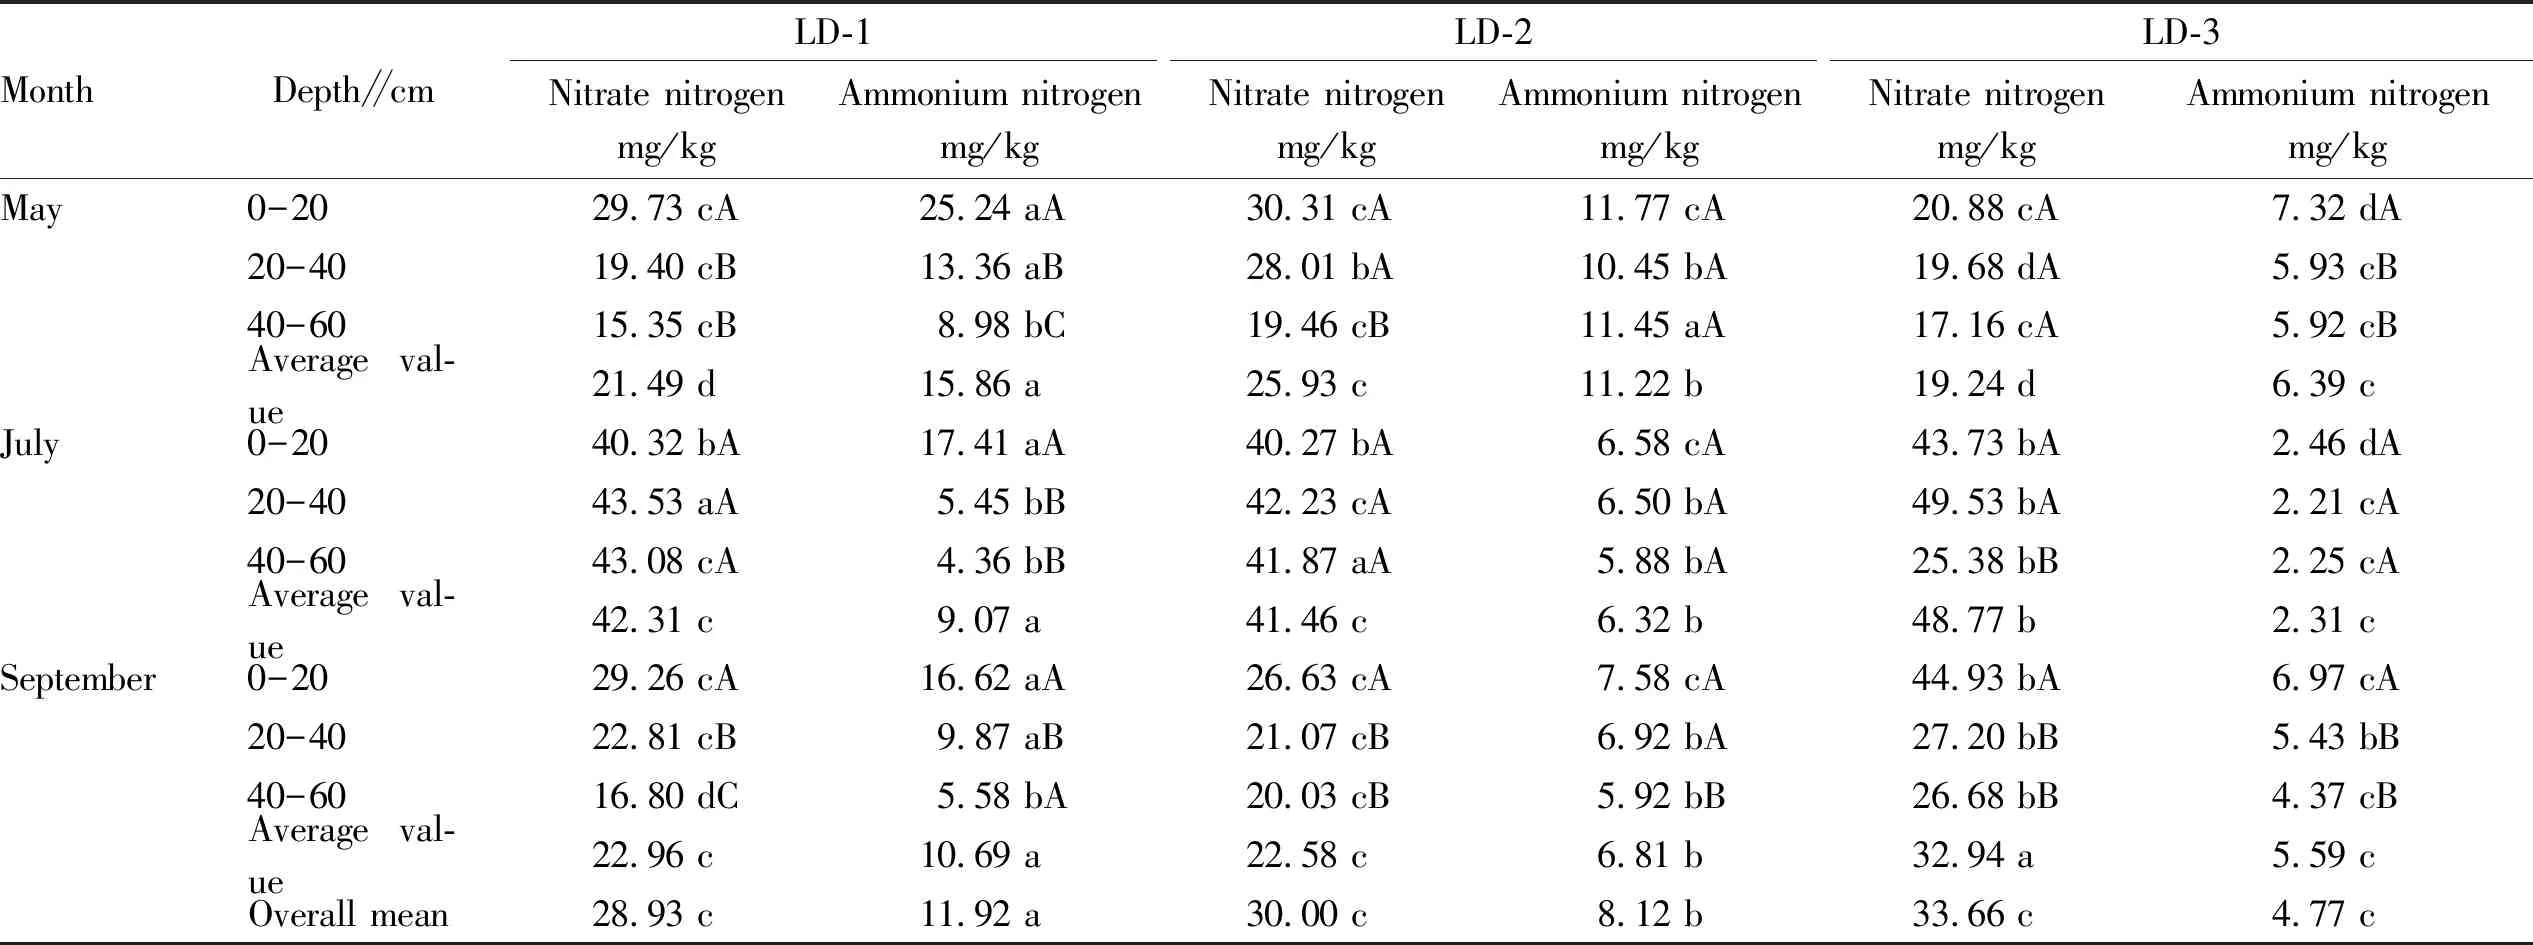
MonthDepth∥cmLD-1Nitrate nitrogenmg/kgAmmonium nitrogenmg/kgLD-2Nitrate nitrogenmg/kgAmmonium nitrogenmg/kgLD-3Nitrate nitrogenmg/kgAmmonium nitrogenmg/kgMay0-2029.73 cA25.24 aA30.31 cA11.77 cA20.88 cA7.32 dA20-4019.40 cB13.36 aB28.01 bA10.45 bA19.68 dA5.93 cB40-6015.35 cB8.98 bC19.46 cB11.45 aA17.16 cA5.92 cBAverage val-ue21.49 d15.86 a25.93 c11.22 b19.24 d6.39 cJuly0-2040.32 bA17.41 aA40.27 bA6.58 cA43.73 bA2.46 dA20-4043.53 aA5.45 bB42.23 cA6.50 bA49.53 bA2.21 cA40-6043.08 cA4.36 bB41.87 aA5.88 bA25.38 bB2.25 cAAverage val-ue42.31 c9.07 a41.46 c6.32 b48.77 b2.31 cSeptember0-2029.26 cA16.62 aA26.63 cA7.58 cA44.93 bA6.97 cA20-4022.81 cB9.87 aB21.07 cB6.92 bA27.20 bB5.43 bB40-6016.80 dC5.58 bA20.03 cB5.92 bB26.68 bB4.37 cBAverage val-ue22.96 c10.69 a22.58 c6.81 b32.94 a5.59 cOverall mean28.93 c11.92 a30.00 c8.12 b33.66 c4.77 c
3.1.3Characteristics of changes in available phosphorus content ofL.principis-rupprechtiiland in different forest ages. From Table 3, it can be seen that the available phosphorus content in the soil of different ages ofL.principis-rupprechtiiat different growth stages declined with the increase of soil layer, and the difference in available phosphorus content between different soil layers was significant (P<0.05). For different growth ages in the same soil layer, the soil available phosphorus content declined with the increase of the forest age. Specifically, the available phosphorus content in the soil surface of LD-1 forest age was the highest; in May, July and September, it was 5.53, 5.89 and 5.50 mg/kg, respectively, which were higher than that in other soil layers, but the difference was not significant. In addition, from Table 4, it can be seen that the soil available phosphorus content of LD-1 forest age reached the maximum in July, with an average of 4.44 mg/kg, which was higher than the available phosphorus content in soil in May and September, but the difference between the three was not significant; it was significantly higher than the average available phos-phorus content of LD-2 forest age (3.26 mg/kg), followed by 2.65 mg/kg of LD-3 forest age, and the difference between the three was significant (P<0.05).
Table 4 Changes in available phosphorus content ofLarixprincipis-rupprechtiiland in different forest ages
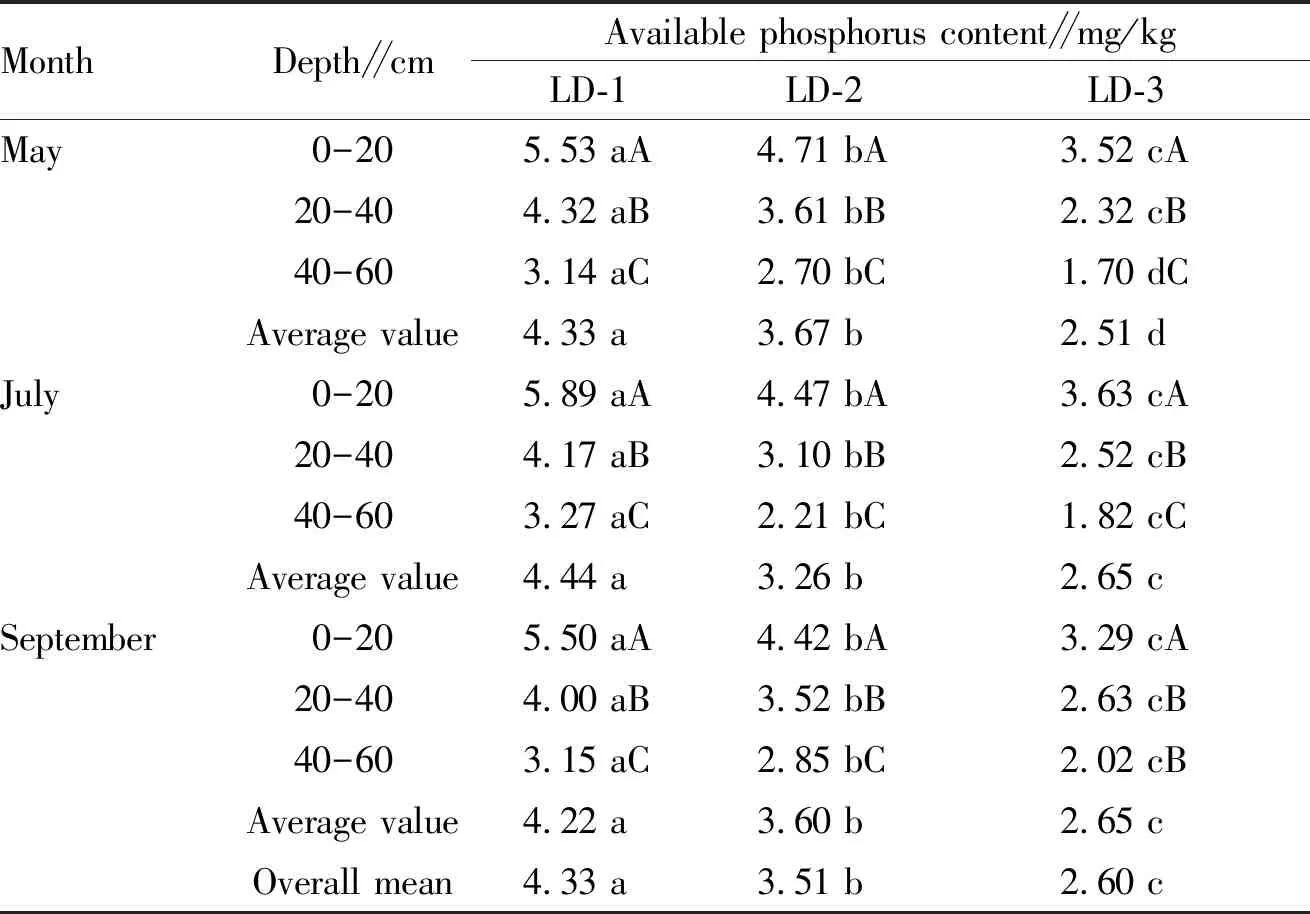
MonthDepth∥cmAvailable phosphorus content∥mg/kgLD-1LD-2LD-3May0-205.53 aA4.71 bA3.52 cA20-404.32 aB3.61 bB2.32 cB40-603.14 aC2.70 bC1.70 dCAverage value4.33 a3.67 b2.51 dJuly0-205.89 aA4.47 bA3.63 cA20-404.17 aB3.10 bB2.52 cB40-603.27 aC2.21 bC1.82 cCAverage value4.44 a3.26 b2.65 cSeptember0-205.50 aA4.42 bA3.29 cA20-404.00 aB3.52 bB2.63 cB40-603.15 aC2.85 bC2.02 cBAverage value4.22 a3.60 b2.65 cOverall mean4.33 a3.51 b2.60 c
3.2 Changes in soil enzyme activity ofL.principis-rupprechtiiland
3.2.1Changes in soil catalase activity of different forest farms. From Table 4, it can be seen that the soil catalase activity of different forest farms declined with the deepening of the soil layer, and the catalase activity of the same soil layer declined with the increase of the forest age. For the same forest farm, the catalase activity of the topsoil at the new leaf stage of the forest growth was significantly higher than that of the other two soil layers. Specifically, at the 0-20 cm depth, the soil enzyme activity of LD-1 forest age was 5.37 mL/g; at 40-60 cm depth, the soil enzyme activity dropped to 2.84 mL/g, declining by 47.1%. At the vigorous growth stage, the enzyme activity of surface soil was 4.80 mL/g, and at 40-60 cm depth, the soil catalase activity was 4.51 mL/g, which was 6.0% lower than that at the 0-20 cm depth. For different ages ofL.principis-rupprechtiiforest land, the soil catalase activity showed a declining trend at different stages (May, July and September). The average catalase activity of different forest ages was as follows: LD-1 > LD-2 > LD-3. Specifically, in May, the soil catalase activity of LD-3 had the lowest value of 3.19 mL/g, which was significantly lower than 3.68 mL/g of LD-2 and 4.31 mL/g of LD-1; in September, the soil catalase activity of LD-3 was also the lowest (1.37 mL/g) and the difference with the surface soil was significant (P<0.05).
Table 5 Changes in soil catalase activity of different forest farms
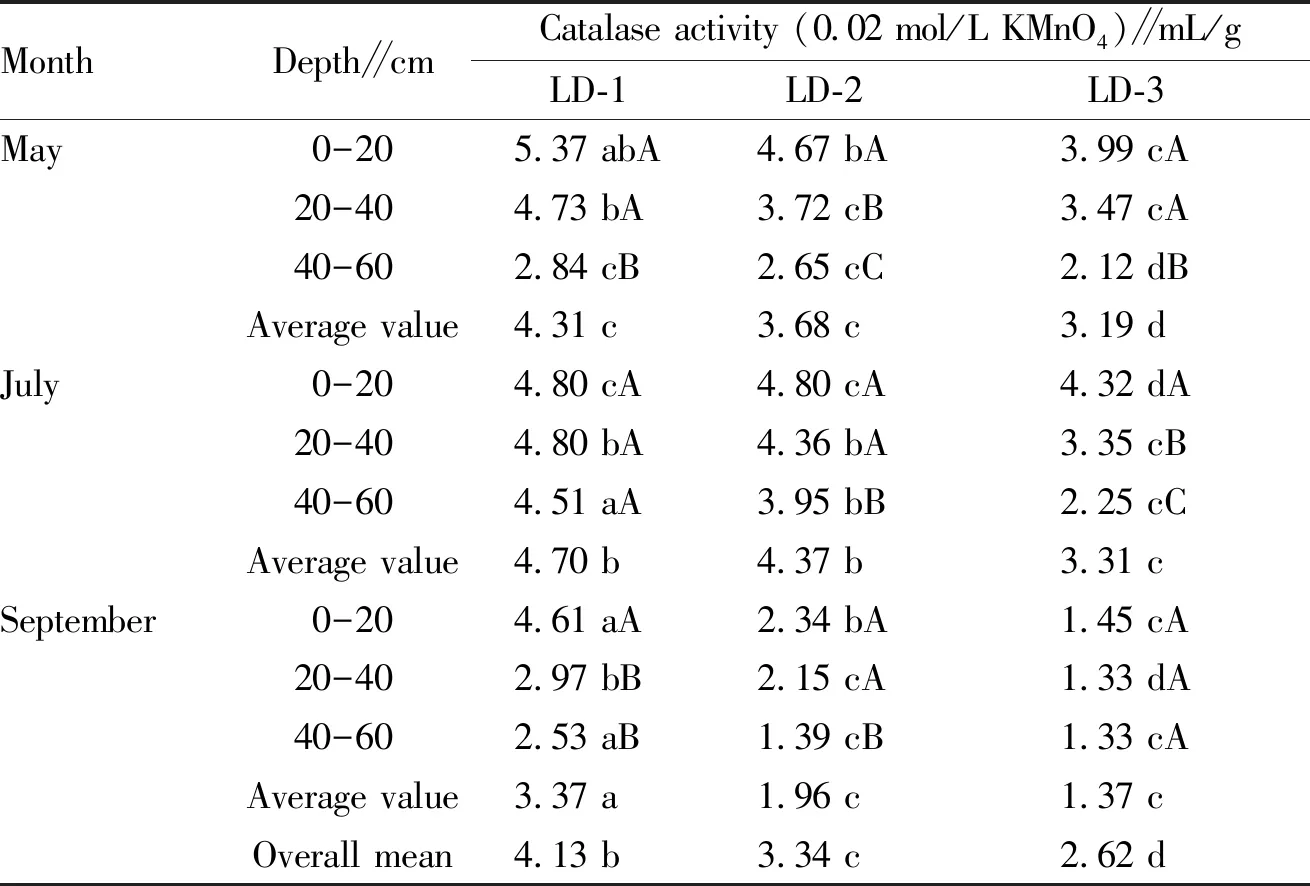
MonthDepth∥cmCatalase activity (0.02 mol/L KMnO4)∥mL/gLD-1LD-2LD-3May0-205.37 abA4.67 bA3.99 cA20-404.73 bA3.72 cB3.47 cA40-602.84 cB2.65 cC2.12 dBAverage value4.31 c3.68 c3.19 dJuly0-204.80 cA4.80 cA4.32 dA20-404.80 bA4.36 bA3.35 cB40-604.51 aA3.95 bB2.25 cCAverage value4.70 b4.37 b3.31 cSeptember0-204.61 aA2.34 bA1.45 cA20-402.97 bB2.15 cA1.33 dA40-602.53 aB1.39 cB1.33 cAAverage value3.37 a1.96 c1.37 cOverall mean4.13 b3.34 c2.62 d
3.2.2Changes in soil phosphatase activity of different forest farms. From Table 5, it can be seen that the soil phosphatase activity ofL.principis-rupprechtiiland declined significantly with the deepening of the soil layer. Specifically, at different growth stages ofL.principis-rupprechtii, the phosphatase activity of surface soil declined slowly with the increase of tree growth years, and the phosphatase activity in other soil layers declined significantly, and the phosphatase activity remained unchanged during the growth years of different forests. The phosphatase activity of LD-3 in the topsoil was the lowest (0.27 mg/g) at the defoliation stage; the phosphatase activity in the surface soil of LD-1 was the highest (0.41 mg/g); at 20-40 and 40-60 cm, it sharply declined to 0.17 and 0.07 mg/g, respectively, which were 58.5% and 82.9% lower than that in the topsoil, and the difference was significant (P<0.05). By comparison, for different ages ofL.principis-rupprechtiiforest land, the average soil phosphatase activity showed a declining trend with the increase of forest age. In May, LD-3 had the lowest soil phosphatase activity (0.16 mg/g), which was significantly lower than that of LD-2 (0.18 mg/g) and LD-1 (0.21 mg/g); in September, the phosphatase activity of LD-3 was the lowest (0.16 mg/g), followed by 0.19 mg/g for LD-2 and 0.20 mg/g for LD-1, respectively. In the same forest farm, the soil phosphatase activity did not change significantly at different growth stages.
Table 6 Changes in soil phosphatase activity of different forest farms
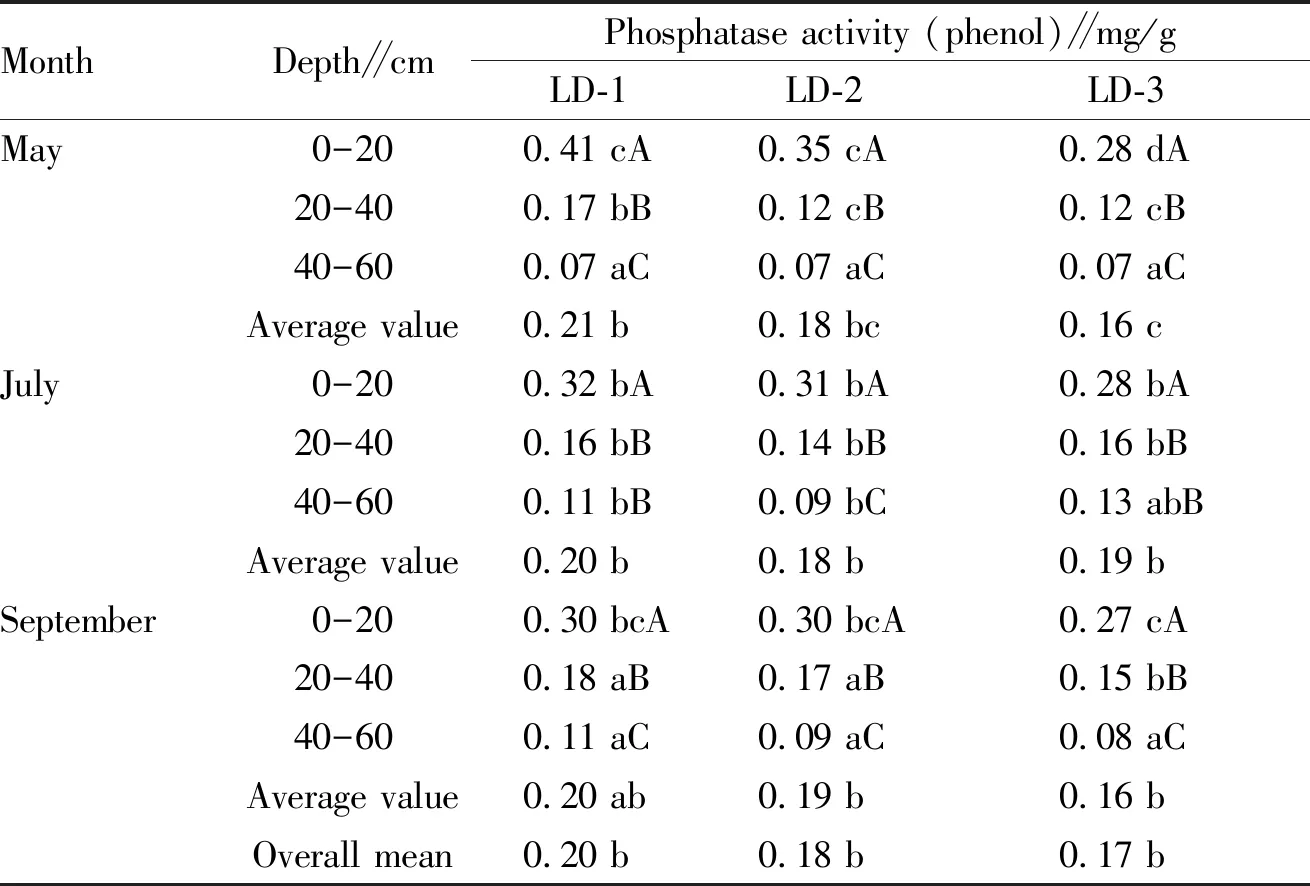
MonthDepth∥cmPhosphatase activity (phenol)∥mg/gLD-1LD-2LD-3May0-200.41 cA0.35 cA0.28 dA20-400.17 bB0.12 cB0.12 cB40-600.07 aC0.07 aC0.07 aCAverage value0.21 b0.18 bc0.16 cJuly0-200.32 bA0.31 bA0.28 bA20-400.16 bB0.14 bB0.16 bB40-600.11 bB0.09 bC0.13 abBAverage value0.20 b0.18 b0.19 bSeptember0-200.30 bcA0.30 bcA0.27 cA20-400.18 aB0.17 aB0.15 bB40-600.11 aC0.09 aC0.08 aCAverage value0.20 ab0.19 b0.16 bOverall mean0.20 b0.18 b0.17 b
3.2.3Characteristics of changes in soil urease activity of different forest farms. From Table 6, it can be can be seen that the soil urease activity ofL.principis-rupprechtiiland declined significantly with the deepening of the soil layer at different stages and in different forest ages. Specifically,L.principis-rupprechtiiin five years old had the highest soil urease activity (0.65 mL/g) at the surface layer, 0.16 mL/g at 20-40 cm soil depth, and declined to 0.10 mL at 40-60 cm soil depth, which were 75.4% and 84.6% lower than the surface layer, respectively, and the urease activity was significantly different from the surface soil (P<0.05), but the difference between the two was not significant. At the new leaf stage of forest growth, the surface soil urease activity of LD-2 was 0.52 mL/g, which was significantly higher than 0.18 mL/g at 20-40 cm soil depth and 0.13 mL/g at 40-60 cm soil depth.
There were significant differences in the soil urease activity ofL.principis-rupprechtiiin different ages and at different growth stages. The changes of five years old and 20 years old ofL.principis-rupprechtiiat different growth stages were as follows: September > July > May, and that of 10 years old was May > September > July. The soil urease activity ofL.principis-rupprechtiiland increased firstly and then declined at the new leaf stage; at the vigorous growth stage and defoliation stage, the soil urease activity declined with the increase of the forest age. From Table 7, it can be found that the average soil urease activity during the whole growth stage was 0.24 mL/g for 5 and 10 years old, and by the age of 20, the soil urease activity declined to 0.08 mL/g, which was 66.7% lower than that of five years old and 10 years old and the difference was significant (P<0.05).
Table 7 Changes in soil urease activity of different forest farms
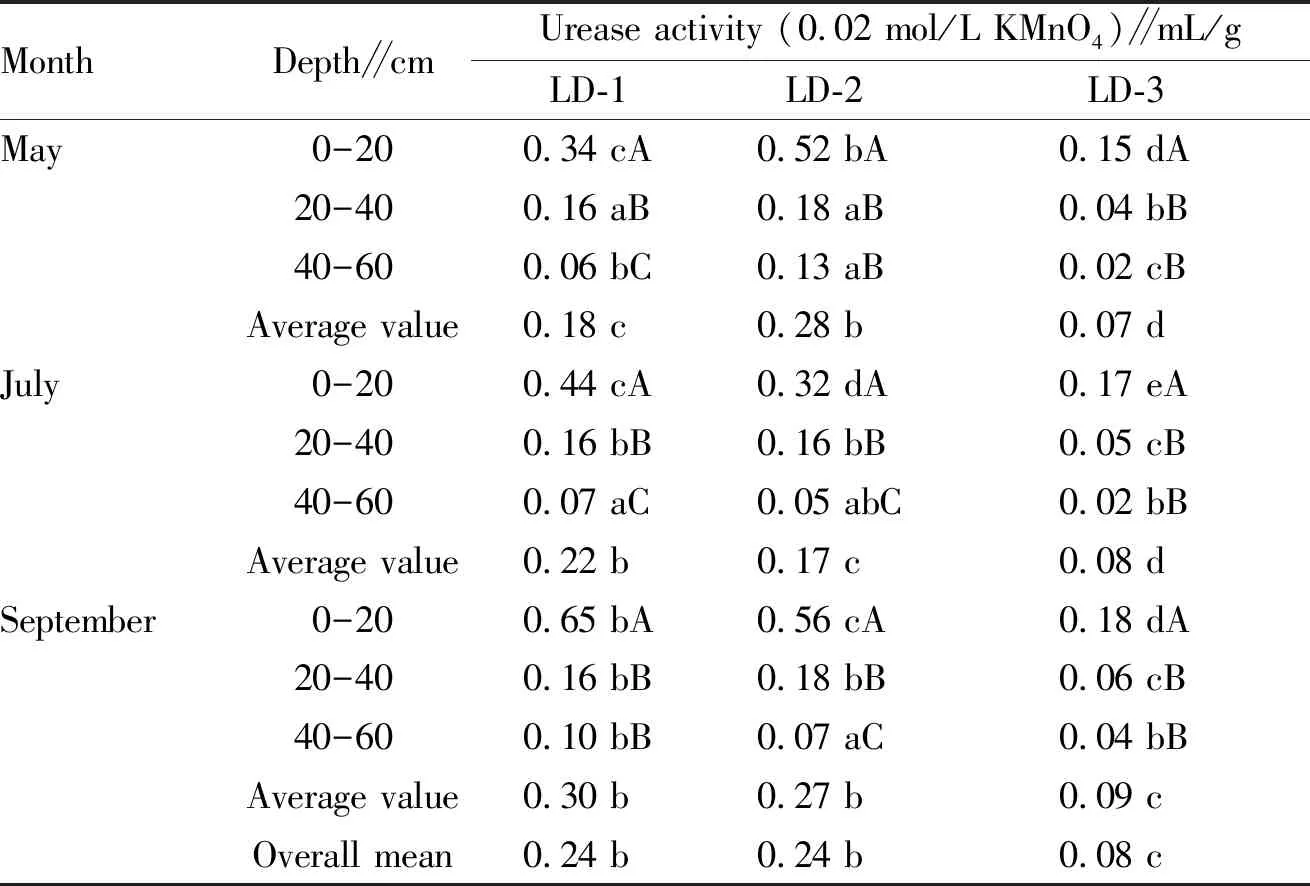
MonthDepth∥cmUrease activity (0.02 mol/L KMnO4)∥mL/gLD-1LD-2LD-3May0-200.34 cA0.52 bA0.15 dA20-400.16 aB0.18 aB0.04 bB40-600.06 bC0.13 aB0.02 cBAverage value0.18 c0.28 b0.07 dJuly0-200.44 cA0.32 dA0.17 eA20-400.16 bB0.16 bB0.05 cB40-600.07 aC0.05 abC0.02 bBAverage value0.22 b0.17 c0.08 dSeptember0-200.65 bA0.56 cA0.18 dA20-400.16 bB0.18 bB0.06 cB40-600.10 bB0.07 aC0.04 bBAverage value0.30 b0.27 b0.09 cOverall mean0.24 b0.24 b0.08 c
4 Conclusions
Through surveying and analyzing the changes in soil nutrient and soil enzyme activities in different forest farms, we found that the soil nutrient and enzyme activity declined most significantly in the 20-year forest age (LD-3) of the forest farm.
(i) The soil organic matter, ammonium nitrogen and available phosphorus in different forest farms declined with the increase of forest age. These changes in soil fertility indicators can show the changes of soil fertility. In other words, the soil nutrient and enzyme activity declined most significantly in the 20-year forest age (LD-3) of the forest farm. The soil layer indicates that the changes of organic matter with the forest age was inconsistent with that of soil depth, possibly because the accumulation of rot of litter in the forest may increase the organic matter content of the surface soil.
(ii) The soil catalase, phosphatase and urease declined with the increase of forest age in different forest farms, and declined to the lowest in the forest farm LD-3. However, the decrease in phosphatase was not significant, and the catalase, urease and sucrase activities were significantly declined. In summary, the soil enzyme activity is an essential indicator indicating soil fertility, reflecting that theL.principis-rupprechtiiforest is most likely to decline in the LD-3 forest farm.
杂志排行
Asian Agricultural Research的其它文章
- Ridge Covering High-yield Cultivation Techniques of Jinhong Apple in Cold Region
- Different Fertilization Modes of Sugarcane in Latosolic Red Soil of Guangxi
- Effects of Seaweed Extracts on Promoting Growth and Improving Stress Resistance in Sugarcane
- Cultivation Countermeasures of Farmers’ Ecological Consciousness and Behavior in Eco-civilization Construction——A Case Study of Agricultural Waste Recycling
- Risk Assessment and Service Benefit Evaluation of Forestry Meteorological Disasters in Guangxi
- Survey on Factors Influencing the Decline in Chicken Consumption of Urban Residents in Liaoning Province