Research on the Law of Garlic Price Based on Big Data
2019-03-18FengGuoPingzengLiuChaoZhangWeijieChenWeiHanWanmingRenYongZhengandJianruiDing
FengGuoPingzengLiuChaoZhangWeijieChenWeiHanWanmingRenYongZhengandJianruiDing
Abstract:In view of the frequent fluctuation of garlic price under the market economy and the current situation of garlic price,the fluctuation of garlic price in the circulation link of garlic industry chain is analyzed,and the application mode of multidisciplinary in the agricultural industry is discussed.On the basis of the big data platform of garlic industry chain,this paper constructs a Garch model to analyze the fluctuation law of garlic price in the circulation link and provides the garlic industry service from the angle of price fluctuation combined with the economic analysis.The research shows that the average price rate of the price of garlic shows “agglomeration” and cyclical phenomenon,which has the characteristics of fragility,left and a non-normal distribution and the fitting value of the GARCH model is very close to the true value.Finally,it looks into the industrial service form from the perspective of garlic price fluctuation.
Keywords:Big data,Big data analysis,Garch,normality,ARCH,industrial service.
1 Introduction
In recent years,with the popularity of digital devices,such as mobile phones,laptops,and the Internet,and the increase of social network access,the amount of data has increased dramatically.According to January 31,2018,the forty-first China Internet Information Center (CNNIC) issued a statistical report on the development of China’s Internet Network in Beikgg,which shows that the number of pre-estimated netizens will reach 1 billion 100 million in 2020,which will produce a huge amount of data information,and also indicate that we are gradually entering the era of big data.In addition to massive structured data and unstructured data,the more real-time analysis is needed in the era of big data.Big Data analysis (BDA) is the use of methods and techniques to obtain,store,transfer and analyze a large number of visual structured data and unstructured data.It is of great significance to better provide scientific and accurate decision-making,to excavate value information,and to speed up the development of the industry.
In the current market economy,moderate fluctuations in prices is a normal reaction of the market mechanism,but in the agricultural products market,the supply of agricultural products due to the characteristics of seasonal and cyclical changes,the price change is relatively large,especially garlic,mung bean,and other small agricultural products prices,easy handling characteristics easily induced by market speculation and follow the trend that is easy to cause the market price of the frequent volatility,directly affect the various aspects of the main industry in the interests,and even cause the market disorder,social unrest.
There is a lot of research about the characteristics of garlic price fluctuations,and most of them focused on China,this and our country garlic planting area,yield,export international market share,in the share of first in the world have a direct relationship [Pan(2012)].For example,Zhang et al.[Zhang,Zhang and Chen (2010)] analyzed the fluctuation cycle of garlic wholesale price data from 2002 to 2009 based on the industrial chain theory analysis.The study found that garlic price increase since 2009 was only a periodic performance of garlic price fluctuations.The price fluctuation of garlic has not had much impact and put forward suggestions such as public opinion guidance and information system construction.Shao [Shao (2011)] analyzed the accidental factors between garlic price fluctuations according to the general thinking,studied the garlic price fluctuations using the divergent spider web model,and revealed the link between garlic price and its variables such as output,time variables,demand function,and supply function.The study found that the price of garlic was huge.The reason for the amplitude fluctuation is that garlic supply is more price-elastic than demand.Yao et al.[Yao and Zhou (2012)] used the ARCH model to study the characteristics of garlic price fluctuations from 2004 to 2012.The study showed that the price fluctuations of garlic had significant agglomeration and asymmetry.The garlic market did not have the characteristics of high risk and high returns.At the same time,garlic price fluctuations were asymmetrical.The news of falling prices will cause greater price volatility than news of rising prices.Qiu [Qiu (2013)] used HP filtering and constructed ARCH model analysis.It is concluded that the price fluctuations of garlic have a tendency and periodicity,and the factors affecting the fluctuations in different stages are not completely the same.Li et al.[Li and Zhang (2015)] used CF filter to analyze the fluctuation characteristics of garlic prices,arguing that the garlic price fluctuation has a significant seasonality in April 2009.As of October 2011,garlic prices have experienced abnormal fluctuations.Li et al.[Li,Qin,Zhou et al.(2017)] used the GARCH-M and EGARCH models to find that garlic price fluctuations have obvious “peak fat tail,nonnormal” characteristics with strong persistence and significant aggregability.And asymmetry,making the garlic market has high risk and high returns Characteristics.From now on,the discussion of garlic price fluctuation is a single discipline,or even a single mode and a single method.But today,the links of the data explosion industry chain are increasingly closely linked,and it is impossible to explain many phenomena and problems in the process of production and development of the garlic industry [Wen(2013)].On the basis of building garlic industry big data platform and the reality of comprehensive statistical and econometric methods by combining the actual characteristics of garlic price fluctuations,a precise division of the garlic industry provides information support.On the other hand is the integration of multiple disciplines,improve the garlic industry chain of large data platform,accelerate the development of industry the data,to promote the industry reform.
2 Method
The GARCH model is a regression model tailored to the volume of financial data at the beginning.Based on the general regression model,the GARCH model can further model the error variance and effectively fit the heteroscedasticity function with long-term memory.The GARCH model is especially suitable for the analysis and prediction of volatility.Such an analysis can play a very important guiding role for investors’ decisionmakers,and sometimes even exceeds the analysis and prediction of the value itself[Walter (2006)].
2.1 Test of normality
The normal distribution is one of the most common and most important distributions in nature.When it is used for statistical analysis,it is always willing to assume normality,but whether the assumption is valid is related to normality test.There are 4 common methods for normality test:Normal probability paper,the goodness of fit test,W test and D test,skewness and kurtosis test,four kinds of normality test methods advantages and disadvantages [Sangyeol and Junmo (2008)]:
(1) The method of normal probability paper is simple and intuitive,but it is more subjective and belongs to qualitative test.
(2) The chi-square test of goodness of fit 2 can not only test the normality of distribution but also check whether the whole person obeys other distributions.From this point of view,it is universal with the former,but at the same time,they lack special effect on normality test,and the effect is not very ideal.
(3) The W test and the D test only test the specific methods of the general distribution of the normal distribution.Relatively,the effect is ideal,but the scope of their use is different.
(4) Skewness and kurtosis test in the prior information in general skewness or kurtosis is clearly deviated from the direction of the case,to test whether the overall normal distribution,called the test direction.If the information does not have practical problems,can use this method to test.
Combining the advantages and disadvantages of the 4 normal test methods,this paper selects the test of skewness and kurtosis.
2.2 ARCH model
The full name of the ARCH model is the autoregressive conditional heteroscedasticity.It is a special characteristic of the time series model proposed by Engle in 1982.It responds to a special characteristic of the stochastic process,that is,variance changes with time,and has clustering and volatility.ARCH model is mainly applied to the study of price fluctuation in the financial field.
The essence of the ARCH model is the historical volatility information as a condition,and a change of autoregressive form to describe fluctuations,conditional variance using the ARCH model can characterize the changes over time,it is the unconditional variance more timely response sequence of spot volatility characteristics,the ARCH model is concerned with the volatility fitting of the sequence.
The complete structure of the ARCH model to extract the relevant information contained in the heteroscedasticity:

Among them,f(t,xt-1,xt-2,…)+εtfor {xt}the Deterministic information fitting model,
2.3 GARCH model
The full name of the GARCH model is the generalized autoregressive conditional heteroscedasticity model,which was developed by the ARCH model proposed by Engle in 1982.
The purpose of using the ARCH model is to use the Q order moving the average of the residual squared sequence to fit the value of the current heteroscedasticity function.However,since the moving average model has the autocorrelation coefficient Q order truncation,the ARCH model is applied to the short-term autocorrelation process.To compensate for this process,in 1985,Bolleerslev proposed a generalized autoregressive conditional heteroskedasticity model,which is based on the ARCH model and added the P order autocorrelation of heteroscedasticity functions to make GARCH models smooth[Zhe (2018)].In the formula (1) plus a sufficient and necessary condition,itThe generalized autoregressive conditional heteroscedasticity model neglects all kinds of factors at the macro level and can solve the problem of large hysteresis and many estimation parameters of the ARCH model [Wu (2015)].The GARCH model modeling process is like Fig.1 below:

Figure1:GARCH model modeling process diagram
The most commonly used model in GARCH is GARCH (1,1).It can solve heteroskedasticity and solve the same variance problem.The general form of GARCH (1,1) model is

In the formula,αis an explanatory variable coefficient,ηis a first order random perturbation term,andλis a first order Coefficient of variance,Z0andZ1are constant terms.
3 Data acquisition
The average wholesale price of garlic in the wholesale market of Shandong province from January 4,2011,to December 31,2017,was selected as the experimental data set,with a total of 2170 observed values.The data source is a large data platform for the garlic industry chain.Fig.2 is the daily average price chart of garlic days in Shandong province.The horizontal axis represents the date (date range January 4,2011,to December 31,2017),and the longitudinal axis represents garlic price,the unit price is RMB/Kg.

Figure2:The daily average price of garlic in Shandong Province
4 Statistical test
4.1 Data processing
The trend of the price trend of garlic in Fig.2 shows a downward trend,which shows a nonstationary sequence.Now the garlic price data is processed smoothly,so that Rt=lnPt-lnPt-1=dlnP ,Rtis the logarithmic first order difference of garlic day price,and its sequence is {Rt},Ptand Pt-1,respectively,respectively indicate the price of garlic on T day and the price of garlic on the T-1 day.The logarithmic first order difference time series of the garlic daily price is shown in Fig.3.
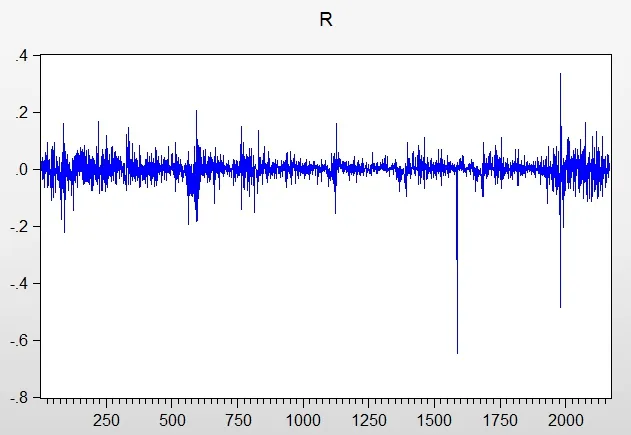
Figure3:The daily average rate of return on garlic prices
It can be observed from Fig.3 that the sequence is more stable and “cluster” than the original price sequence.The fluctuation of the 550 observation value to the 600 observation value and the 1900 observation value to the 2100 observation time period is relatively large,but the fluctuation in the range of the 1100 observation value to the 1400 observation value is small.
4.2 Test of normality
The basic statistical characteristics of the logarithmic first order difference sequence{Rt}and the mean sequence {Z}of the garlic daily price are given in Tab.1.
From Tab.1,it is found that the logarithmic first order difference of daily average price of garlic is-0.000214,and the standard deviation is 0.040959,which indicates that the logarithmic first order difference of garlic day price fluctuates more slowly.Theskewness is-2.610492,less than 0,indicating that the logarithmic sequence distribution has a long left tail,and kurtosis is 44.62914,which is higher than the kurtosis value 3 of the normal distribution,which indicates that the garlic price logarithm sequence has the characteristics of spike and thick tail.The Jarque-Bera statistic is 159008.7,the P-value is 0,and theP-value is less than 0.05.It is rejected that the first order difference sequence obeys the normal distribution hypothesis,and the sample sequence does not obey the normal distribution.
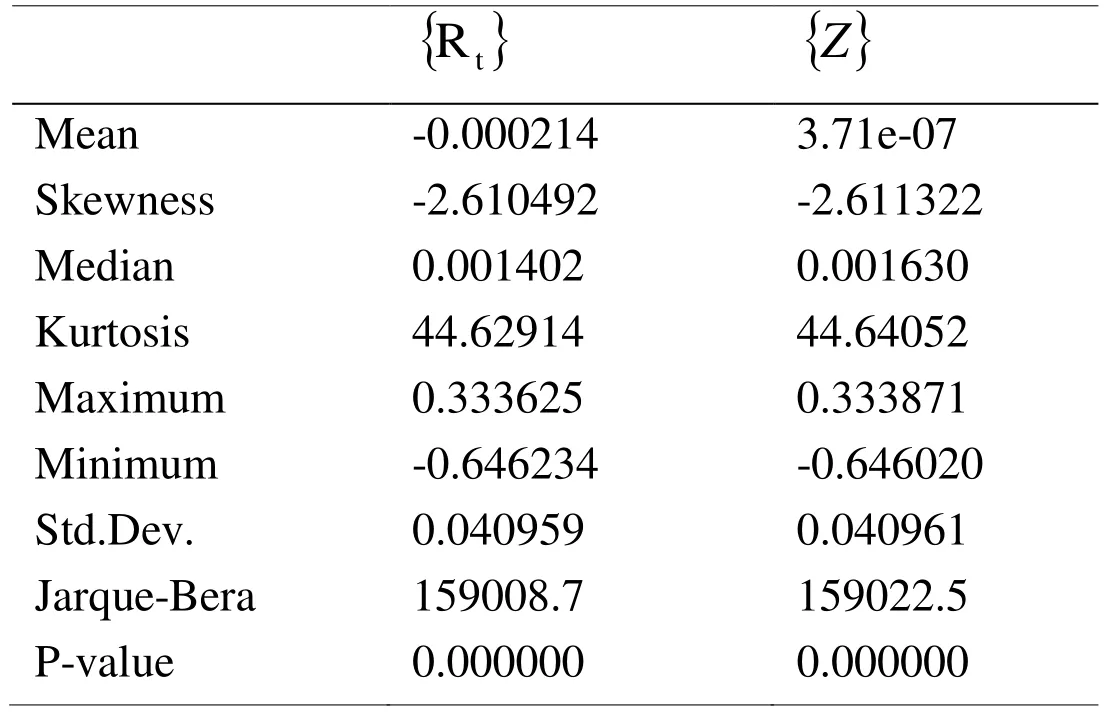
Table1:Basic statistical characteristics of the logarithmic first order difference sequence of the daily average price of garlic
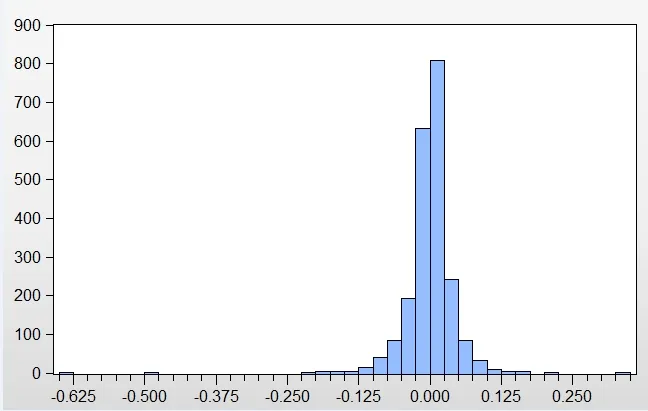
Figure4:Sequence {Rt}columnar statistics
4.3 Test of stability
Unit root test.In this paper,the ADF test is used to detect the stability of the sequence.The stationarity of the logarithmic first order difference of garlic prices is further verified by the ADF unit root test.The smoothness of sequences can be seen intuitively through Tab.2.As you can see from the following Tab.2,thet-statistics of the sequence are-22.09640,corresponding to theP-value of close to 0,that is,at the level of 1%,the sequence is stable.

Table2:ADF unit root test result table
PC And PAC Test.In order to test the robustness of the results,PC and PAC tests are carried out.After sequence lag 36 orders,we get the autocorrelation and partial correlation test chart of Fig.5,the coefficient of the autoregressive function is significant,and the corresponding P values of Q statistics are all zero,so there is a significant correlation between sequences at 1% significant level.
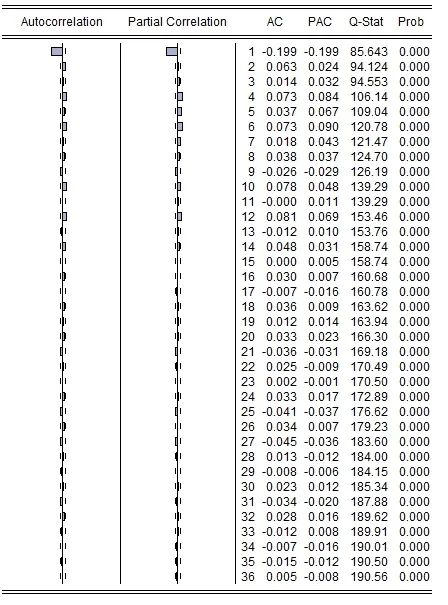
Figure5:Sequence { Rt }autocorrelation and partial correlation test
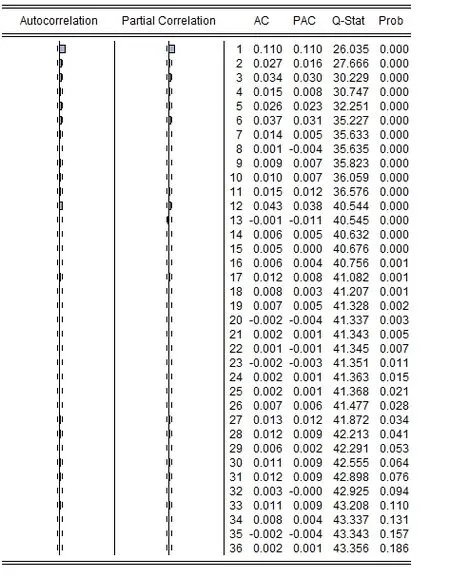
Figure6:Autocorrelation and partial autocorrelation function analysis diagram of a residual sequence
4.4 ARCH test
There are two ways to test the ARCH effect:The LM method (Lagrange multiplier test)and the square correlation diagram of residuals.
Forz=(r+0.000214)2,the autocorrelation test of the sequence of residual squared terms is shown in Fig.6.In Fig.6,there is an autocorrelation in the sequence of residual residuals,which shows that the garlic daily price has an ARCH effect on the first order difference sequence.
In summary,garlic daily price logarithm difference sequence has smooth,agglomeration effect and there is a significant ARCH effect,so as to establish the GARCH model.
4.5 Establishing a GARCH model
The parameter estimation of the GARCH (1,1) model includes the parameter estimation of the mean equation and the variance equation,and the maximum likelihood estimation is generally used to estimate these parameters.GARCH (1,1) model parameter estimation is implemented by Eviews9.0 software,and the results are as follows:
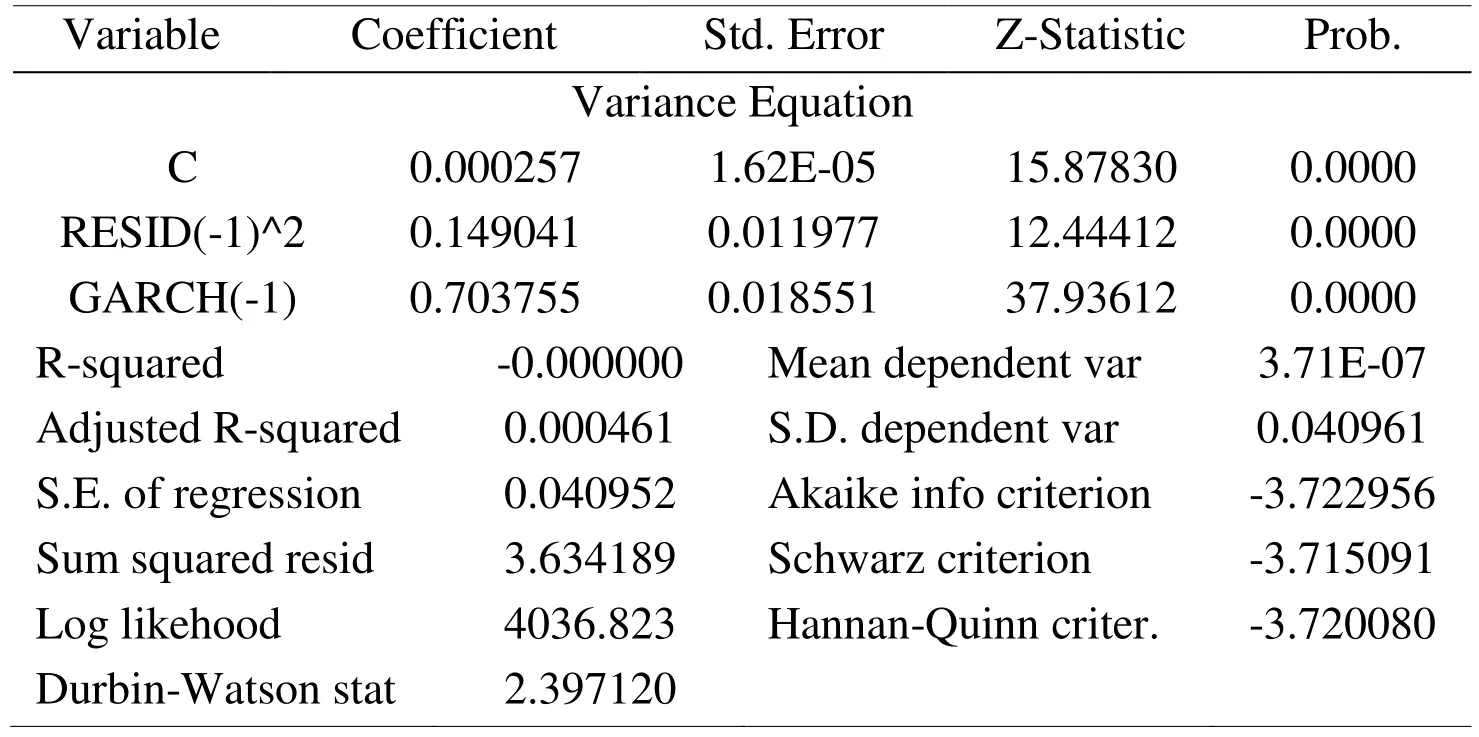
Table3:GARCH model parameter
According to the results shown above,the GARCH model can be established (variance equation):

The sum of the coefficient of RESID term and the coefficient of GARCH term in the above equation is 0.149041+0.703755<1 and it is close to 1,so the model is more stable.Based on the above model results,we further use a one-step forward fit to compare the daily price of garlic in December 2017.
Using the above model to fit the garlic price for December 2017,compare the fitted value with the actual value,as shown in Tab.4.
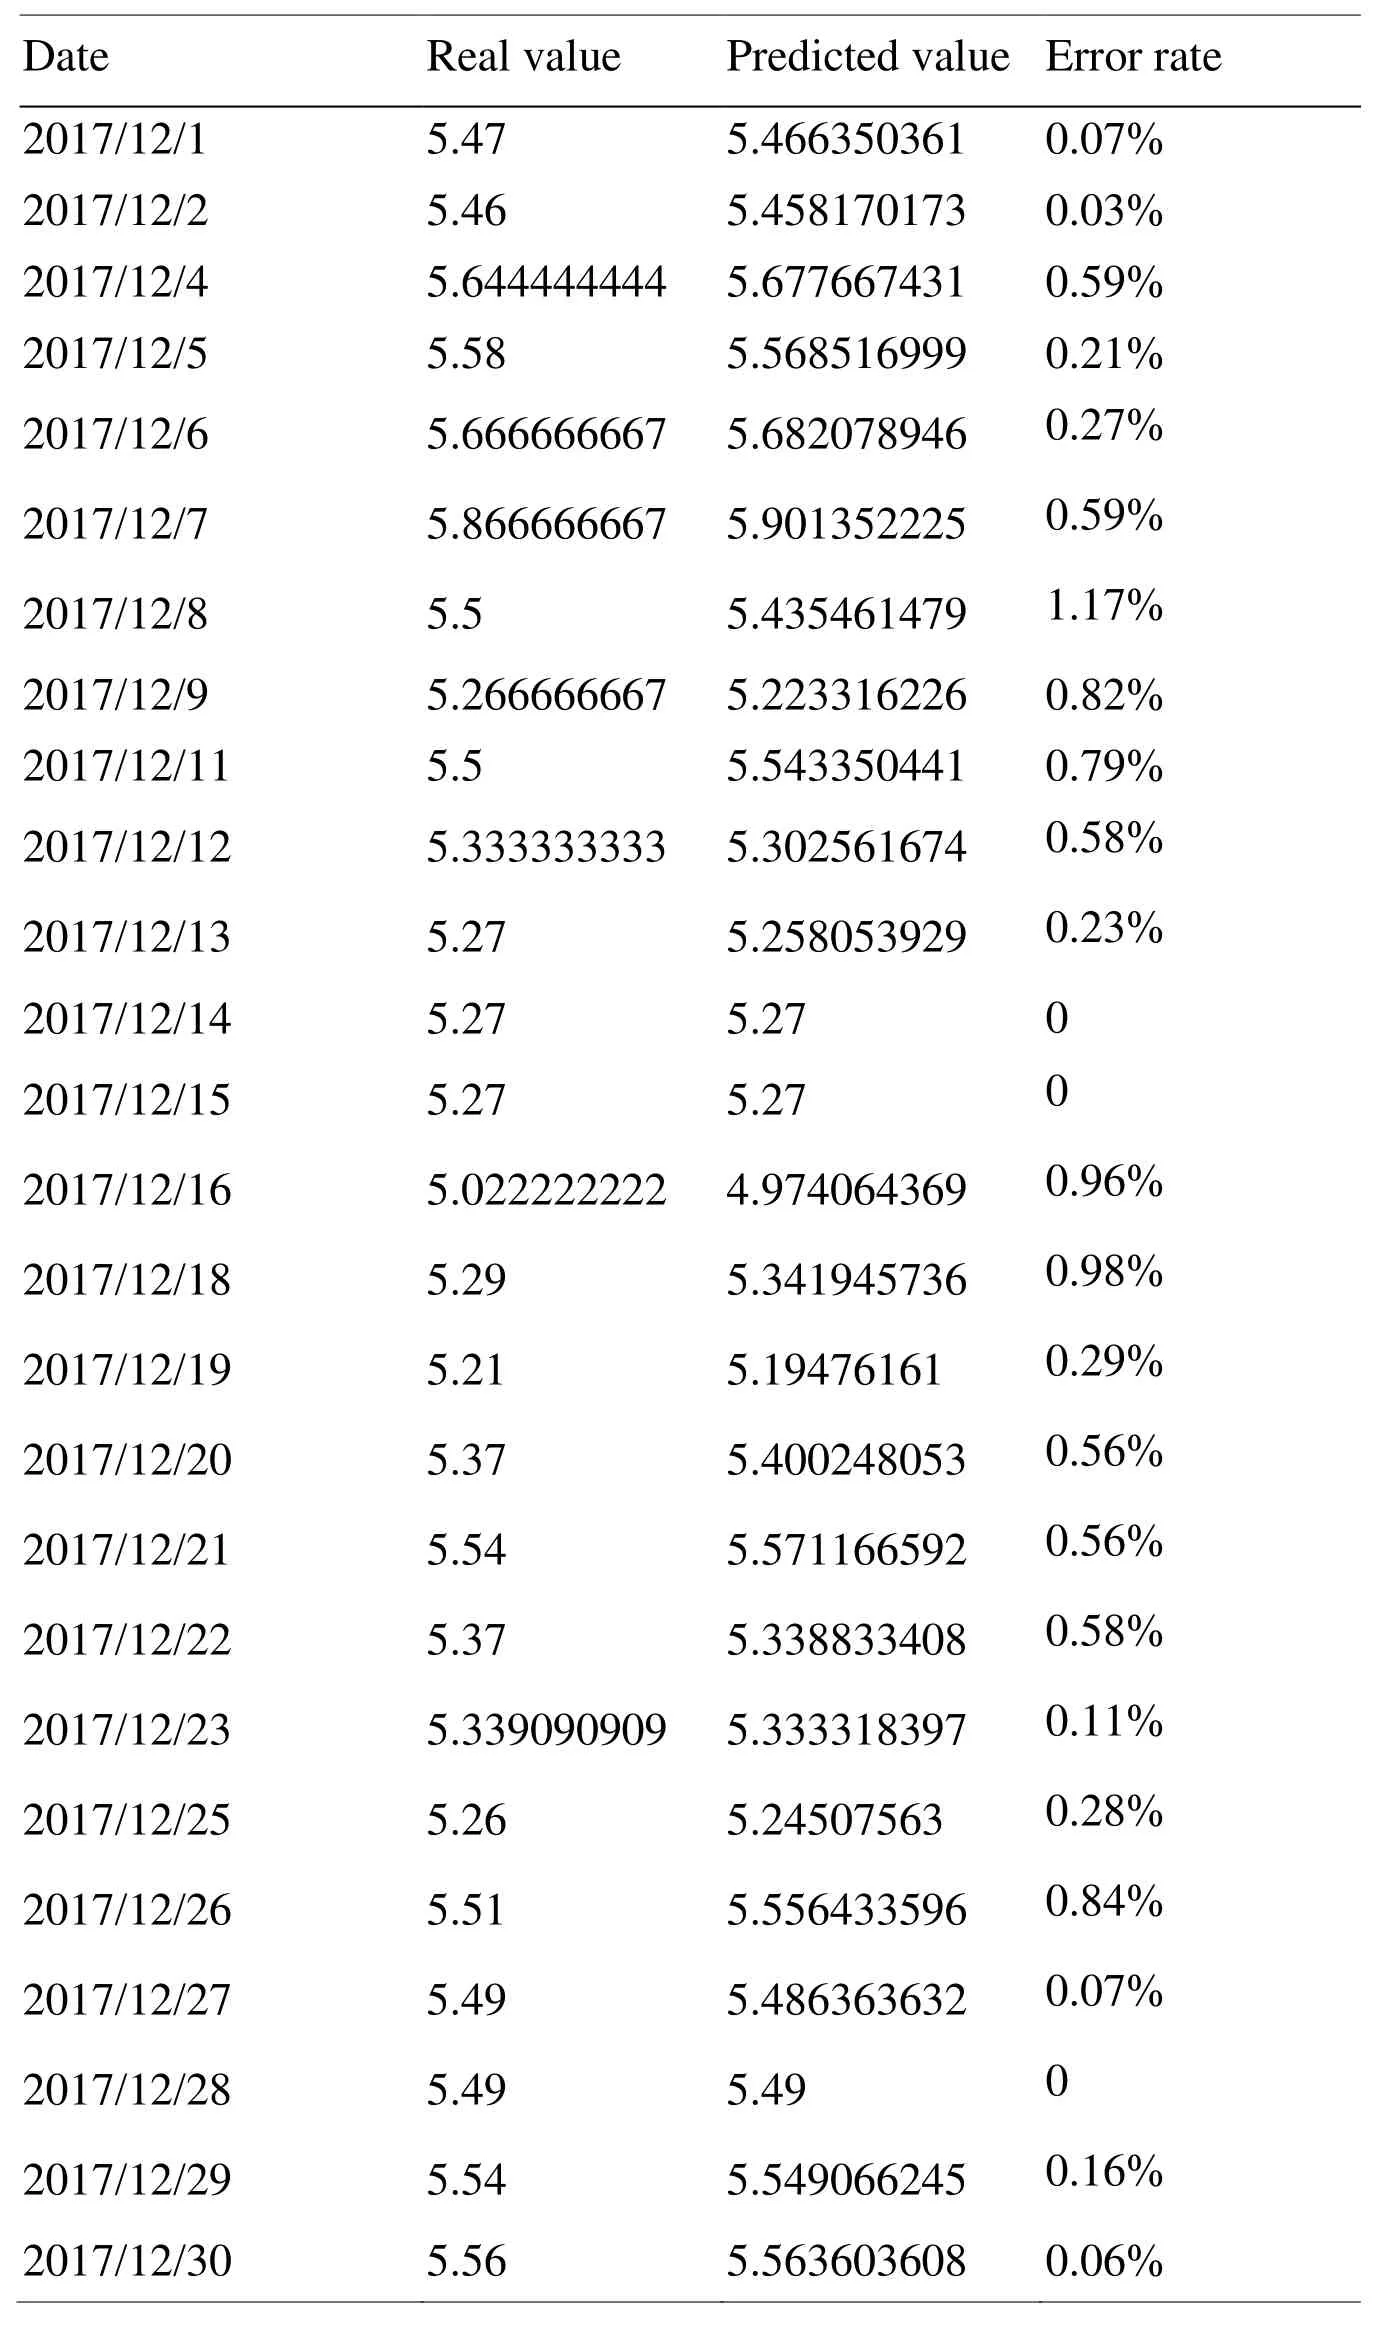
Table4:Comparison of the fitted and true values of garlic prices in December 2017
The average error in the whole fitting period is 0.415%.It can be seen from the following diagram that the fitting curve is consistent with the change trend of the original value curve.

Figure7:Comparison between the fitting value and the real value of garlic prices in December 2017
5 Conclusion
5.1 Result
In summary,this paper constructs the Shandong province from January 4,2011,to December 31,2017,the average wholesale price of garlic wholesale market to do an empirical test on the sample data set GARCH model,obtained the following conclusions:
(1) The yield of wholesale prices of garlic in Shandong wholesale market is“agglomeration” and cyclical,and the fluctuation range is also different,The fluctuation of the 550 observation value to the 600 observation value and the 1900 observation value to the 2100 observation time period is relatively large,but the fluctuation in the range of the 1100 observation value to the 1400 observation value is small.
(2) The yield of the daily wholesale price of garlic has the characteristic of peak and thick tail left deviation and non-normal distribution.
(3) Using the GARCH model to predict the average daily wholesale price of garlic,the predicted value is very close to the real value,which has a certain reference value,but when the sudden violent fluctuation occurs,the error is relatively large.
5.2 Reason
(1) Garlic is one of the most typical crops in small agricultural products.Garlic planting is mainly scattered by small farmers,and it is difficult to carry out mechanized planting.The small dispersion effect of planting,farmers planting blindness is relatively large,when the garlic planting area periodically play increased reduction,garlic prices will appear periodically rose or fell,leading to volatility will also change periodically.
(2) Affected by the biological characteristics of garlic,garlic harvest in 2~3 months,garlic must be stored in the warehouse,to prevent the garlic sprout mildew,so the price of garlic in a long period of time by taking control of storage.However,China’s garlic market is immature,and the impact of hot money on the market is relatively large.There is a large demand for speculation.Once the price has a downward trend,the Chamber of Commerce will sell a lot,and the price fluctuation will further expand.
(3) In 2010 and 2016 garlic planting area over the previous year dropped,the garlic prices rose sharply,Even a once “garlic you ruthless” phenomenon,garlic makes yields in 550 observations to 600 observations and 1900 observations to the 2100 observation period of relatively large fluctuations.In 2014,garlic planting was affected by last year’s high price of garlic and increased planting area,causing the price of garlic to fall crazy,and at one time,the phenomenon of “garlic you is cheap” also appeared.
5.3 Expectation
Based on the characteristics of garlic price fluctuations,due to data collection and other reasons,garlic production price is not considered (farm price) and consumer price.There is still a certain gap between the prediction of garlic prices and the reality,especially when there is a great error in the severe fluctuation.The model should continue to optimize,and we can further study these three aspects in the future.
Acknowledgments:This work was financially supported by the following project:Shandong independent innovation and achievements transformation project(2014ZZCX07106); The research project “Intelligent agricultural system research and development of facility vegetable industry chain” of Shan-dong Province Major Agricultural Technological Innovation Project in 2017; Monitoring and statistics project of agricultural and rural resources of the Ministry of Agriculture.
杂志排行
Computers Materials&Continua的其它文章
- R2N:A Novel Deep Learning Architecture for Rain Removal from Single Image
- Yield Stress Prediction Model of RAFM Steel Based on the Improved GDM-SA-SVR Algorithm
- A Straightforward Direct Traction Boundary Integral Method for Two-Dimensional Crack Problems Simulation of Linear Elastic Materials
- Effect of Reinforcement Corrosion Sediment Distribution Characteristics on Concrete Damage Behavior
- Controlled Secure Direct Communication Protocol via the Three-Qubit Partially Entangled Set of States
- Modeling and Analysis the Effects of EMP on the Balise System
