Effect of Reinforcement Corrosion Sediment Distribution Characteristics on Concrete Damage Behavior
2019-03-18FenghuaYuanQingZhangandXiaozhouXia
Fenghua Yuan,Qing Zhang, and Xiaozhou Xia
Abstract:Reinforcement corrosion directly affects the mechanical behavior of reinforced concrete structures.An electric corrosion test was conducted on a reinforced concrete test specimen,and a finite element model of the reinforcement corrosion damage was established.In addition,the damage behavior of reinforced concrete under different corrosion sediment distribution characteristics and different corrosion rates was studied.It was noted that when corrosion sediments are in a “semiellipse+semicircle” distribution,the results of numerical calculation are consistent with those obtained experimentally,reflecting the damage characteristics of reinforced concrete test specimens.Further,the results showed that the distribution characteristics of corrosion sediments greatly influence the damage behavior of reinforced concrete.In particular,when the corrosion sediments demonstrate a “semiellipse” distribution,reinforced concrete members may easily suffer from reinforcement damages.In the case of “semiellipse+semicircle” and“circle” distributions,the cohesive force between the reinforcements and concrete decreases:With the same corrosion rate,the damaged area expands with the increase in the number of reinforcements,which indicates a reduction in the cohesive force and thus,a reduction in the damage in the reinforcement area.This paper analyzes in-depth the effects of reinforcement corrosion expansion on the concrete damage behavior,provides references for practical engineering.
Keywords:Reinforced concrete,corrosion damage,numerical modeling,chlorine salt corrosion,durability.
1 Introduction
Reinforcement corrosion expansion causes microcracks to develop continuously in the concrete,thereby causing the cracking of the concrete cover and the development of a large number of reinforcement cracks.Hazardous media intrude the cracks in an accelerated manner and this accelerates the corrosion of concrete,which this leads to several resulting phenomena; for example,the cohesive force between the reinforcement and concrete continuously decreases,the effective area of the reinforcement is relatively small,and the bearing capacity declines [Lv,Ma,Zhou et al.(2009)].Therefore,it is of great significance to study the damage to reinforced concrete structures due to reinforcement corrosion,and the development laws of these damages.
Domestic and foreign scholars studied the structural damages caused by reinforcement corrosion from different perspectives.Weyers [Weyers (1998)] and Bhargava,Ghosh,Mori et al.[Bhargava,Ghosh,and Mori et al.(2006)] proposed the model for predicting the corrosion crack time.This model took into account factors such as tensile strength,elasticity modulus,corrosion rate,and corrosion product critical mass of concrete;however,the effect of distribution characteristics of corrosion products was not considered.Zhao et al.[Zhao,Yu,Jin (2011); Yuan,Ji,and Mou (2007)] studied the distribution characteristics of corrosion sediments and based on experimental results,proposed the formula corresponding to exponential and elliptical distributions; however,they did not further study the effects of distribution characteristics of corrosion sediments on the structural damages.Shaikh [Shaikh (2018)] comprehensively summarized the effect of crack width and depth on reinforcement corrosions and indicated that at the same crack width,compared to horizontal cracks,the longitudinal cracks caused the reinforcements to further corrode more easily.Ye et al.[Ye,Jin,Fu et al.(2017)]described the corrosion trace distribution with a Gaussian function and studied the corrosion characteristics and cracks of angle reinforcements in a cuboid test specimen.
There are many methods to deal with fracture and damage,such as cracking particles methods [Rabczuk and Belytschko (2004); Rabczuk and Belytschko (2007); Rabczuk,Zi,Bordas et al.(2010)] where the cracks can be arbitrarily oriented,peridynamics methods and dual-horizon peridynamics methods [Ren,Zhuang,Cai et al.(2016); Ren,Zhuang,and Rabczuk (2017)] which is introduced to consider the unbalanced interactions between the particles with different horizon sizes,specific meshfree methods [Rabczuk,Areias and Belytschko (2007);Amiri,Anitescu Arroyo et al.(2014)],extended isogeometric analysis [Ghorashi,Valizadeh,Mohammadi et al.(2015); Nguyen-Thanh,Valizadeh,Nguyen et al.(2015)],screened poisson equation models [Areias,Msekh and Rabczuk (2016); Areias,Rabczuk and Msekh (2016),Areias,Reinoso,Camanho et al.(2017)],remeshing techniques [Areias,Rabczuk and Dias-Da-Costa(2013); Areias and Rabczuk (2013); Areias and Rabczuk (2017)],anisotropic softening elements[Areias,Rabczuk and Camanho (2014)],strong discontinuity embedded approach[Saloustros,Pelà and Cervera (2017); Zhang,Zhuang(2018)],XFEM [Liu,Zhang and Xia (2017)],and phase field models [Zhou,Zhuang,Zhu et al.(2018); Zhou,Zhuang and Rabczuk (2018)].
From the results of existing research,we can see that corrosion distribution characteristics significantly influence the concrete damage.Under this context,in this work,the damage behaviors of concrete under reinforcement corrosion expansion characteristics were investigated by combining testing with numerical modeling.An electric corrosion test on a reinforced concrete test specimen was conducted by applying the constant current electrification method,and the damage conditions and reinforcement corrosion distribution of the test specimen at different corrosion rates were obtained.In addition,the authors established a finite element model of the corrosion damage,modeled the concrete damage effects caused by reinforcement corrosion,and explored the effects of the number of reinforcements,corrosion rate,and reinforcement corrosion pattern on the distribution and extent of concrete damage.
2 Structure reinforcement corrosion mechanism and corrosion distribution characteristics
2.1 Mechanism of reinforcement corrosion in concrete
The interior of concrete is highly alkaline,and therefore,a dense and highly adhesive passive film is generated on the surface of the reinforcement.This passive film further restricts hazardous substances such as oxygen and water from further infiltrating the structure.Therefore,no corrosion occurs in the reinforcement in normal cases.The stability of the reinforcement passivation film on the concrete relies on the intrusion of hazardous substances in ambient media.When the concentration of Cl-of the ambient medium at the intrusion of the reinforcement surface passivation film reaches a certain value,the passive film begins to crack and active corrosion begins to occur.
Corrosion of steel bars in the concrete can be split into 6 stages:
1.A corrosive layer is rapidly generated in the loose and porous area at the interface between steel bars and concrete due to the failure of oxygen,moisture and steel cover.
2.The loose and porous area at the interface is gradually filled by objects corrupted before a tight corrosive layer is generated.
3.The stress of expansion due to corrosion is increasingly increased with the increase of corrosion products,which lead to a cracking concrete cover that gradually penetrates the thickness of the complete cover.
4.Corrosive cracks are filled by corrosion products.
5.The crack is extended after the crack area is covered by corrosion products.
6.A new crack is filled again by corrosion products.
(Stage 5 & 6 will be conducted repeatedly.)
Before corrosion-induced cracking occurs,the corrosion of steel bars is mainly on the side facing the concrete cover,and occurs at the half circumferential perimeter of the steel bar,maximum corrosion occurs at the nearest point from the concrete cover.After corrosion cracking,the corrosion propagates from the side facing the concrete cover deeper into the concrete cover.
The volume expansion rate of reinforcement corrosion sediments is between 2 and 3.The expansion of corrosion sediments causes the corrosion expansion force at the interface between reinforcement and concrete to cause the cracking of the concrete cover.Such damage caused by reinforcement corrosion expansion is correlated not only with the extent of reinforcement corrosion but also with the distribution of the reinforcement surface corrosion.
2.2 Reinforcement corrosion distribution characteristics
Based on the research findings reported by Yuan et al.[Yuan,Ji and Mou (2007)],reinforcement corrosion can be categorized into three distribution characteristics:Semiellipse,semiellipse+semicircle,and circle.The expansion displacement at each point of the circumference of the reinforcement is correlated with the corrosion rate of the reinforcement,and can be determined using the following relations:

3 Corrosion testing of reinforcement concrete test specimen
3.1 Fabrication of test specimen
The considered test specimen is of the “pier” type with rectangular ends and a cylindrical middle.The cylindrical section was 900 mm high with a diameter of 192 mm.Eight HRB235 plain round reinforcements with a diameter of 12 mm were symmetrically installed onto the specimen.The concrete should have a strength grade of C30,and thus,Hailuo Grade 32.5 ordinary Portland cement,natural medium sand,and gravel with a maximum grain diameter of 20 mm,which were screened and flushed,were selected.During placement,the water cement mix ratio of the test specimen was 0.41,the sand ratio was 0.32 and the mix ratio (cement:Sand:Stone:Water) was 1:1.16:2.47:0.36.Ten reinforced concrete test specimens were fabricated.Fig.1 shows the schematics of the geometrical characteristics of the test specimen and the setup of the electric corrosion test.
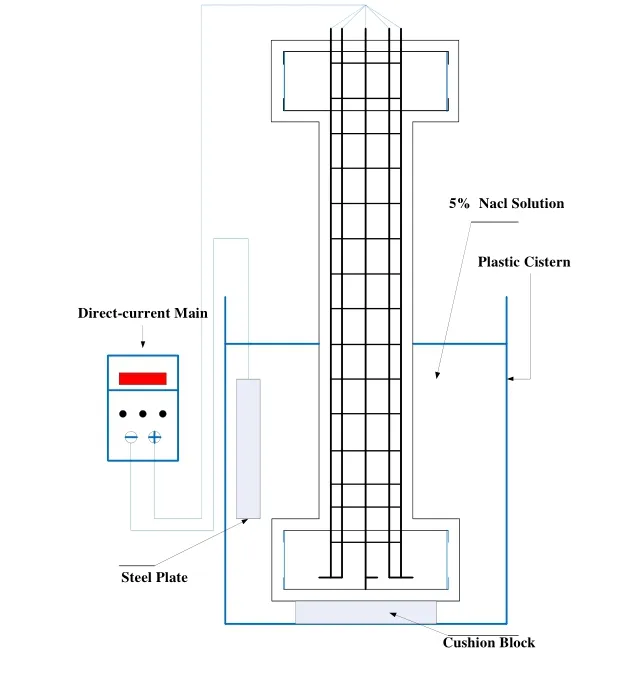
Figure1:Schematic setup for electric corrosion test
3.2 Electric corrosion test
After the test specimen was maintained for 28 days,the electric corrosion test was conducted by placing the text specimen in 5% NaCl solution; the current of each reinforcement was controlled to be 0.2 A.After the electric corrosion test was conducted for 336 h,the test specimen was removed from the solution and black rust was noted to be formed on the surface of the test specimen.After this rust was exposed to ambient air for a certain period of time,the color of the rust turned red.
Based on Faraday’s first and second laws,the following relation can be obtained:

where Δmis the mass (g) of metal deposited;Mis the molar mass (g/mol) of the substance;Iis the current intensity (A);tis the conduction time (s);nis the absolute value of the sum of positive or negative valences in the compound; andFis the Faraday constant whose value isF= 96487C/mol.

Table1:Corrosion rate and crack width
The massmand reinforcement corrosion rateηwere introduced,and Δm=mηwas satisfied.For this test,the following values were substituted in Eq.(4):M= 55.847 g/mol,n= 2,I= 0.2 andF= 96487 C/mol,and the relation between the corrosion rate and conduction time could be obtained asη=αt,whereα=8.268619e-8 (s-1).The corrosion rate of the reinforced concrete test specimen can be obtained by controlling the conduction time.

Figure2:Rust overflows the surface of specimen
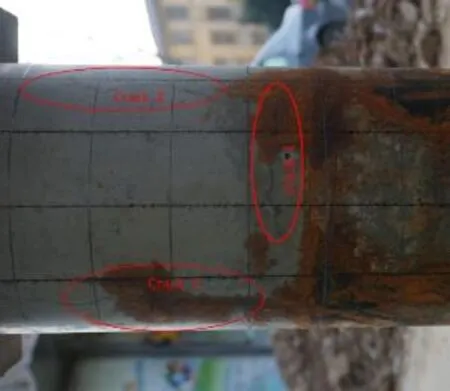
Figure3:Cracks on the specimen surface
Upon the completion of electrification,taking the specimen out,it was found that the specimen surface is seriously corrupted with longitudinal cracks and transverse cracks(Fig.2,Fig.3) on it in the electrification state.Then the cylinder of the test specimen was cut along the cross-section to analyze the crack pattern generated from the corrosion expansion in the cylinder,and the width of the crack on the concrete surface at different corrosion rates was measured by using a crack visualizer; these values are listed in Tab.1 and it can be seen that the crack width increases with the rate of corrosion.
4 Numerical modeling of reinforcement corrosion process
To analyze in-depth the effects of reinforcement corrosion expansion on the concrete damage behavior,the authors established a finite element model of corrosion damage,modeled the concrete damage effects caused by reinforcement corrosion,and explored the effects of the number of reinforcements,corrosion rate,and reinforcement corrosion pattern on the concrete damage distribution and extent; subsequently,these parameters were compared with those obtained from the test results.
To intuitively understand different damage patterns caused by different corrosion distribution characteristics,2D and 3D numerical modeling were performed.The damage distribution of concrete around the reinforcement in the model can be observed by 2D modeling and the development process of horizontal and longitudinal damages on the model surface can be observed using 3D modeling.
4.1 Computational model and conditions
The computational object was a part of the cylinder of the test specimen with a height and diameter of 500 and 96 mm,respectively; the thickness of the concrete-covering layer was 30 mm.Computational efficiency and accuracy were comprehensively considered,and 2D and 3D finite element models were established.In the 2D model,four reinforcements and eight reinforcements were evenly arranged.In the 3D model,four reinforcements,each with a diameter of 12 mm,were arranged.For the concrete,the plastic damage model proposed by Lubliner J et al.[Lubliner,Oliver,and Oller et al(1989)] and improved and developed by Lee et al.[Lee,Fenves (1998)] was adopted;this model can well simulate the mechanical behavior of quasi-brittle materials such as concrete,under cycling loads.
A display algorithm of concrete damaged plasticity model is adopted in this paper for simulation.It’s described by effective stress and hardening variables:

Where,andFshould satisfy with Kuhn-Tucker:

With effective stress and damage factor,Cauchy stress can be obtained:

It is linear elasticity before reaching the failure stress and followed by the softening stage under uniaxial tension.Meanwhile,the follow-up relationship between the failure stress and the cracking strain is described along with the degradation of rigidity.The cracking strain is as following:

Under uniaxial compression,it is linear elasticity before reaching the initial yield stress,then followed by the hardening stage until reaching the limiting stress.After that,it turns to the softening stage.Here,hardening data are given by inelastic strain rather than plastic strain.


Hence,the stress-strain relationship in tension and compression can be respectively described as follows:

It is assumed that the rigidity is degenerated to be isotropic in the model,which is described by scalar parameters,as shown below:

Where,st,scare parameters related to the stress state,defined as below :
Where:wt,wcare weighting factor related to the material property.It is used for describing the restoring rigidity of materials under reversed load
If the material is free from compression damage,namely:

If the material is in tension,then
If the material is in compression,thend= (1-wc)dt.
In this paper,the uniaxial constitutive relation proposed in appendix C of (GB50010-2002) is adopted and partially modified.The specific expression is as follows:

Where:x=ε/εc,y=σ/f*c.
In tension:

Where:x=ε/εt,y=σ/ft*.
Damage factors are calculated separately under compression and tension because of great differences in compressive and tensile performances of concretes.

We judge the degree of damage bydt.
Different oxygen,water,and concrete pH conditions affect the composition of the corrosion products.In this work,the test specimen was soaked in the solution all the time in the oxygen-depleted state.The composition valences of the corrosion products FeO and Fe3O4are relatively low.The mean of the expansion rates of these two products was selected,and thus,it was assumed that the expansion rate of the corrosion products was 2.The numerical modeling was performed by applying the corrosion sediment distribution Eqs.(1)-(3) obtained from the experimental work of Yuan et al.[Yuan,Ji,and Mou(2007)] and the relationwas obtained based on findings in the literature [Du,Chan and Clark (2006)].
4.2 Calculation results and analysis
Corrosion sediment distribution characteristics of semiellipse,semiellipse + semicircle,and circle were considered.Numerical calculation was performed under different numbers of reinforcements and corrosion rates to obtain the corrosion damage patterns of concrete.The calculation results are discussed as follows:
Figs.4 and 5 show the damage conditions of concrete at a corrosion rate of 10%,for different numbers of reinforcements and corrosion product distributions.It can be seen that:(1) For a semiellipse corrosion product distribution,most of the damaged areas were distributed on the outer side of the concrete cover and the reinforcement crack was easily generated,which caused the removal of the covering layer; when the corrosion sediment distribution was semiellipse+semicircle,most of the damaged areas were distributed around the reinforcement and this led to decrease in the cohesive force between the reinforcement and concrete.(2) When the corrosion product distribution was circle and namely even a wide area of damage of the concrete in the test specimen in addition to the circumference of the reinforcement.(3) Although the increase in the number of reinforcements can help increase the bearing capacity of the test specimen,the increase in the number of reinforcements can cause the amount of corrosion products to increase,which can aggravate the damage of the concrete between reinforcements.Thus,reinforcement design must be performed by comprehensively considering various factors such as loading features,atmospheric conditions.
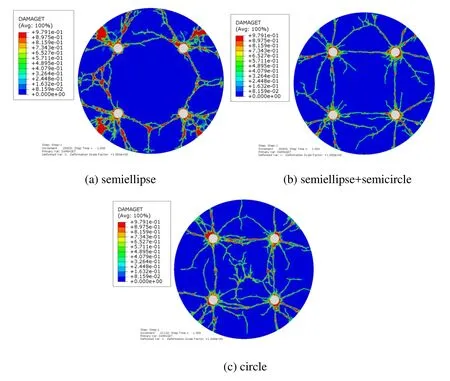
Figure4:Corrosion damage distribution of concrete when corrosion rate is 10% and the number of reinforcements is 4
Fig.6 shows the 3D calculation results of concrete test specimens when the corrosion rate is 5% for different corrosion sediment distributions.It can be easily seen that the corresponding damage area was most severe when the corrosion sediment distribution was semiellipse,and most of the damage was distributed on the outer side of the concrete cover.This observation demonstrates good agreement with the phenomena revealed in the plane problem calculation.
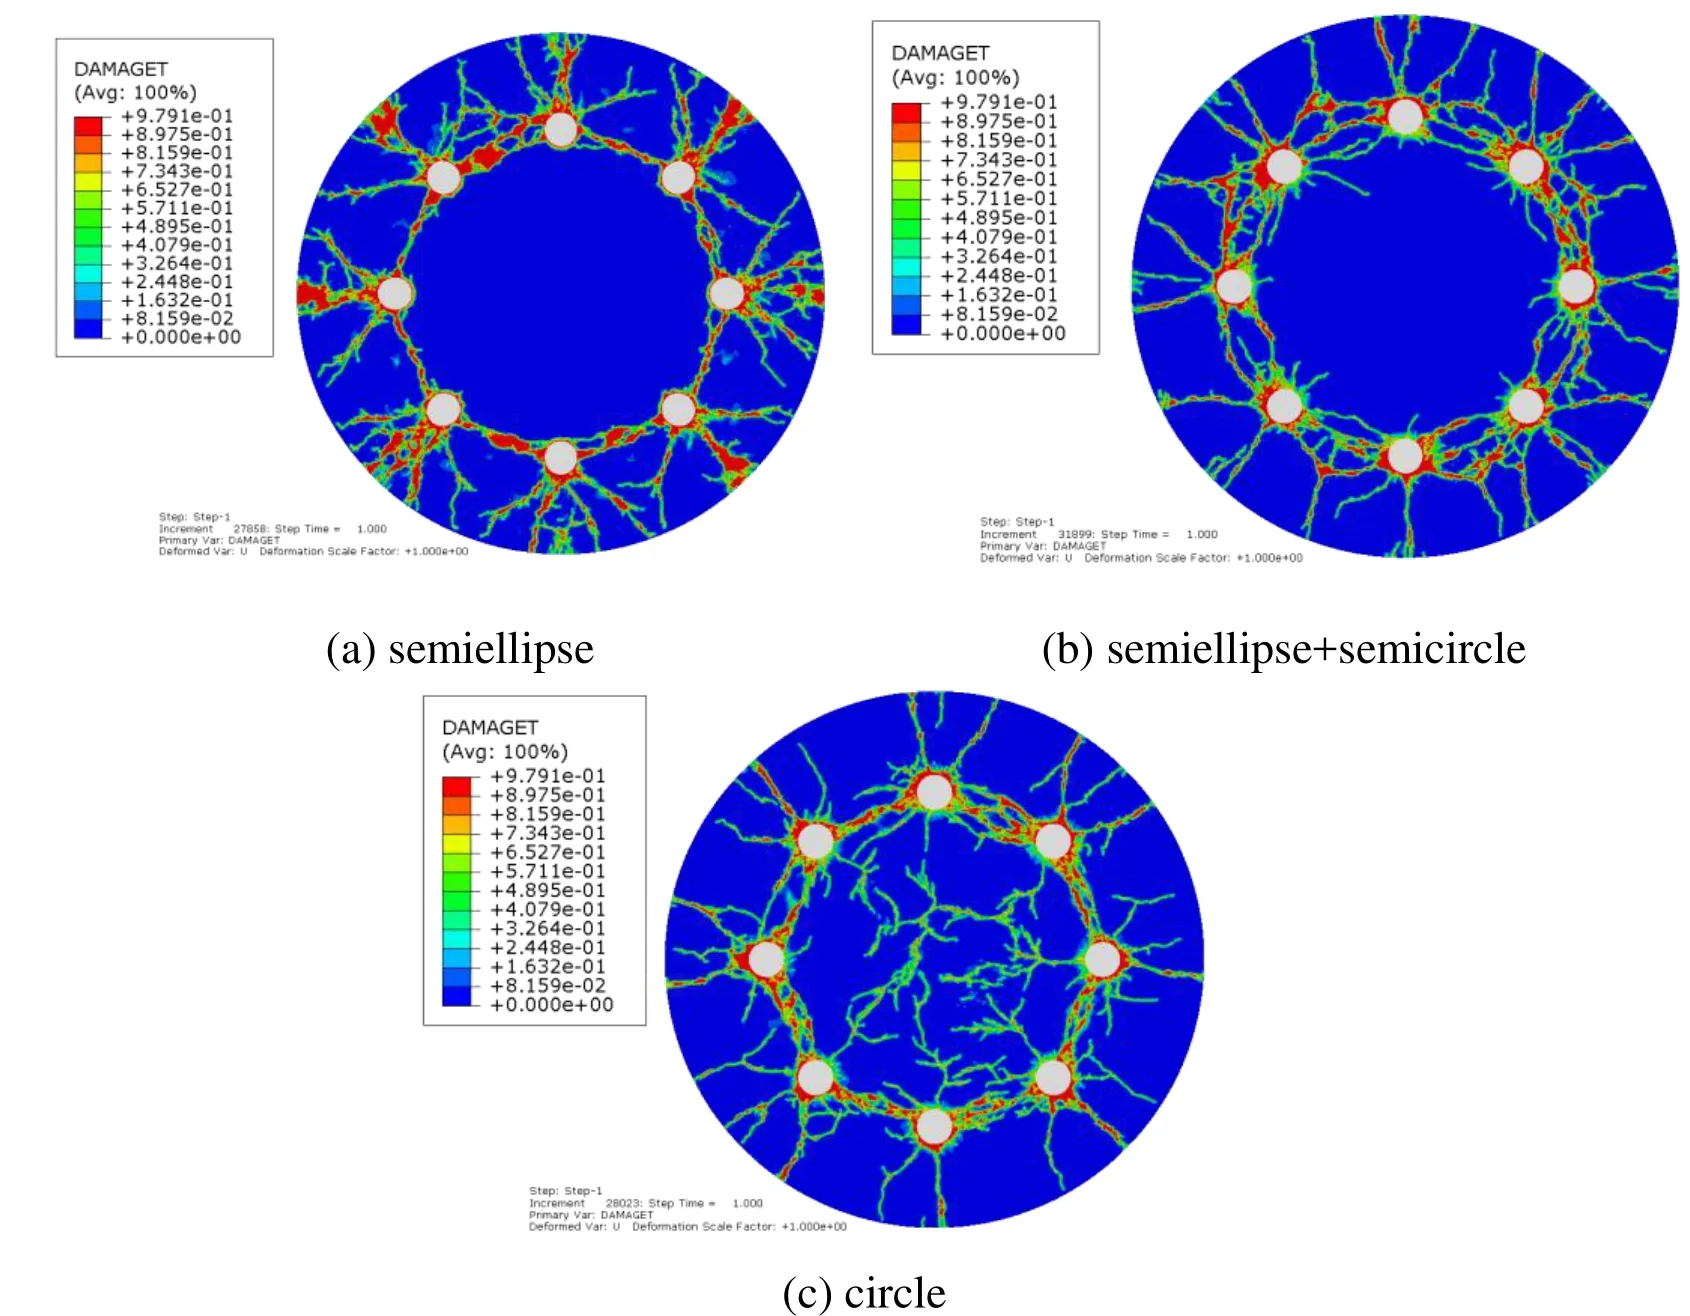
Figure5:Corrosion damage distribution of concrete when corrosion rate is 10% and the number of reinforcements is 8
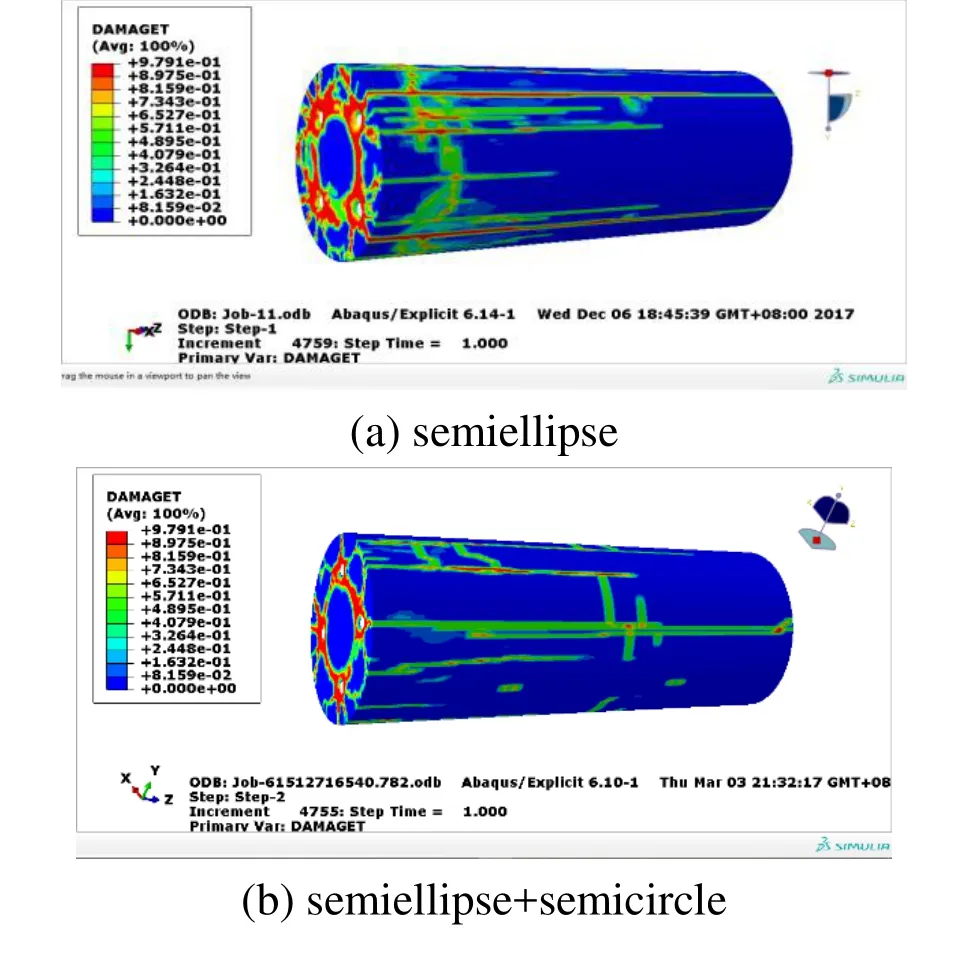
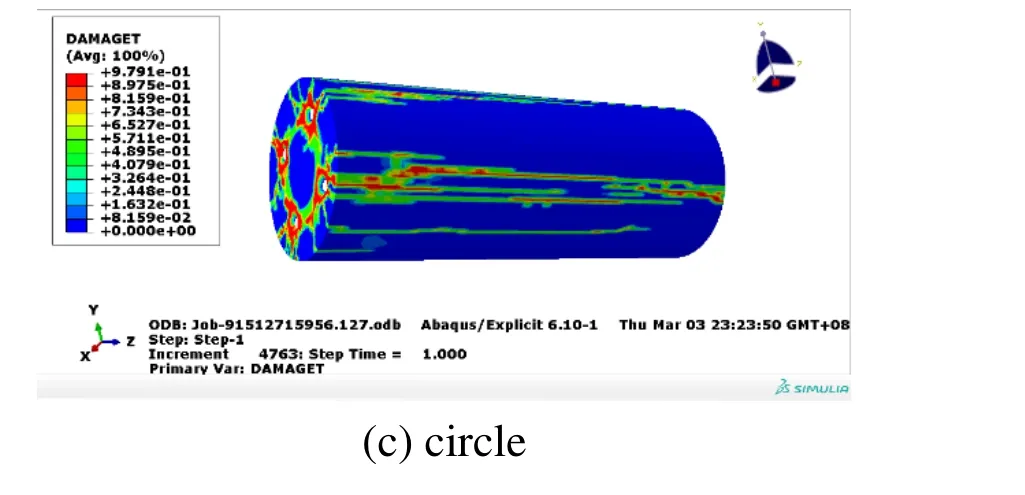
Figure6:3D corrosion damage pattern when the corrosion rate is 5%
To discuss in-depth the damage characteristics at different positions of the concrete cover,19 points around the reinforcements,as shown in Fig.7,were selected,and the relation of the abovementioned pull damage factors with time for the following conditions:number of reinforcements 4,corrosion rate 5%,and semiellipse +semicircle corrosion distribution,was obtained,as shown in Fig.8.The results indicate that the time at which damage occurred to the points along the circumferential direction (Points 1,4,7,10,11,14 and 17) and those close to the reinforcement on the internal side (Point 14),was delayed and the damage extent was relatively low.In general,damages developed from the exterior,and gradually move closer to the reinforcement,towards the inside.
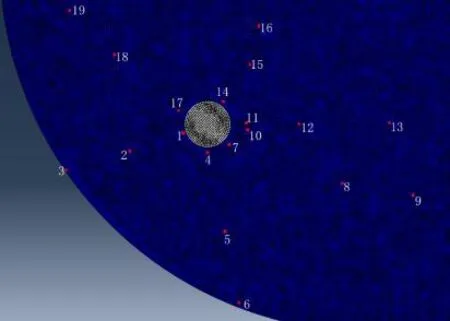
Figure7:Monitored points

Figure8:Relation between tensile damage factors at different positions and time
4.3 Comparative analysis of test results
During the test,the cylindrical specimen was cut in order to observe the crack pattern in the specimen due to corrosion expansion.Fig.9 shows the schematic of a slice of the test specimen when the corrosion rate was 5% and four through cracks were formed in the area between two reinforcements.Fig.10 shows the concrete damage distribution characteristics obtained when there were eight reinforcements (the same as those in the test),the corrosion sediment distribution was in semiellipse+semicircle,and the corrosion rate was 5%.The numerical calculation results were consistent with the test results,which,to a certain extent,indicates that under the given conditions,the corrosion products generated from the electrification are distributed in the semiellipse+semicircle pattern.
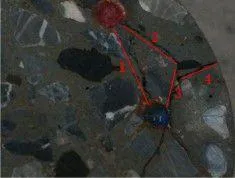
Figure9:Crack pattern after cutting test specimen when the corrosion rate is 5%

Figure10:Calculation results when corrosion rate is 5%
However,we have not dealed with uncertainties in both experiments and numerical simulations as done in references [Vu-Bac,Lahmer,Zhuang et al.(2016),Hamdia,Silani,Zhuang et al.(2017),Hamdia,Ghasemi,Zhuang et al.(2018)].
5 Conclusions
(1) The reinforcement corrosion distribution characteristics significantly influenced the distribution and extent of damage on concrete.When the distribution was semielliptical most corresponding damaged areas were distributed on the outer side of the concrete cover and reinforcement cracks were easily formed; when the distribution was semiellipse + semicircle and circle,most damage areas were distributed around the reinforcements,which caused the cohesive force between reinforcement and concrete to decrease.
(2) The reinforcement corrosion distribution characteristics were affected by several factors.The results obtained in this study indicate that under the given conditions,there is a high possibility that the corrosion products are in a semiellipse + semicircle distribution.(3) The increase in the number of reinforcements can help increase the bearing capacity of the test specimen,but such an increase can lead to an increase in the corrosion products,which can worsen the damage extent of concrete between reinforcements.For the reinforced concrete structure in a corrosive environment,reinforcement design must be performed by comprehensively considering all factors.
Acknowledgement:We appreciate the support from National Natural Science Foundation of China Projects (Numbers 11672101,11372099 and 11132003),National Key Research and Development Program Project (Number:2017YFC1502603) and Natural Science Foundation of Jiangsu Province (Number:BK20151493).
杂志排行
Computers Materials&Continua的其它文章
- R2N:A Novel Deep Learning Architecture for Rain Removal from Single Image
- Yield Stress Prediction Model of RAFM Steel Based on the Improved GDM-SA-SVR Algorithm
- A Straightforward Direct Traction Boundary Integral Method for Two-Dimensional Crack Problems Simulation of Linear Elastic Materials
- Research on the Law of Garlic Price Based on Big Data
- Controlled Secure Direct Communication Protocol via the Three-Qubit Partially Entangled Set of States
- Modeling and Analysis the Effects of EMP on the Balise System
