Predicting lean blow-off of bluffbody stabilized flames based on Damköhler number
2019-02-27ZhonghoWANGBinHUAimingDENGJunhuZHANGQingjunZHAO
Zhongho WANG,Bin HU,Aiming DENG,Junhu ZHANG,Qingjun ZHAO,c,*
aInstitute of Engineering Thermophysics,Chinese Academy of Sciences,Beijing 100190,China
bUniversity of Chinese Academy of Sciences,Beijing 100049,China
cKey Laboratory of Light-duty Gas-turbine,Chinese Academy of Sciences,Beijing 100190,China
Abstract Lean Blow-Off(LBO)prediction is important to propulsion system design.In this paper,a hybrid method combining numerical simulation and Da(Damköhler)model is proposed based on bluffbody stabilized flames.In the simulated reacting flow,Practical Reaction Zone(PRZ)is built based on OH radical concentration,and it is considered to be the critical zone that controls LBO.Da number is obtained based on the volume-averaged parameters of PRZ.The flow time scale(τf)indicates the residence time of the fresh mixture flowing through the PRZ.It is obtained based on the characteristic length and volume-averaged axial velocity of the PRZ.The chemical time scale(τc)indicates the shortest time needed to trigger the reaction of the mixture.It is obtained by commercial software CHEMKIN through monitoring the transient variation of the reactor temperature.The result shows that the average Da number under different LBO conditions is 1.135(the Da number under each LBO condition ranges from 0.673 to 1.351).This indicates that the flow time scale and chemical time scale are comparable.The combustion is in a critical state where LBO is easy to occur.With the increase of the fuel mass flow rate(the global fuel/air ratio increases from 0.004761 to 0.01095),τfincreases from 0.001268 s to 0.007249 s,and τcdecreases from 0.00124 s to 0.00089 s.Accordingly,Da number increases from 1.023 to 8.145,which shows that the combustion becomes more stable.The above results show that the method proposed in the present study can properly predict the LBO limits of combustors,which provides important technical supports for combustor design and optimization.
KEYWORDS Bluffbody stabilized flames;Damköhler number;Hybrid method;LBO;Time scales
1.Introduction
Bluffbody stabilization of flames is commonly used in aeroengine combustors,especially in augmentors.At inlets of augmentors,the oxygen concentration and pressure are relatively low(generally,the total pressure of augmentor inlet is 0.10-0.40 MPa,and the oxygen mass fraction is 12-17%),which goes against flame stabilization.Therefore,Lean Blow-Off(LBO)performance of combustors needs to be estimated during design stage,and then a high-accuracy LBO prediction method is needed to provide enough technical supports for combustor optimization.
Early LBO prediction methods are mainly semi-empirical models which were developed from experiments and theoretical derivation.These models could be classified into two categories:PSR (Perfectly Stirred Reactor)model1and CT(Characteristic Time)model.2These two models were both proposed in the study of bluffbody stabilized flames.Longwell made a homogeneity hypothesis to the recirculation zone and proposed the conception of PSR due to the drastic mixing process within it.1,3Flows of air and fuel enter the reactor and are instantaneously and perfectly mixed with the burning gases within the reaction volume.The gases in reactor are uniform in composition and temperature.LBO occurs when the heat supplied by the reactor is insufficient to raise the fresh mixture up to its ignition temperature.3Following Longwell et al.'s study,LBO prediction models were improved by Lefebvre and Rizk,and the models contain more factors affecting LBO,such as inlet flow velocity,reactor volume,pressure,temperature4,scale and shape of bluffbody5,6,fuel type7,etc.CT model explains LBO in a different angle of view.It was firstly proposed by Zukoski and Marbe.2They deemed that main reaction does not occur in recirculation zone.Hot products in recirculation zone only play the role of ignition source.Fresh mixture contacts with hot products at the edge of recirculation zone.If the fresh mixture is ignited by hot products within the residence time, flames can be stabilized.Otherwise,LBO occurs.Mellor et al.developed time models8,9and regarded the shear layer between the free stream and hot recirculation zone as the key region which is important to flame stabilization process.On the basis of this,they proposed that if the shear layer residence time of fuel is smaller than the sum of the fuel evaporation time and ignition delay time,LBO will occur.9
With the development of computational technique,high spatial/temporal accuracy numerical accuracy simulation has provided researchers with powerful tools in flames dynamic analysis close to LBO.In the study of flame dynamics near LBO,LES-CMC (Large Eddy Simulation-Conditional Moment Closure)model was employed by Tyliszczak et al.10LES-PDF(Probability Density Function)model by Black and Smith11and Gokulakrishnan et al.12LES-EBU(Eddy Break-Up)model by Kim et al.13LES-EDC(Eddy Dissipation Concept)model by Gokulakrishnan et al.14LES-LEM(Linear Eddy Mixing)model by Menon et al.15and LES-LTEM(Lagrangian Transport Element Method)model16by Erickson et al.When the combustion was close to LBO,similar flame behavior was detected in these simulation works.Local extinctions were observed in the above simulation works when flames were close to LBO.Lieuwen et al.summarized the relevant works and divided flame behavior into three steps based on their characteristics17:A)local extinction along the flame sheet;B)large scale wake disruption;C)the final blowout associated with wake cooling and shrinking.
LES is well-suited for simulating flame behavior before LBO,and many details of the flow field can be reproduced.There are also some cases where LES is used for LBO predictions.Near LBO flame behavior obtained in the simulations is consistent with the experiment.However,when quantified LBO limits need to be obtained,relevant models should be improved further.LES-CMC was used for LBO prediction of two-phase flames by Tyliszczak et al.10It was found that by adjusting a model constant in the subgrid model,a reasonable LBO limit could be obtained.LES-CMC model was also employed by Zhang and Mastorakos in LBO prediction of the Sandia D-F flames.18The predicted LBO axial bulk velocity is about 60%higher than the experimental value.LES-PDF method was used by Gokulakrishnan et al.for the prediction of LBO limits of bluffbody stabilized propane flames.12Ultimate quantified LBO limits were not given in this work,but it can be known from the simulation that the LBO equivalence ratio is below 0.60.LES-PDF method was employed by Black and Smith for LBO prediction of an aero low emission fuel injector.11The fluid unsteadiness near the LBO condition was captured,but the localized fuel-rich pockets affected the accuracy of LBO prediction.There are few LES works predicting LBO under various operating conditions and combustor configurations.Even though accurate LBO prediction can be achieved under a specific condition,whether it could be used for other conditions is still questionable.It is still hard for LES to satisfy engineering needs in LBO prediction.
At present,the primary problem impeding the application of high spatial/temporal numerical simulation in practical engineering is the huge computational cost,especially for combustion simulation,which couples chemical reaction in turbulent flow.According to Luo et al.'s work,typically,the thickness of reaction zone ofn-heptane flame is on the order of 2×10⁻⁵m,which restricts the grid size.Enormous calculation and memory resources are needed to resolve completely all flow structures.19As Menon have pointed out,LES can be very expensive and even though it can resolve the large scale structures accurately,the dynamics at the small scales still require modeling.It must be ensured that the high cost and uncertainties in the sub-grid models are not counter productive.20
The combination of semi-empirical LBO prediction models and numerical simulation compromises the universality and computational cost,and it has been explored by some researchers.Bin Hu et al.improved Lefebvre's LBO prediction model by introducing Flame Volume(FV)concept to the model.FV is related with flow fields which are obtained by numerical simulation.FV model21,FIA (Fuel Iterative Approximation)22model,and CCFV(Characteristic Curve of Flame Volume)23model were developed successively on the basis of FV concept and improved Lefebvre's model.The prediction uncertainties are reduced from±30%to lower than±10%in average.Ahmed also adopted the flame volume conception and developed a LBO prediction method.24Zheng et al.deemed that CRZ(Central Recirculation Zone)is the critical zone controlling LBO.25The conception of Feature-Section was proposed and defined as the surfaces where axial velocity equals zero.Feature-parameter Γ was calculated based on the fuel/air ratio and the changing rate of average temperature of Feature-Sections.The inflection point of Γ-fuel/air ratio curve indicates the occurrence of LBO.Kiel and Roach26,and Knaus27,28et al.predicted LBO of bluffbody stabilized flames by combiningDamodel with numerical simulation.In their approaches,different definitions of time scales contained inDamodel were proposed.From the aspect of turbulent mixing, flow time scale was defined as the ratio of turbulent kinetic energy(k)and dissipation rate(ε).26,27The chemical time scales were defined based on fuel consumption rate of each cell26and the time needed for OH radical mole fraction reaches maxima27.From the aspect of local extinction induced by high strain rate,the flow time scale was defined as the inverse of local strain rate.The chemical time scale was defined as the inverse of extinction strain rate obtained by CHEMKIN.28When the lobes whereDa<1 merge together downstream of the bluffbody,LBO is considered to occur.
In this paper,a hybrid LBO prediction method is proposed by combining numerical simulation andDamodel based on the Practical Reaction Zone of bluffbody stabilized flames.This method is a reasonable compromise between semiempirical models and numerical simulation.LBO limits can be accurately predicted with lower computational cost,which may be a feasible approach for LBO limits prediction in practical engineering.
2.General idea and theory
The LBO prediction method proposed in this study combinesDamodel and numerical simulations.PRZ is characterized from simulated reacting flow fields based on OH radical concentration,and it is considered as the critical zone controlling LBO.Danumber is defined as the ratio of flow time scale and chemical time scale,expressed asDa=τflow/τchem.Factors affecting LBO can be embodied concisely by the two time scales inDamodel.All parameters related withDanumber are obtained based on volume-averaged parameters of PRZ.
2.1.Practical reaction zone(PRZ)
The schematic diagram of PRZ in combustor is shown in Fig.1.The pink area indicates PRZ.Intense reactions that may affect LBO all occur there.Recirculation brings hot products upstream,but only weak reactions really occur in recirculation zone.Flames are anchored on the trailing edges of the V-gutter,and develop downstream.

Fig.1 Schematic diagram of PRZ in bluffbody stabilized flames.
PRZ is considered as the critical zone controlling LBO in the present study.There are many definitions of PRZ.Nonpremixed combustion stabilized by bluffbody contains many factors,such as turbulent flow,chemical reaction,heat and mass transfer,fuel injection and atomization.The definition of critical zones should take all the factors into consideration.At present,the definitions of critical zone can be divided into three categories:A)Considering the recirculation zone as PRZ.It is true that recirculation zone is important to flame stabilization.However,in the large part of recirculation zone,reactant has already been consumed and only weak reaction exists.B)PRZ defined based on fuel concentration.The main problem of this approach is that once the reaction is started,the fuel is consumed and initial fuel concentration field is destroyed.Some researchers obtain the fuel concentration field by simulating non-reacting flow,but the effects of fuel evaporation and gas expansion are not taken into consideration.C)PRZ defined by temperature.It is true that the primary characteristic of combustion is high temperature,but high temperature may also exist in products where the reaction has already been ended.
According to the above discussion,in the present study,PRZ is defined based on OH radicals.The region where OH radical concentration is larger than a certain value is considered to be PRZ.The generation and consumption of OH radicals are always accompanied with intense heat absorbing and releasing.If OH radicals are not produced in a chemical reaction,the reaction cannot provide enough radicals and heat needed for stable combustion.29The existence of OH radicals shows whether effective reactions exist,and the concentration of OH radicals indicates the intensity of the reactions.The specific value of OH radical concentration on the PRZ boundary is determined by comparing the PRZ obtained in simulated flow field and the experiment.30
2.2.Time scales
There are various definitions of the time scales contained inDamodel.Systematic and comprehensive summary of the definition ofDanumber can be referred in Husain31and Cavaliere et al.'s work.32Shanbhogue et al.have pointed out thatDamodels are suitable for the prediction of local extinction,but do not fundamentally describe the ultimate LBO.17The innovation point of the current work is making it feasible to predict LBO byDamodels through the definition of PRZ.According to Shanbhogue et al.'s work,17different definitions ofDanumber describe flame behaviors from different angles.The definition ofDanumber can be divided mainly into 3 categories.The first definition is based on turbulent flow.The combustion is assumed to propagate from one Kolmogorov-scale vortex to a neighbouring one.32The flow time scale is defined as the time needed for flame propagation,and the chemical time scale is defined as the lifetime of the large eddies of the turbulence.Local extinction occurs when flow time scale is larger than chemical time scale.The second definition ofDanumber is based on strain rate.The flow time scale is typically defined as the reciprocal of the local strain rate,and the chemical time scale is defined as the reciprocal of the extinction strain rate.28Local extinction occurs whenDanumber is smaller than 1.The third definition ofDanumber is based on reaction zone.The flow time scale is typically defined as the residence time of the fresh mixture in the reaction zone,and the chemical time is generally used to indicate the LBO critical flow time.The first two definitions ofDanumber are suitable for predicting local extinction.However,when they are applied to LBO prediction,a proper criterion is lacked,which describes to what extent the extinctions may lead to LBO.The third definition ofDanumber is widely used in LBO prediction and has the potential to obtain accurate quantitative LBO limits.The pre-diction accuracy relies on the proper definition of the reaction zone and time scales.It will be very efficient to obtain the information needed in the semi-empirical models by numerical simulation.The target for the current study is the judgement of LBO,instead of the reproduction of the transient process of LBO,and thereby,RANS can satisfy the needs in this work.The detailed introductions of the two time scales will be presented below.
2.2.1.Flow time scale(τf)
The flow time scale in the present study is defined as the ratio of characteristic length scale(L)and characteristic velocity(v).Lis defined as the ratio of PRZ volume(VPRZ)and a characteristic area(A),expressed asL=VPRZ/A.In the present work,the characteristic area is suggested to be the product of section area(Ac)of the combustor and blockage ratio(BR),expressed asA=Ac×BR.vis the volume-averaged axial velocity of flows in PRZ.Flow time scale indicates the residence time of fresh mixture flowing through the PRZ.
2.2.2.Chemical time scale(τc)
Chemical time scale is defined as the shortest time needed to trigger the reaction in PRZ.It is obtained by the PSR module in CHEMKIN.
In this paper,a reduced 16 species-23 steps chemical kinetic mechanism33is introduced into CHEMKIN.Temperatures,pressures and equivalence ratios needed in CHEMKIN are obtained by calculating the volume-averaged parameters of PRZ in simulated flow field.In CHEMKIN,the initial residence time is set long enough to establish a stable combustion,and then it is reduced slowly until a sudden drop of temperature appears,which indicates that the reaction cannot be triggered.This residence time is considered to be the minimum time needed to trigger the reaction and written as τc.
An example of τcacquisition in CHEMKIN is shown in Fig.2 (the operating condition of the combustorisMainlet=0.184,Tinlet=546.15 K,FAR=0.00399).It is shown that there is pulse-rise of reactor temperature at the beginning of the ignition process both in Fig.2(a)and(b).This is caused by the initial high temperature(1706 K)set in PSR reactor.The initial temperature is assigned as the volumeaveraged temperature of PRZ since the fresh mixture entering the PRZ is ignited by hot gas when a stable combustion is established.The pulse-rise of reactor temperature does not affect the final calculation of chemical time scale.
In Fig.2(a),after the reaction has been triggered,the reactor temperature drops to about 1940 K and maintains stable.The result indicates that the residence time of 0.00103 s is enough for reaction to be triggered.In Fig.2(b),when the residence time is reduced to 0.00102 s,the reactor temperature drops rapidly to the inlet temperature(546.15 K).The residence time of 0.00102 s is too short for the reaction to be triggered,and then the chemical time scale under this condition is obtained as 0.00103 s.
3.Test rig
The LBO experiment was conducted by Wang and Jin.30For the clarity of the work presented here,the test rig is concisely introduced.The schematic of test rig is shown in Fig.3.The combustor is a 2D rectangular combustor.Incoming air is heated by 3 BK-I heaters.A bluffbody is installed 240 mm downstream of the combustor inlet.A fuel manifold is installed 13 mm upstream of the bluffbody.Fresh mixture is ignited by high-energy ignition plug.The post-test section contains temperature and pressure probes and an exhaust nozzle.The distance between the high energy ignition plug and bluffbody is 80 mm.The outlet temperature is measured by Pt-Rh_30/Pt-Rh_6 thermocouples,and the mass flow rate of the fuel is measured by DMF-1-2 mass flow meter.
There are 3 fuel injecting holes located symmetrically with spanwise length of 55 mm.The diameter of each injecting hole is 0.6 mm,and the fuel is injected in the reverse direction of the air flow.The fuel adapted in the experiment is Chinese RP-3 aviation kerosene.At about 960 mm downstream of the bluffbody,there are 3 temperature measuring points distributed uniformly along the vertical direction with an interval of 30 mm.The static pressure of incoming air flow is maintained 1 atm,the inlet temperature is 490-620 K,and theManumber of the incoming air is 0.17-0.25.For more details,please refer to Ref.30.
The LBO experimental data are listed in Table 1.In the present work,the LBO data are selected and categorized based on the sameMainletorTinletto analyze the effects of single parameters on LBO.The LBO data categorizations are shown in Fig.4.In group 1 and group 2,Tinletis almost constant,and the maximum difference ofTinletis about 8 K.The average inlet temperature(Tinlet,average)of group 1 and group 2 are 495.9 K and 547.15 K,respectively.In group 3 and group 4,Mainletis almost constant,and the maximum difference ofMainletis about0.011.The average in letManumber(Mainlet,average)of group 3 and group 4 are 0.217 and 0.205,respectively.
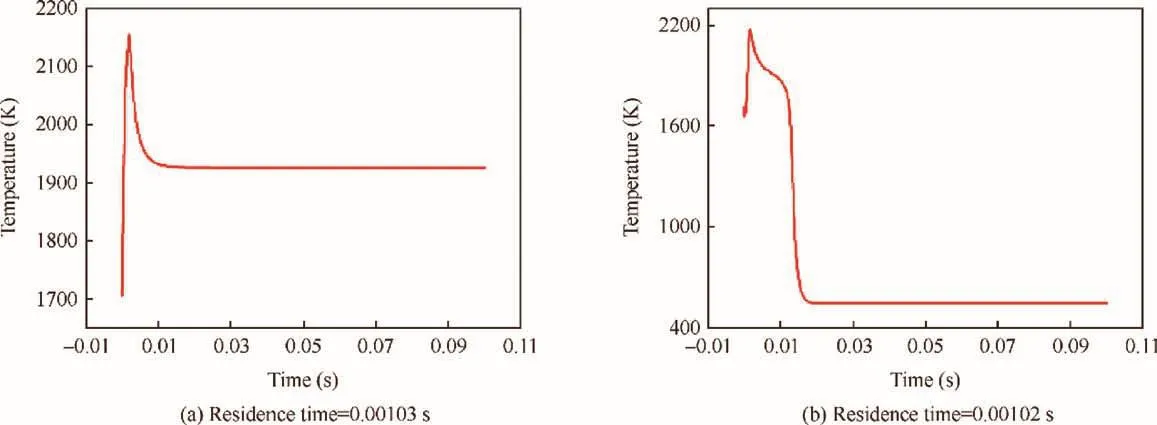
Fig.2 Temperature-time curve obtained by PSR module in CHEMKIN.(Mainlet=0.184,Tinlet=546.15 K,FAR=0.00399).

Fig.3 Test rig.
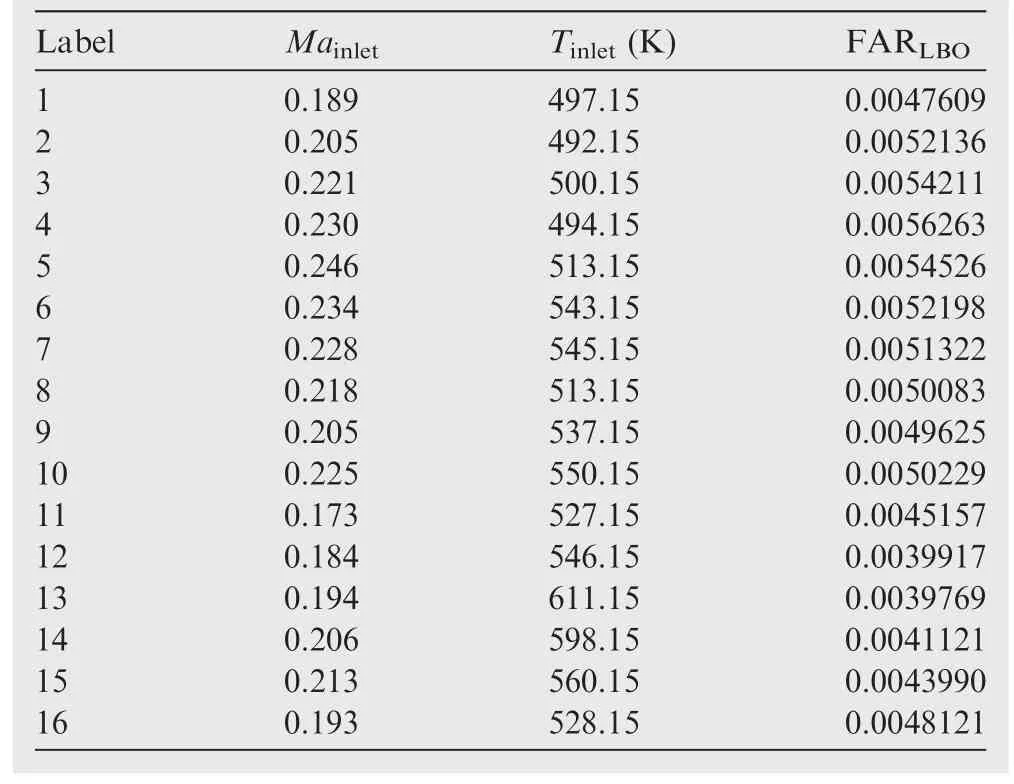
Table 1 Experimental LBO data.
4.Numerical simulation
4.1.Turbulence model
Realizablek-ε model is adapted to simulate turbulent flows.34The model satisfies certain mathematical constraints on the Reynolds stresses to be consistent with the physics of turbulent flows,and could more accurately predict the spreading rate of both planar and round jets.It is also likely to provide superior performance for flows involving rotation and recirculation.
Realizablek-ε model is different from RNGk-ε model and standardk-ε model mainly in turbulent viscosity(μt)calculation and transport equation for the dissipation rate(ε).Inkε models,μt=ρCμk2/ε.In RNGk-ε model and standardk-ε model,Cμis constant,but in realizablek-ε,Cμis a function of the mean strain and rotation rates,the angular velocity of the system rotation,and the turbulence fields(kand ε),as shown in Eq.(1)-(4).

whereA0andAsare empirical constants related with strain rate,and

and

The modeled transport equations forkand ε in the realizablek-ε model are Eqs.(5)and(6).

and

Fig.4 LBO data grouping.

where

ρ denotes density,Gkrepresents the generation of turbulence kinetic energy due to the mean velocity gradients,Gbis the generation of turbulence kinetic energy due to buoyancy,YMdenotes the contribution of the fluctuating dilatation in compressible turbulence to the overall dissipation rate,σkand σεare the turbulent Prandtl numbers forkand ε,C1εandC3εare constants,SkandSεare user-defined source terms.The production term in the ε equation(the second term on the right hand of Eq.(6)does not involve the production ofk.It is believed that the present form better represents the spectral energy transfer.The destruction term(the next to last term on the right-hand side of Eq.(6)does not have any singularity.This is contrasted with traditionalk-ε models.
4.2.Combustion model
Laminar flamelet model is employed in the simulation of combustion.35The flamelet model views the turbulent flame as an ensemble of thin,laminar,locally one-dimensional flamelet structures within the flow field.The governing equations can be simplified to one dimension along the axis of the fuel and oxidizer jets,where complex chemistry calculations can be affordably performed.Mixture fraction theory is applied to non-premixed combustion simulation.A PDF table is generated based on flamelet model.36Temperature and species fraction are functions of mean mixture fraction(f)and mixture fraction variance.fcan be written in term of the atomic mass fraction as

whereZiis the elemental mass fraction for elementi.Sincefis a conserved variable,local equivalence ratio can be conveniently calculated without considering the conversion of fuel to products.
Turbulence-chemistry interaction is modelled by assumed PDF model.As only one type of fuel is included in the present study,β-shaped PDF closure model is adopted.
According to Claramunt et al.'s work,the prediction accuracy of the majority of radicals through flamelet model is acceptable.37Ravikanti et al.employed laminar flamelet model in simulating the flow field of a bluffbody combustor,and the prediction of OH radicals fitted well with the experiment results.38The laminar flamelet model also performed well in Wang et al.'s work in separating the reaction zone based on OH radicals in a primary combustor.The reaction zone obtained in simulation fitted well with the photo taken during the experiment.39
Kundu et al.'s 16 species-23 steps kinetic mechanism is employed in combustion simulation.33The chemical mechanism has been validated by the authors and other researchers.The chemical mechanism was employed by Zhang et al.in the study of radical recombination in a hydrocarbon-fueled scramjet nozzle.40The mechanism was validated by comparing the calculated ignition delay time with the experimental data.The mechanism was also employed by Siow and Yang in 3D analysis of Jet-A combustion.41The calculated CO,CO2and NO emissions fitted well with the experimental data.The mechanism has also been validated by Wang et al.39,42in the calculation of the axial temperature distribution of a swirl stabilized combustor.The calculated value fitted well with the measured one.
4.3.Discrete model
Euler-Lagrange approach method43is employed in the calculation of discrete phase.The dispersed phase is presumed to occupy a small volume fraction,and thus the effects of droplet collisions and break-up are neglected.The dispersed phase can exchange momentum,mass,and energy with the fluid phase.The droplet trajectories are computed individually at specified intervals during the fluid phase calculation.Spherical drag law44is employed for drag coefficient.The injection type is assumed as slim solid cone,with 5°cone angle.The droplet size distribution is assumed uniform with an average diameter of 60 μm.
4.4.Model combustor and boundary conditions
The computational domain of the combustor is shown in Fig.5.The size of the whole combustor and locations of the fuel injecting holes in numerical simulation are the same with those in the experiment.
Second-order upwind spatial discretion is employed in all cases.Standard wall functions are adopted.The hydraulic diameter of the inlet and outlet of the model combustor is 159.375 mm.Kundu et al.'s 16 species-23 steps kinetic mechanism is employed in combustion simulation.33The inlet conditions in numerical simulation are the same with those in experiment.30
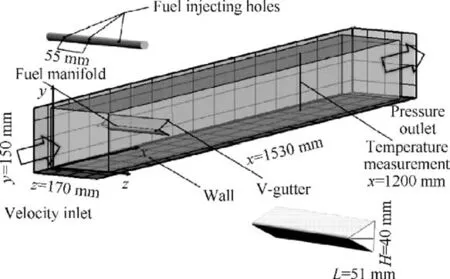
Fig.5 Model combustor and boundary conditions.
4.5.Grid generation
The grids of the flow field are generated by commercial software GAMBIT.As shown in Fig.6,structured grids are generated all over the flow field.The total number of the grids is about 2.65 M.The work of grid dependence check has been done by Wang and Jin in their works.30The grid dependence check was performed with 1.5 M and 3.0 M cells.The results show that 1.5 M cells were enough for the computations.In the current study,2.65 M cells are used to obtain smoother data distributions.
4.6.Validation of numerical methods
The numerical methods employed in this work are validated based on experimental temperature data measured downstream of the bluffbody.
Total temperature is measured under two operating conditions atx=1200 mm(Case 1:Tinlet=537 K,Mainlet=0.16,FAR=0.0048;Case2:Tinlet=523 K,Mainlet=0.155,FAR=0.010).Distributions of simulated and experimental temperature alongydirection atx=1200 mm under the two operating conditions are shown in Fig.7.
The highest temperature appears at the centerline of the combustor,and the temperature profile alongydirection is similar with that in experiments.The error between simulation and experiment is 7.34%in average.In the present study,the accuracy of simulation is acceptable.During the experiment,the liquid fuel accumulated on the upwind surfaces of the bluffbody and formed a liquid film.When the accumulated fuel was blown downstream,the fuel film would undergo the atomization process again.This process cannot be reproduced in simulation,and thus deviation between calculated and measured values is inevitable.
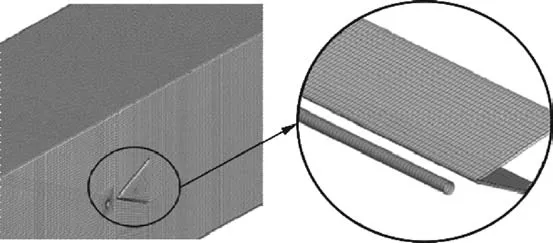
Fig.6 Grids of computational zone.
5.Results and discussion
5.1.Effects of FAR on volume of PRZ
In the present study,the specific value of OH radical concentration on PRZ boundary is determined by comparing the PRZ of simulated reacting flow field and the flame pictures captured by high-speed camera in the experiment30.Currently,it is still difficult to quantitatively compare the OH concentration obtained by PLIF and numerical simulation in the entire flow field.Qualitative comparison is employed in the work.Khalil et al.pointed out that the distribution of OH radicals could be used to characterize PRZ,but the OH radicals occupy a large portion of the combustor for non-premixed mode,and it is not reasonable to define all the zone where OH exists as PRZ.45Stöhr et al.also pointed out that the medium and low levels of OH may represent burned gas whose OH concentration has decayed while it was transported away from the PRZ.29In Cavaliere et al.'s work,32the behavior of PRZ was also reflected by high-OH zone rather than all the zone where OH radicals exist.Hence,a specific value of OH concentration on PRZ boundary should be determined in the current study.For the present work,the boundary value is obtained by comparing the OH concentration field with the photos of the PRZ,30and the value of 0.01 mole/m3is considered to be proper to describe the flame behavior.Fig.8 shows PRZ obtained by simulation and experiments.By comparing Fig.8(a)and(b),it can be concluded that the size and shape of PRZ in simulated flow field fit well with the photograph(inlet condition:Tinlet=537 K,Mainlet=0.16,FAR=0.0048).As the fuel is injected in the reverse direction of the incoming air flow,the fuel/air mixing is extremely nonuniform.Much fuel is gathered at the surface of the bluffbody.Under the effect of aerodynamic force,fuel drops migrate to the trailing edges of the bluffbody,and then flow into the shear layer downstream.
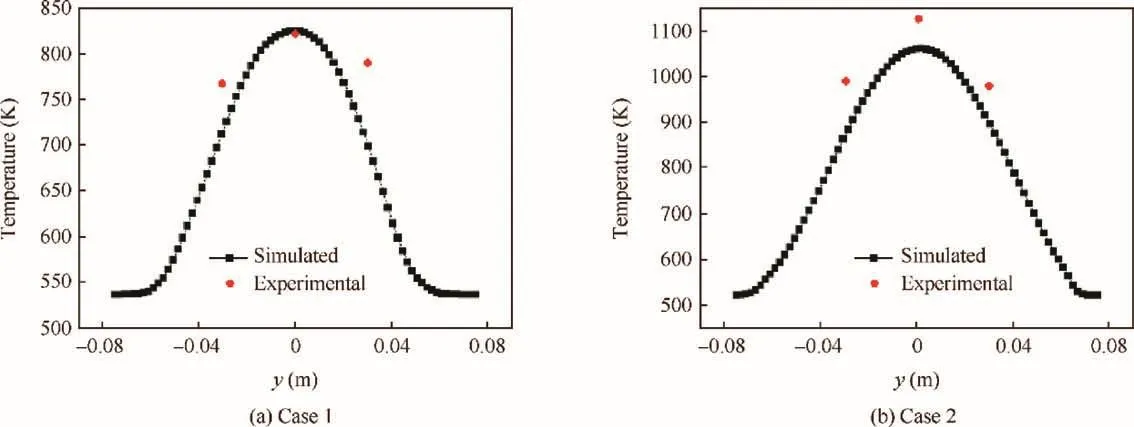
Fig.7 Simulated and experimental temperature along y direction at x=1200 mm.
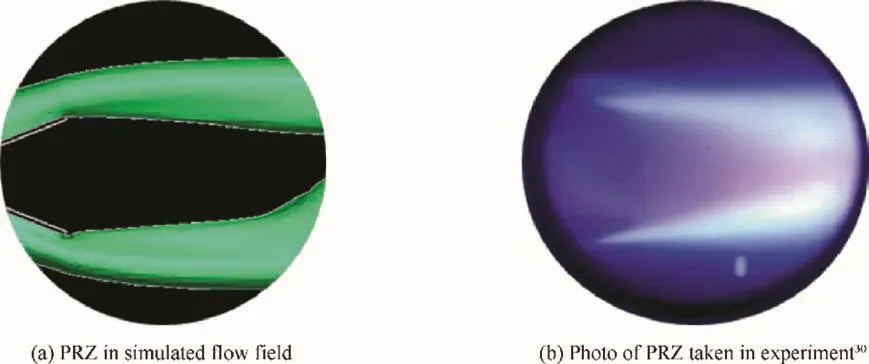
Fig.8 PRZ obtained by simulation and experiment.

Fig.9 3D description of PRZ under different FAR.
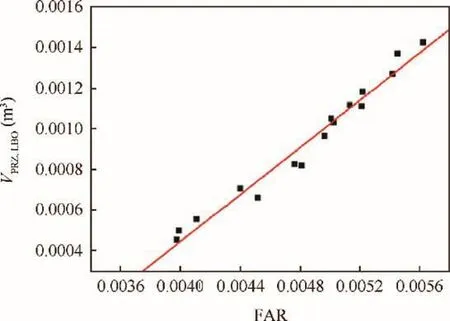
Fig.10 Variation of VPRZ,LBOwith FARLBO.
Fig.9 shows the 3D description of PRZ under different FAR.The axial length of PRZ increases rapidly with the increase of PRZ.Because PRZ is limited by combustor in radial direction,with the increase of fuel supply,the cross section area of PRZ changes little,and the increase of volume of Practical Reaction Zone(VPRZ)is mainly embodied in the increase of its axial length.As shown in Fig.9(e),when FAR is high,PRZ even extends out of the combustor.
Fig.10 shows the variation ofVPRZ,LBOwith FARLBO.Fig.10 shows thatVPRZ,LBOincreases with the increase of FARLBO.Because the fuel mass flow rates set in numerical simulation are obtained from experiments,larger FARLBOwill cause larger fuel flow rate at LBO,and then enlargeVPRZ,LBO.The data points ofVPRZare fitted by a straight line.It should be noted in Fig.10 that with the continuative decrease of FAR along the fitting line,a minimum FARLBOcan be obtained as 0.0037 whenVPRZ,LBOinfinitely approximates 0.This value may be the minimum FARLBOof the current combustor style.Similar results are also obtained as FARLBO=0.002523and FARLBO=0.00342by Bin Hu et al.,which is a little lower than that in the paper due to the better fuel/air mixing in swirling flows.Owing to the lack of sufficient experimental data,the minimum FARLBOis only a conjecture and cannot be verified in the present work.It may be used as an estimated value for engineers in combustor designs.
5.2.Effects of Mainleton time scales of PRZ
Effect ofMainleton the Volume of PRZ(VPRZ,LBO)under different LBO conditions is shown in Fig.11.Fig.11 shows thatVPRZ,LBOincreases with the increase ofMainlet.On one hand,fuel supply increases due to the deteriorated LBO performance caused by the increase ofMainlet.On the other hand,whenMainletincreases,the turbulence exchange rate in the shear layer downstream of the bluffbody increases,and then the distribution of fuel is more uniform,which leads to more complete combustion.Hence,VPRZ,LBOincreases with the increase ofMainlet..
Effect ofMainleton the volume-averaged equivalence ratio of PRZ under different LBO conditions(ΦPRZ,LBO)is shown in Fig.12.In the paper,ΦPRZ,LBOis obtained by Eq.(11),whereris the air/fuel ratio on a mass basis at stoichiometric ratio.

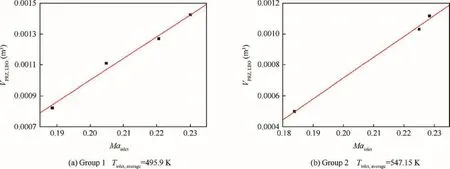
Fig.11 Effect of Mainleton VPRZ,LBO.
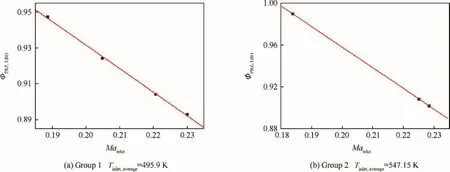
Fig.12 Effects of Mainleton ΦPRZ,LBO.
Fig.12 shows that ΦPRZ,LBOdecreases with the increase ofMainlet..Generally speaking,the global fuel/air ratio of LBO will increase with the increase ofMainlet,and then ΦPRZ,LBOshould also increase since PRZ is a local region of entire flow field.The results shown in Fig.12 go against the authors' conjecture,which may be attributed to the non-uniform fuel distribution.Fig.13 shows the mixture fraction distribution within PRZ under differentMainlet.In Fig.13,the white area closed to the upwind surface of bluffbody is the extreme-fuel-rich region where the reaction cannot be triggered,and it is caused by the gather of fuel at the upwind surface of bluffbody.Fig.13 shows that with the increase of FAR,the white area grows and extends deeper into PRZ,which causes that the high-mixture fraction-zone in PRZ decreases.In addition,the low-mixture fraction-zone increases gradually with the increase ofMainlet.Hence,ΦPRZ,LBOdecreases with the increase ofMainlet.
Effect ofMainletonTPRZ,LBOis shown in Fig.14.Fig.14 shows thatTPRZ,LBOincreases with the increase ofMainlet.It is found that the variation of temperature shown in Fig.14 is not consistent with the variation of equivalence ratio in Fig.12.According to Fig.12,TPRZ,LBOshould increase for the increase of fuel concentration in PRZ.This may be attributed to the enhanced turbulence mixing in PRZ.The detailed information can be illustrated in Fig.15.Fig.15 shows the variation of high temperature zone and PRZ with the increase ofMainlet.The specific value of 1800 K is assigned to qualitatively characterize the high temperature zone in PRZ.PRZ is colored green,and high temperature zone is colored red.The fraction of PRZ overlapped by high temperature zone under each condition is given below the corresponding picture.From Fig.15,it can be seen that the percentage of PRZ overlapped by high temperature zone increases(from 9.18%to 23.95%)with the increase ofMainlet(ranging from 0.189 to 0.230).Therefore,a conclusion can be drawn that the increase ofMainletactually enhances the stirring strength in PRZ,and leads to the increase ofTPRZ,LBO.
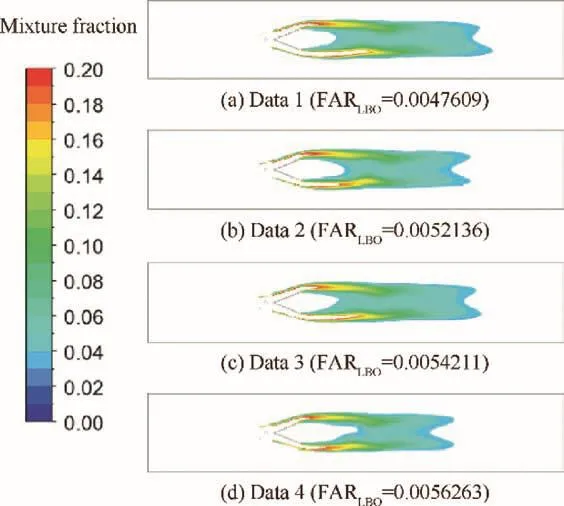
Fig.13 Mixture fraction contour within PRZ under different Mainlet.
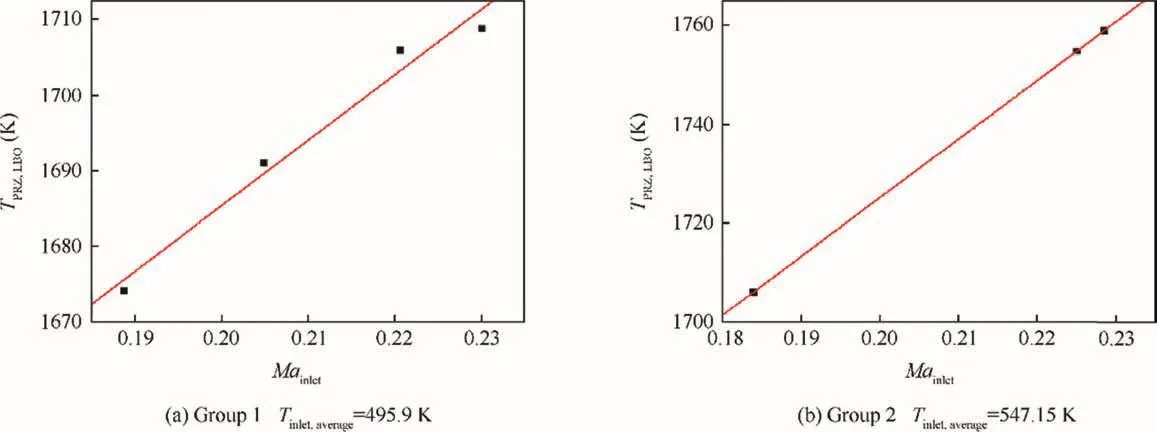
Fig.14 Effects of Mainleton TPRZ,LBO.

Fig.15 3D description of PRZ and high temperature zone under different Mainlet.
Effects ofMainleton volume-averaged pressure of PRZ under different LBO conditions(PPRZ,LBO)are shown in Fig.16.Corresponding total pressure loss coefficient(σ)is marked near each data point.Fig.16 shows thatPPRZ,LBOslightly decreases with the increase ofMainlet,and σ increases for the increase ofMainlet.With constant inlet static pressure(1 atm),the increase of total pressure loss will surely lead to the decrease of static pressure downstream of the bluffbody,and then lead to the decrease ofPPRZ,LBO.It can also be seen in Fig.16 thatPPRZ,LBOdoes not change much.In group 1,whenMainletincreases from 0.189 to 0.230,PPRZ,LBOonly decreases by 1.90%.In group 2,whenMainletincreases from 0.184 to 0.228,PPRZ,LBOonly decreases by 1.85%.
Effects ofMainleton flow time scale under different LBO conditions(τf,LBO)are shown in Fig.17.Fig.17 shows that τf,LBOincreases with the increase ofMainlet.From Fig.9 it can be observed that the variation ofVPRZ,LBOis mainly embodied in axial direction.With the increase ofMainlet,the axial length of PRZ increases.In addition,Mainlethas little effect on volume-averaged axial velocity of PRZ due to the partial recirculation in PRZ.Therefore,τf,LBOincreases with the increase ofMainlet.
Effects ofMainleton chemical time scale under different LBO conditions(τc,LBO)are shown in Fig.18.Fig.18 shows that τc,LBOincreases with the increase ofMainlet.It is shown in Fig.12 and Fig.14 that ΦPRZ,LBOdecreases with the increase ofMainletandTPRZ,LBOincreases with the increase ofMainlet.τc,LBOis mainly affected by these two parameters which have different effects on τc,LBO.It can be seen in Fig.14 that the variation ofTPRZ,LBOis less than 60 K,andTPRZ,LBOis higher than 1670 K.The maximum relative increment ofTPRZ,LBOin group 1 and group 2 is 2.07%.Considering that the variation ofTPRZ,LBOis relatively small,τc,LBOis mainly affected by ΦPRZ,LBOin the paper.Hence τc,LBOincreases with the increase ofMainlet.
5.3.Effects of Tinleton time scales of PRZ
Effects ofTinletonVPRZ,LBOare shown in Fig.19.Fig.19 shows thatVPRZ,LBOdecreases with the increase ofTinlet.LBO limit is extended for the increase ofTinlet.Therefore,fuel concentration in the combustor decreases due to the reduction ofmf(fuel mass flow rate).Hence,VPRZ,LBOdecreases with the increase ofTinletfor the shrinkage of PRZ.
Effects ofTinleton ΦPRZ,LBOare shown in Fig.20.ΦPRZ,LBOincreases with the increase ofTinlet.In general,the increase ofTinletextends the LBO limit,and then the global equivalence ratio in the combustor should decrease.However,it is shown in Fig.20 that the effects ofTinleton ΦPRZ,LBOincrease with the increase ofTinlet.The reason for this can be illustrated clearly in Fig.21.With the increase ofTinlet,the fuel/air ratio gradually decreases as expected,and then the low-mixture fraction-zone decreases.Meanwhile,the extreme-fuel richarea close to the surface of the bluffbody decreases because of the better fuel evaporation and more complete combustion.Hence,ΦPRZ,LBOincreases with the increase ofTinlet.
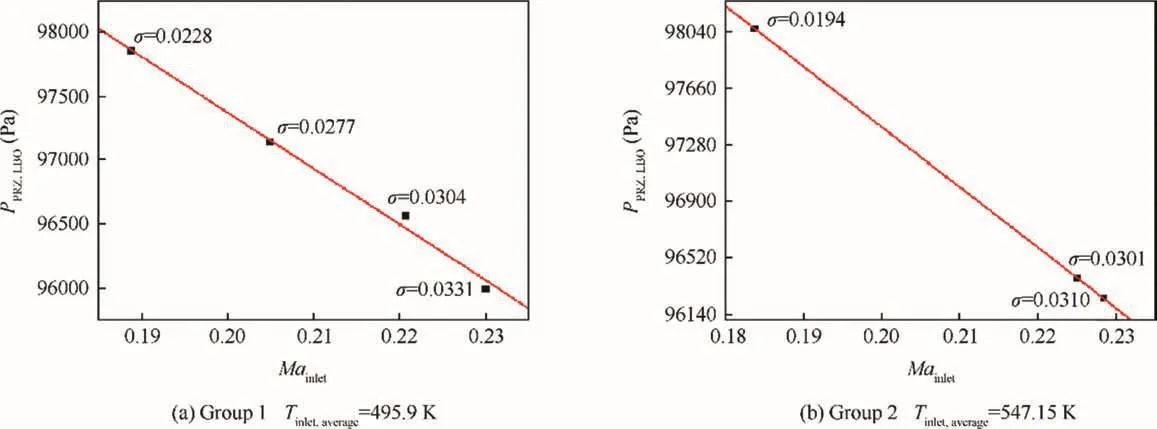
Fig.16 Effects of Mainleton PPRZ,LBO.
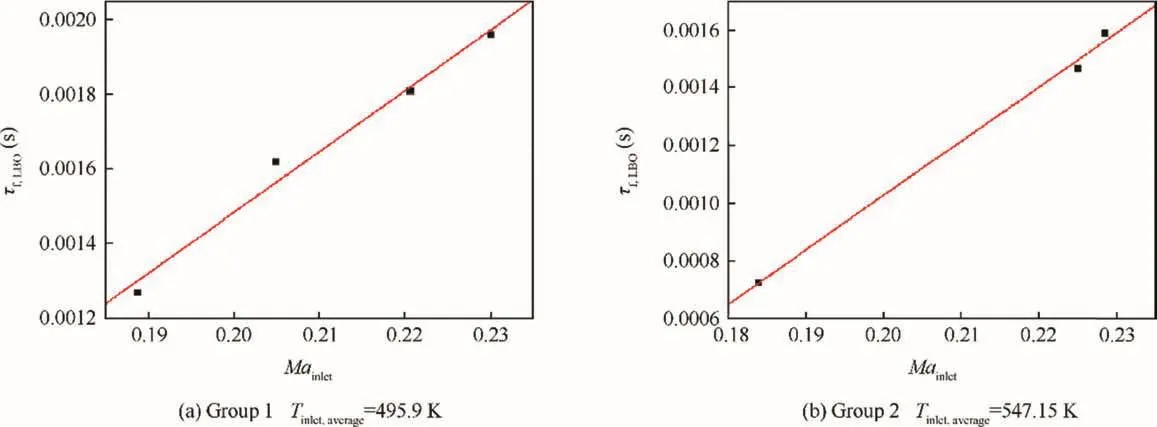
Fig.17 Effects of Mainleton τf,LBO.
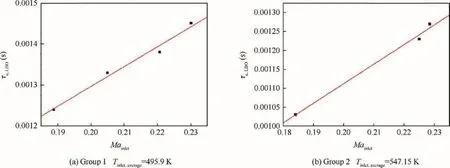
Fig.18 Effects of Mainleton τc,LBO.
Effects ofTinletonTPRZ,LBOare shown in Fig.22.TPRZ,LBOincreases with the increase ofTinlet.The increase ofTinletis good for complete evaporation and combustion of fuel.The reaction process can also be promoted by the increase ofTinlet.Compared with the volume high temperature zone,with the increase ofTinlet,the volume of Practical Reaction Zone decreases faster since it is directly affected by the fuel concentration in the combustor(Fig.23).The high temperature zone is characterized by the specific temperature 1800 K,and it can be seen that almost all the high temperature zone is coated by PRZ.Volume fraction of high temperature zone in PRZ increases from 21.33%to 21.53%.If the boundary of the high temperature zone is adjusted to 1600 K,volume fraction of high temperature zone in PRZ increases from 67.33%to 70.66%,the increasing trend becomes more obvious,and henceTPRZ,LBOincreases with the increase ofTinlet.
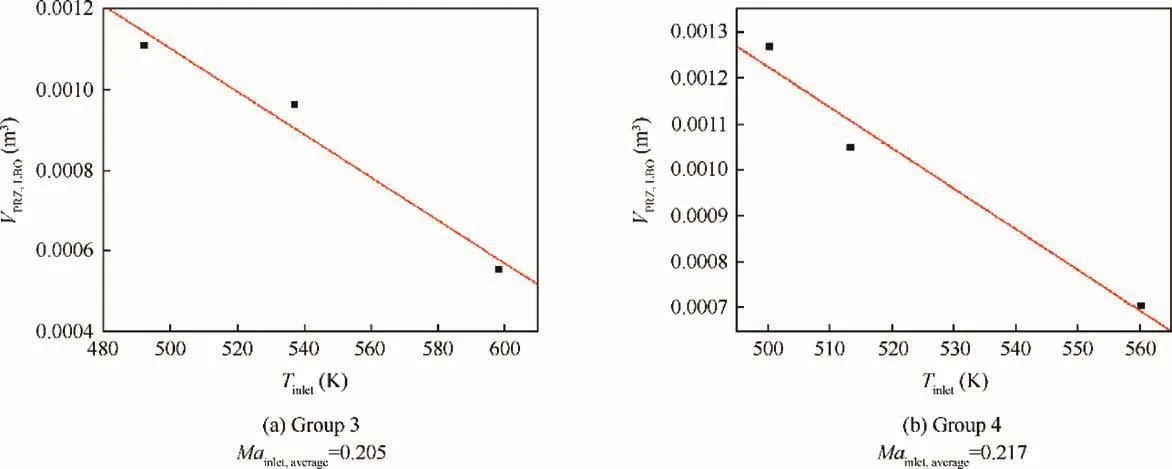
Fig.19 Effects of Tinleton VPRZ,LBO.
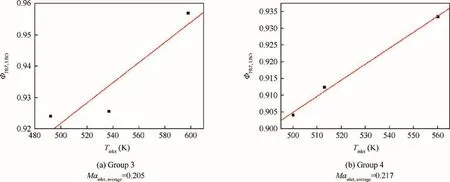
Fig.20 Effects of Tinleton ΦPRZ,LBO.
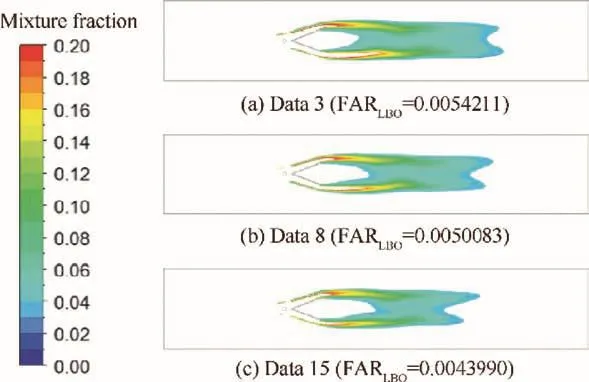
Fig.21 Mixture fraction contour within PRZ under different Tinlet.
Effects ofTinletonPPRZ,LBOare shown in Fig.24.Similar to Fig.16,the value of σ near the data points is the total pressure loss coefficient.It is shown in Fig.24 thatPPRZ,LBOincreases with the increase ofTinlet,and σ decreases with the increase ofTinlet.The global temperature rise in the combustor decreases for the decrease of fuel supply,and thus the pressure loss caused by combustion decreases,which leads to the reduction of the total pressure loss σ.With constant inlet static pressure(1 atm),PPRZ,LBOincreases slightly with the increase ofTinlet.It should be noted thatPPRZ,LBOis not changed much.In group 3,whenTinletincreases from 492.15 K to 611.15 K,PPRZ,LBOonly increases by 0.58%.In group 4,whenTinletincreases from 500.15 K to 560.15 K,PPRZ,LBOonly increases by 0.39%.
Effects ofTinleton τf,LBOare shown in Fig.25.Fig.25 shows that τf,LBOdecreases with the increase ofTinlet.According to Fig.19,the increase ofTinletwill decrease the volume of PRZ.The effects of the gas expansion caused by the increase ofTinleton the volume-averaged axial velocity(v)are little due to the partial recirculation contained in PRZ.Therefore,τf,LBOdecreases with the increase ofTinlet.
Effects ofTinleton τc,LBOare shown in Fig.26.Fig.26 shows that τc,LBOdecreases with the increase ofTinlet.According to Fig.20 and Fig.22,ΦPRZ,LBOandTPRZ,LBOboth increase with the increase ofTinlet.The reaction is thus easier to be triggered,and τc,LBOis reduced.
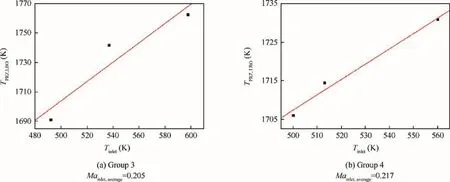
Fig.22 Effects of Tinleton TPRZ,LBO.
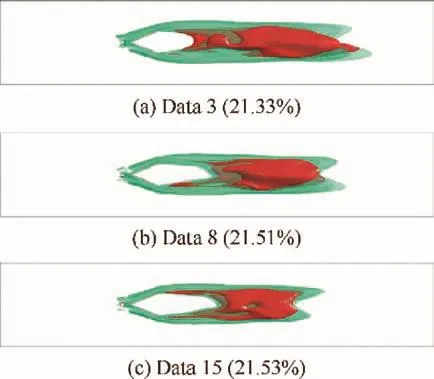
Fig.23 3D description of PRZ and high temperature zone under different Tinlet.
5.4.Da numbers comparison
Danumbers under all 16 LBO conditions are shown in Fig.27.The average value of theDanumbers is 1.135,the maximum is 1.351 and the minimum is 0.673.The results show that the flow time scale and the chemical time scale are comparable,indicating a critical state of LBO.In this state, flames are extremely unstable.If there is an abnormal perturbation in the incoming flow upstream,LBO is very likely to happen.The reason for the fluctuation ofDanumbers may be attributed to the difference between heterogeneous scalar distribution in PRZ and homogeneous hypothesis in the PSR module of CHEMKIN.
The variation ofDanumber with different FAR underTinlet=497.15 andMainlet=0.18869 is shown in Fig.28.Fig.28 shows thatDanumber increases in an exponential way with the increase of FAR.The increase of FAR directly increases the fuel concentration in the combustor,and PRZ is expanded accordingly.Hence,τfincreases with the increase of FAR.In addition,the increase of fuel concentration also leads to an intensive reaction,which reduces the chemical time substantially.For the reasons discussed above,Danumber increases rapidly with the increase of FAR.
The work presented here provides combustor designers with a practical tool that links theDamodel and simulated reacting flow together.Relevant work will be continued and focus more on the following aspects:1)The minimum FARLBOis observed in the present study.The result may be related to the property of the fuel and the configuration of the combustor.In the future,the minimum FARLBOof different combustors may be studied.2)The fuel distribution in the combustor is non-uniform,but chemical time scales are obtained by the zero-dimensional reactor PSR in CHEMKIN.The effects of heterogeneity will be considered by building a reactor net within PRZ in future works.
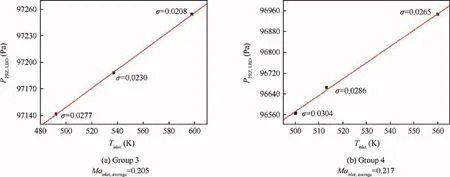
Fig.24 Effects of Tinleton PPRZ,LBO.
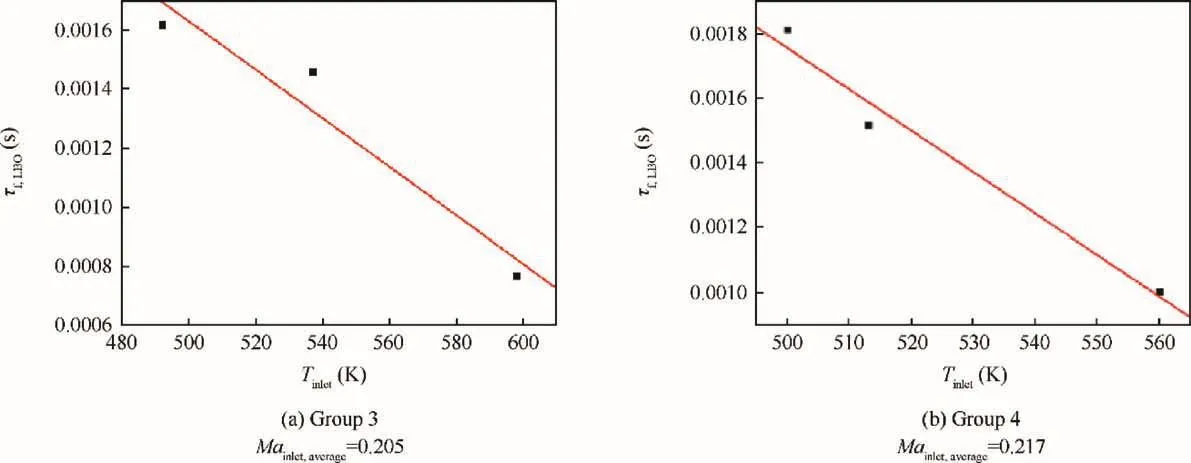
Fig.25 Effects of Tinleton τf,LBO.
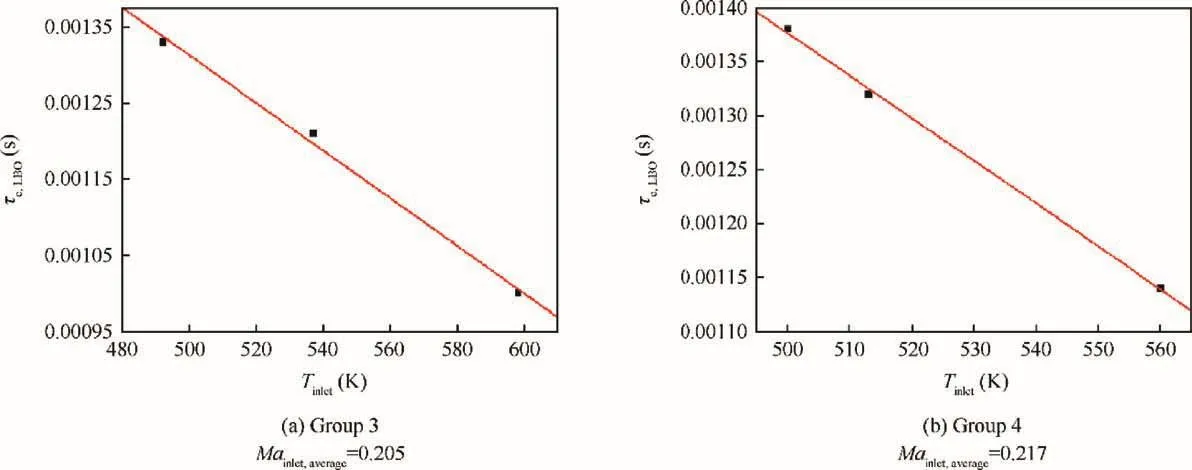
Fig.26 Effects of Tinleton τc,LBO.
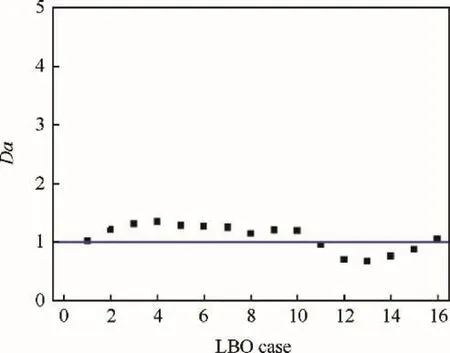
Fig.27 Da numbers under 16 LBO conditions.
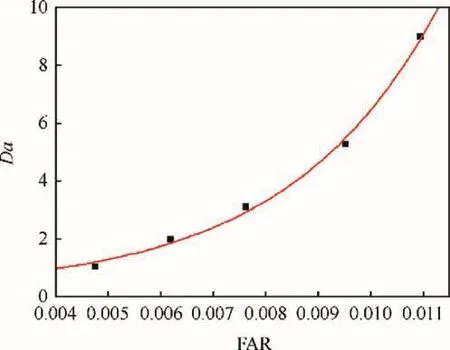
Fig.28 Relationship between Da and FAR.
6.Conclusions
In the present study,a hybrid LBO prediction method combining numerical simulation andDamodel is proposed based on bluffbody stabilized flames.Some important conclusions are obtained as follows:
(1)Practical Reaction Zone(PRZ)is built based on concentration of OH radicals in the simulated flow field of the combustor.Flow time scales(τf)are calculated based onVPRZand the volume-averaged axial velocity of PRZ.Chemical time scales(τc)are calculated based on volume-averaged temperature,pressure and equivalence ratio of PRZ.
(2)τfincreases with the increase ofMainlet,but decreases with the increase ofTinlet.τcincreases with the increase ofMainlet,but decreases with the increase ofTinlet.τfis mainly determined byVPRZ,and τcis determined byTPRZand ΦPRZ.
(3)The average value ofDanumber under LBO conditions is 1.135,andDanumber under each LBO condition ranges from 0.673 to 1.351.Under LBO conditions,the flow time scale and chemical time scale are comparable,which indicates a critical state of combustion.
(4)Danumber increases in an exponential way when fuel/air ratio of inlet flow increases,showing that flames become stable when the fuel supply increases.
Acknowledgements
This work has been carried out with the supports of National Key Research and Development Program of China(No.2016YFB0901402)and National Natural Science Foundation of China(No.51476170).
杂志排行
CHINESE JOURNAL OF AERONAUTICS的其它文章
- A review of chatter vibration research in milling
- Impact of reduced frequency on the time lag in pressure distribution over a supercritical airfoil in a pitch-pause-return motion
- Thermal state calculation of chamber in small thrust liquid rocket engine for steady state pulsed mode
- Sliding mode control design for oblique wing aircraft in wing skewing process
- Adaptive optimization methodology based on Kriging modeling and a trust region method
- Aircraft engine fault detection based on grouped convolutional denoising autoencoders
