Body-mass index correlates with severity and mortality in acute pancreatitis: A meta-analysis
2019-02-21DalmaDobszaitertraiZoltGyngyiDezsCsuporJuditBajorlintErssAlexandraMikLajosSzakgnesMeczkerRolandgendornKatalinrtaAndreaSzentesiterHegyionbehalfoftheHungarianPancreaticStudyGroup
Dalma Dobszai, Péter Mátrai, Zoltán Gyöngyi, Dezső Csupor, Judit Bajor, Bálint Erőss, Alexandra Mikó,Lajos Szakó, Ágnes Meczker, Roland Hágendorn, Katalin Márta, Andrea Szentesi, Péter Hegyi,on behalf of the Hungarian Pancreatic Study Group
Abstract BACKGROUND Obesity rates have increased sharply in recent decades. As there is a growing number of cases in which acute pancreatitis (AP) is accompanied by obesity, we found it clinically relevant to investigate how body-mass index (BMI) affects the outcome of the disease.AIM To quantify the association between subgroups of BMI and the severity and mortality of AP.METHODS A meta-analysis was performed using the Preferred Reporting Items for Systematic Review and Meta-Analysis (PRISMA) Protocols. Three databases(PubMed, EMBASE and the Cochrane Library) were searched for articles containing data on BMI, disease severity and mortality rate for AP. Englishlanguage studies from inception to 19 June 2017 were checked against our predetermined eligibility criteria. The included articles reported all AP cases with no restriction on the etiology of the disease. Only studies that classified AP cases according to the Atlanta Criteria were involved in the severity analyses. Odds ratios (OR) and mean differences (MD) were pooled using the random effects model with the DerSimonian-Laird estimation and displayed on forest plots. The meta-analysis was registered in PROSPERO under number CRD42017077890.RESULTS A total of 19 articles were included in our meta-analysis containing data on 9997 patients. As regards severity, a subgroup analysis showed a direct association between AP severity and BMI. BMI < 18.5 had no significant effect on severity;however, BMI > 25 had an almost three-fold increased risk for severe AP in comparison to normal BMI (OR = 2.87, 95%CI: 1.90-4.35, P < 0 .001). Importantly,the mean BMI of patients with severe AP is higher than that of the non-severe group (MD = 1.79, 95%CI: 0.89-2.70, P < 0.001). As regards mortality, death rates among AP patients are the highest in the underweight and obese subgroups. A BMI < 18.5 carries an almost two-fold increase in risk of mortality compared to normal BMI (OR = 1.82, 95%CI: 1.32-2.50, P < 0.001). However, the chance of mortality is almost equal in the normal BMI and BMI 25-30 subgroups. A BMI >30 results in a three times higher risk of mortality in comparison to a BMI < 30(OR = 2.89, 95%CI: 1.10-7.36, P = 0.026).CONCLUSION Our findings confirm that a BMI above 25 increases the risk of severe AP, while a BMI > 30 raises the risk of mortality. A BMI < 18.5 carries an almost two times higher risk of mortality in AP.
Key words: Acute pancreatitis; Body-mass index; Obesity; Severity; Mortality;Prognostic; Meta-analysis
INTRODUCTON
Obesity is one of the dominant public health concerns worldwide. It is a major risk factor for various diseases such as diabetes, cardiovascular disease, some cancers,kidney disease, obstructive sleep apnea, gout, osteoarthritis, and hepatobiliary disease[1]. The increasing prevalence of obesity (Figures 1 and 2)[2]also places a huge financial burden on national healthcare systems: according to a review published in 2010, obesity alone accounts for between 0.7% and 2.8% of total healthcare expenditures, while costs associated with a body-mass index (BMI) ≥ 25 reach as high as 9.1% of total spending on medical care[3].
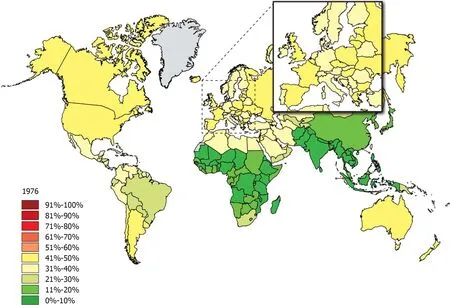
Figure 1 The rate of individuals with a body-mass index ≥ 25 among adults in 1976. Source: Global Health Observatory data repository http://apps.who.int/gho/data/node.main.A897A?lang=en.
The most common method for measuring obesity is BMI, which is calculated from a person’s weight in kilograms and height in meters (kg/m2). BMI is divided into five categories according to the World Health Organization (WHO) classification:underweight (< 18.5 kg/m2), normal weight (18.5-24.9 kg/m2), overweight (25-29.9 kg/m2), obese class I (30-34.9 kg/m2), obese class II (35-39.9 kg/m2) and obese class III(≥ 40 kg/m2)[4].
Among various other diseases, there is an increasing number of clinical cases in which acute pancreatitis (AP) is also accompanied by high BMI. Characterized by high mortality, AP is the most frequent cause of acute hospitalization among all gastrointestinal disorders with a prevalence of 10-100/100000 cases worldwide[5]. The B5 point of the IAP/APA evidence-based guidelines highlights the importance of predicting the primary endpoints of AP, namely severity and mortality, therefore, we found it crucially important to investigate how obesity affects the outcome of the disease[6]. Numerous studies have also linked severe acute pancreatitis (SAP) with obesity. The majority of the clinical trials conducted with the aim of determining the sensitivity and specificity of the predictive score systems of AP with the obesity factor added to it resulted in greater diagnostic accuracy[7-9].
Despite the fact that there is evidence of high BMI exacerbating AP, there has been a lack of structured and completed analyses. Until now, four meta-analyses have been performed to investigate the prognostic role of BMI in AP; however, none of them (1)analyzed all five WHO BMI categories, (2) compared the normal BMI group to every other subgroup, (3) investigated the effect of underweight on AP outcome or (4)suggested cut-off values[10-13]. The last meta-analysis on this topic was conducted in 2011, so our update involves new articles published during the last six years, leading to a remarkably higher patient number than before.
MATERIALS AND METHODS
Literature search
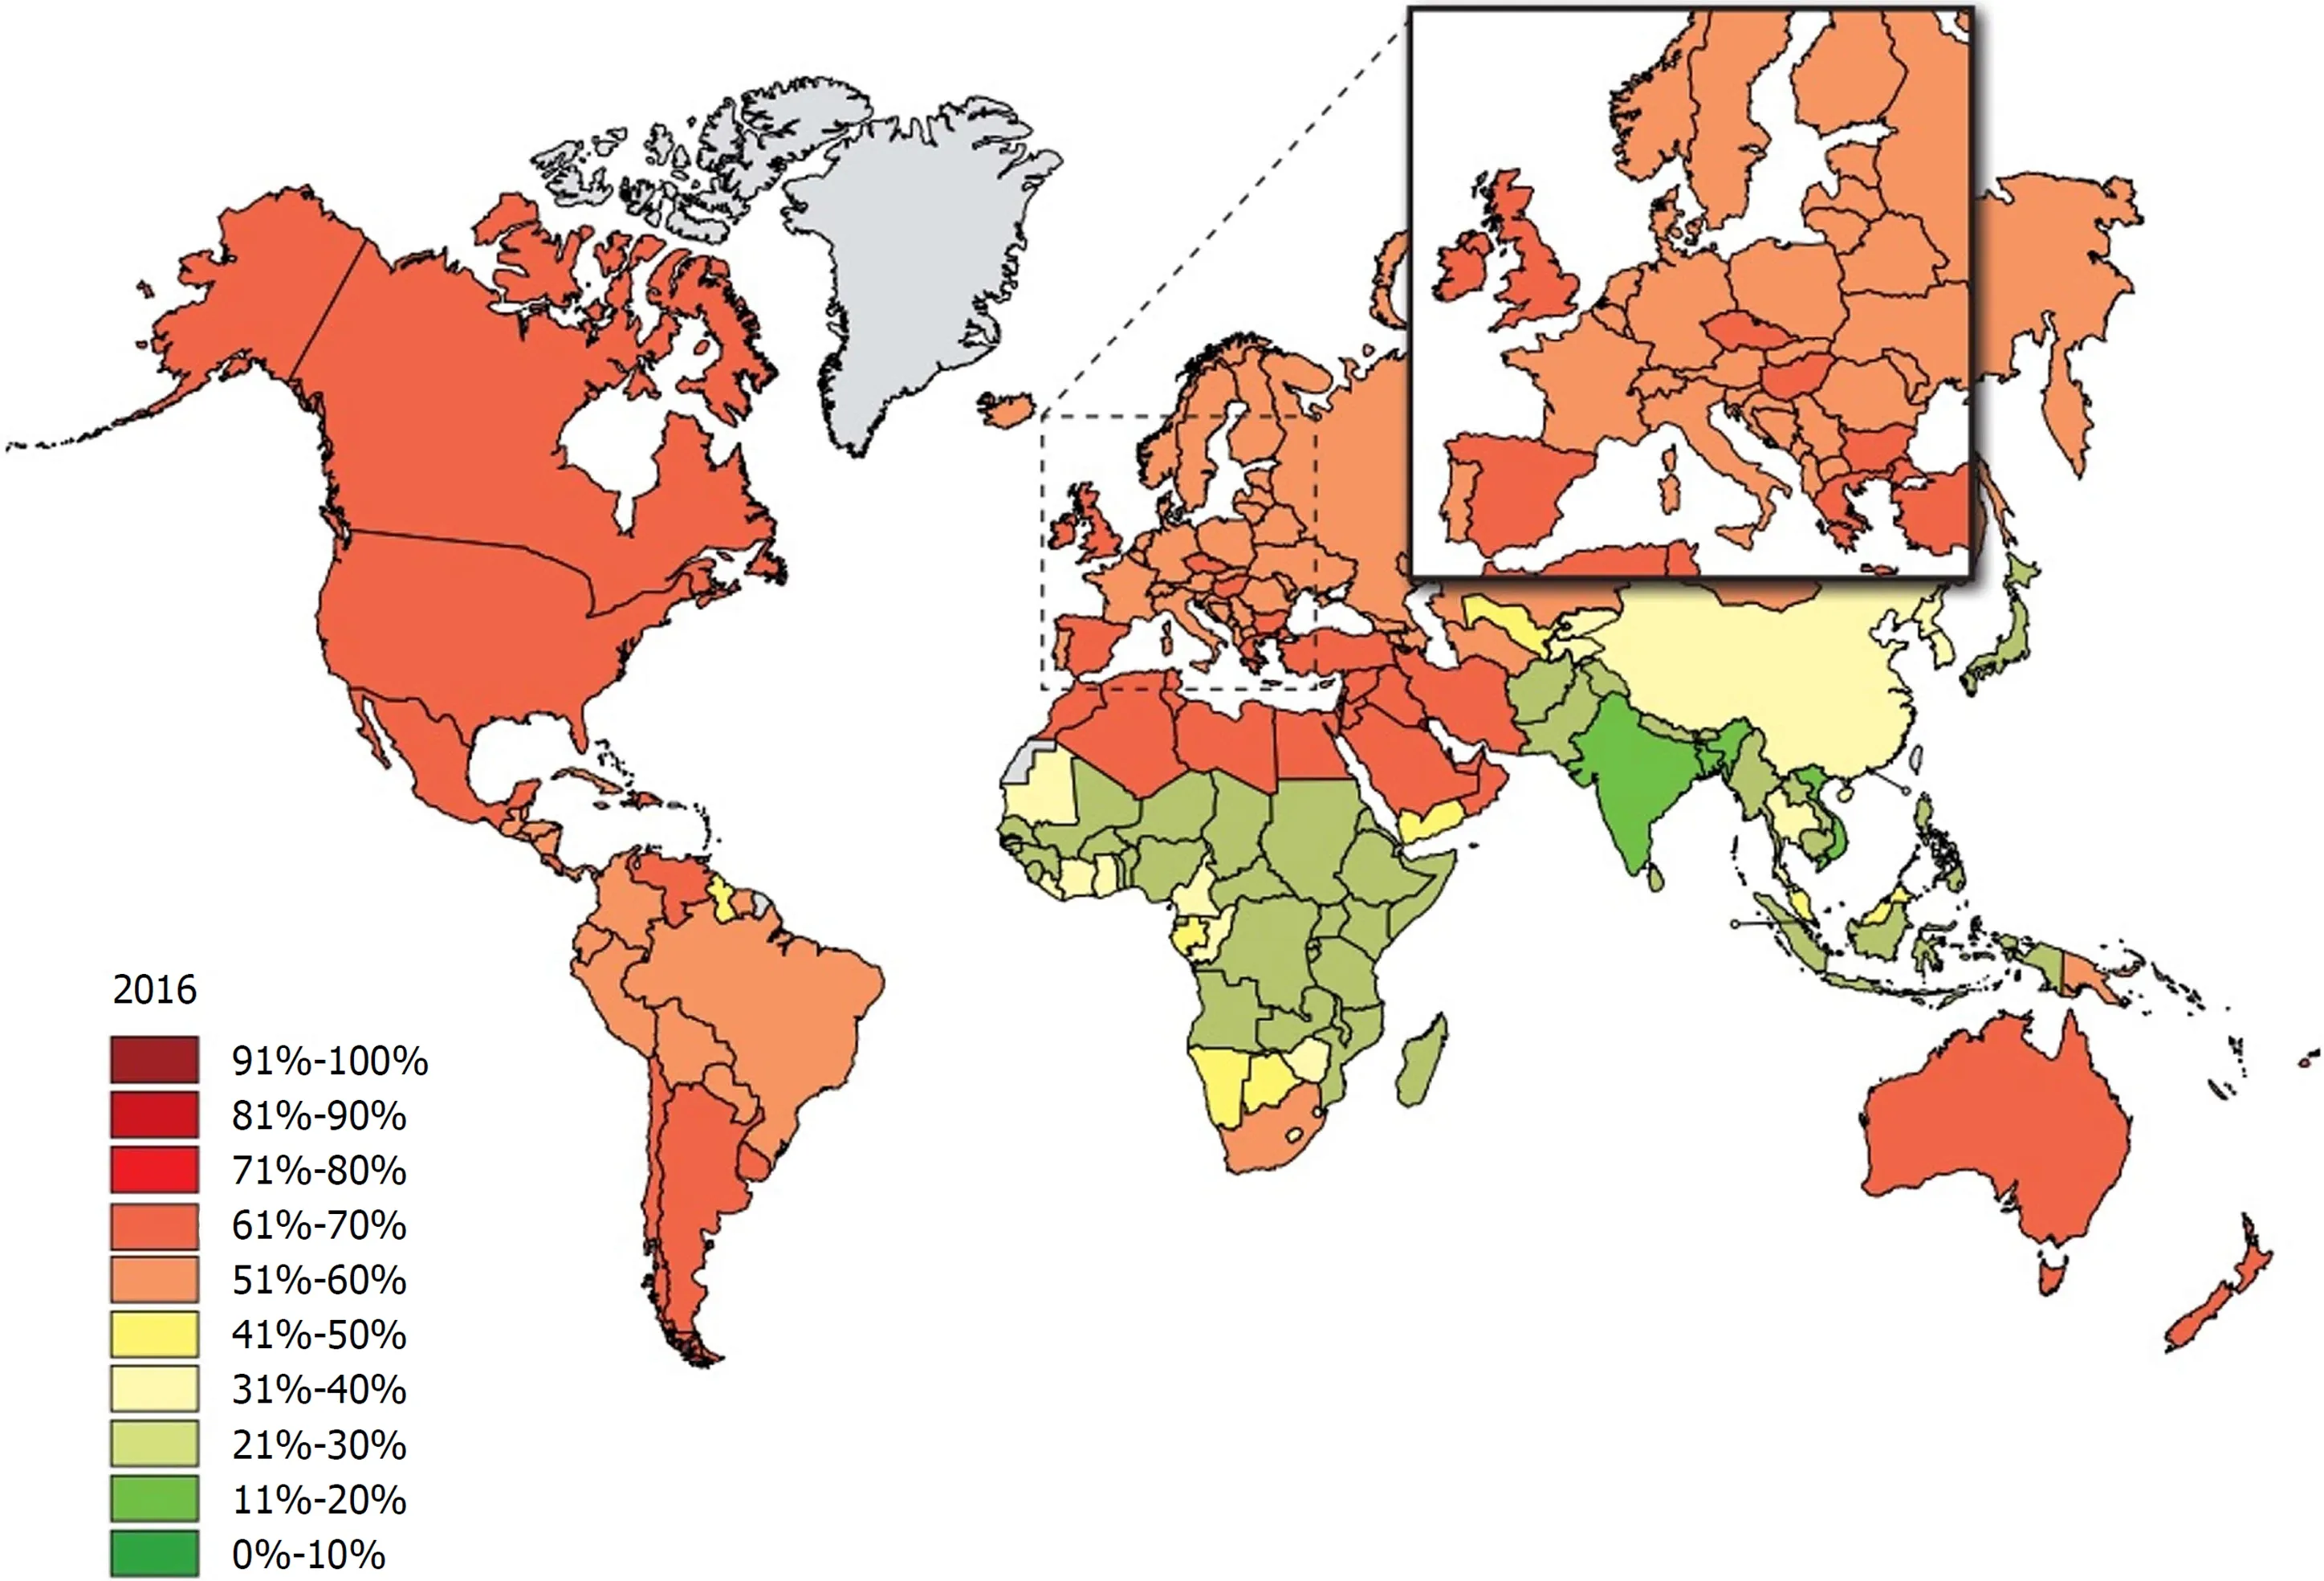
Figure 2 The rate of individuals with a body-mass index ≥ 25 among adults 40 years later in 2016. Source: Global Health Observatory data repository(http://apps.who.int/gho/data/node.main.A897A?lang=en).
This meta-analysis was conducted following the guidelines proposed by the PRISMA Statement[14]. The protocol was previously registered on PROSPERO under CRD42017077890. A systematic search of the medical literature was performed using PubMed, EMBASE and the Cochrane Library. In all the databases, the following keywords were used for the search: acute pancreatitis AND BMI AND (severity OR mortality). Results were imported into reference manager software (EndNote X7.5).The reference lists in the articles were also checked to capture all relevant articles published within our topic of interest. The last literature search in the same databases was completed on 22ndDecember 2017. The details of these literature searches are included in the Supporting Material. We adapted the PICO format to set the inclusion criteria. Our PICO items were the following: (P) patients with AP, (I) low/high BMI,(C) normal BMI, and (O) severity and mortality of pancreatitis. Besides these two major endpoints of AP, we also collected data on the length of hospitalization and local or systemic complications for the purpose of analysis.
Study selection
Two of the authors independently checked whole texts with figures and tables against our predetermined eligibility criteria. During the selection process, meta-analyses,reviews, case reports and abstracts with inadequate data were excluded. Articles were declared eligible if the study enrolled all AP patients with no restriction on one specific etiology. In the severity analysis, we only included studies in which the original[15]or the revised[16]version of the Atlanta Criteria were used to determine the severity of AP. However, in the analysis of the effect of BMI on mortality, the use of the Atlanta Classification was not a criterion.
Data extraction
Review authors entered the following main data from the eligible articles (Table 1) on an Excel sheet: (1) First author, year of publication, country; (2) Study type; (3) Group of enrolled patients; (4) BMI subgroups and sample sizes; (5) Method used to define disease severity; (6) Mean BMI; (7) Number of severe cases and mortality; (8) Mean length of hospitalization and mean Intensive Care Unit stay in days; (9) Mean or median severity scores: Acute Physiology and Chronic Health Disease Classification System II (APACHE II) and Ranson’s score; and (10) Number of cases with necrosis development. Discrepancies were resolved by consensus.
Risk of bias
Risk of bias assessment was carried out according to a modified version of the Newcastle-Ottawa Scale (NOS) to rate the internal validity of the individual studies,and funnel plots were constructed to assess the risk of publication bias (Supporting Material).
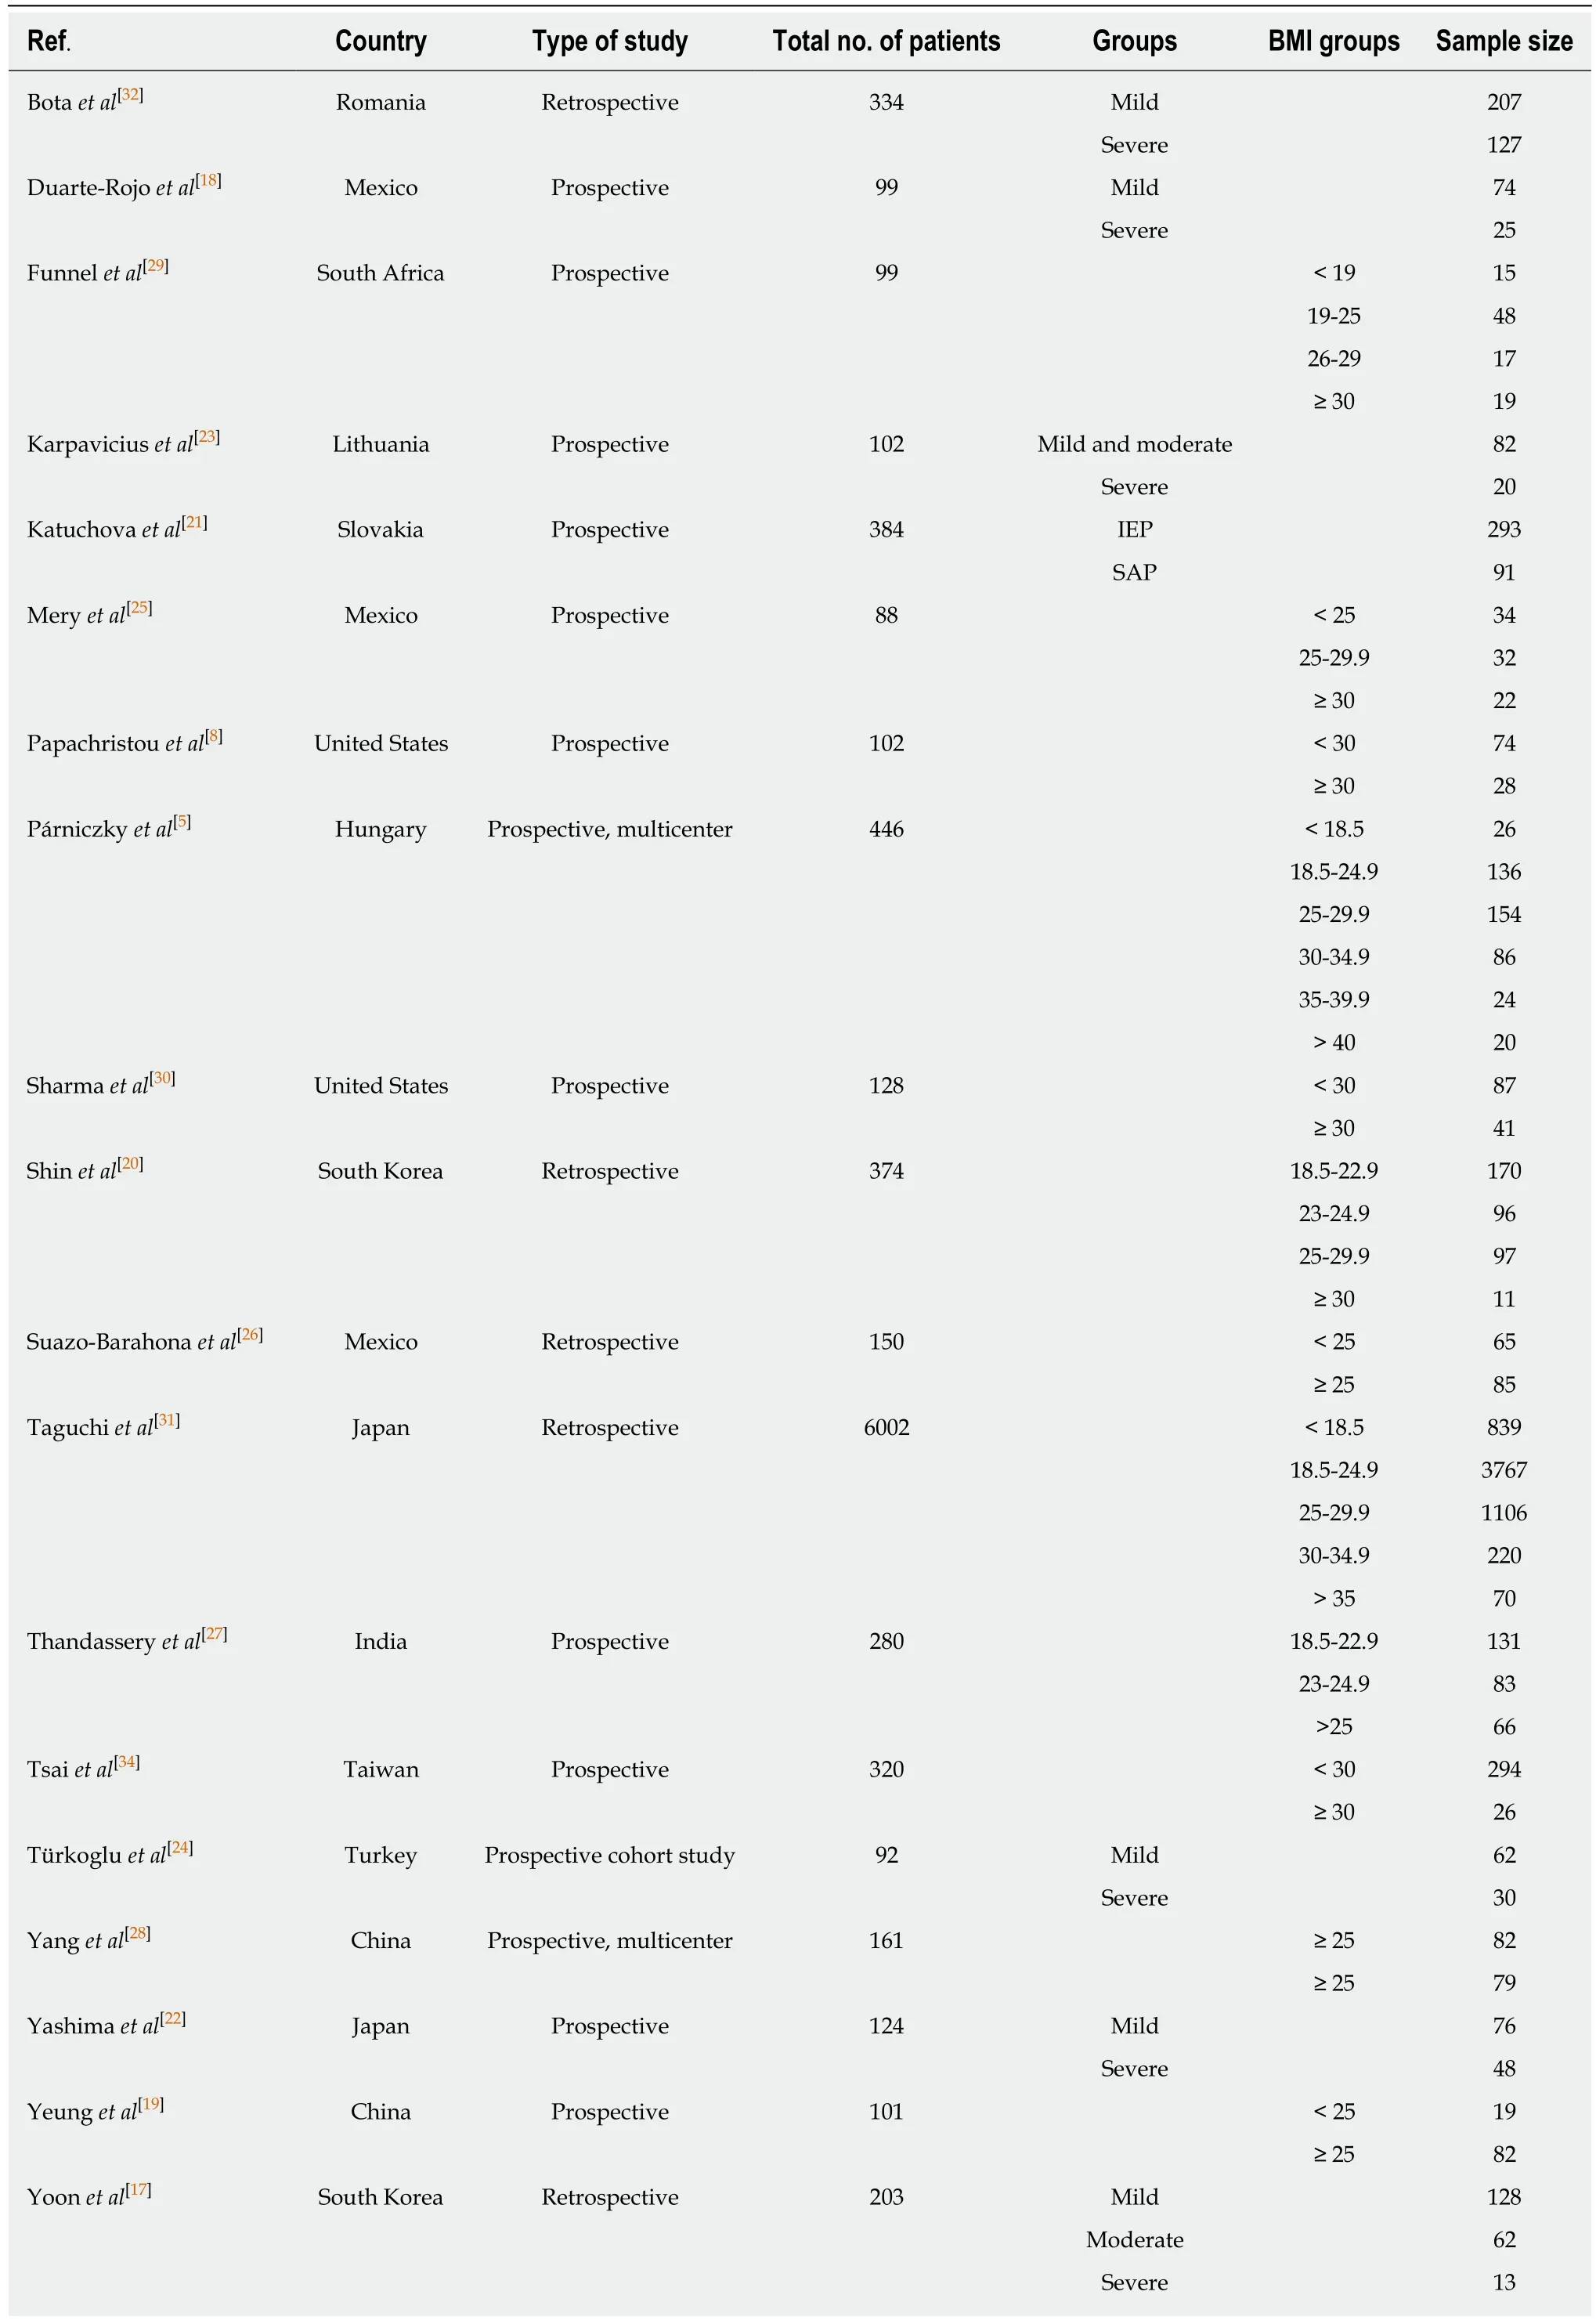
Table 1 Characteristics of the included studies
Statistical analysis
The statistical analysis was conducted with Stata 11 SE (Stata Corp, College Station,TX, United States). First, we calculated mean differences from BMI in severe and nonsevere groups and odds ratios (OR) for severity and mortality outcomes based on patient numbers in different BMI categories. ORs and mean differences were pooled using the random effects model with the DerSimonian-Laird estimator and displayed on forest plots. Summary OR and mean estimation, P-value and 95% confidence interval (CI) were calculated. P < 0.05 was considered a significant difference from summary OR = 1 or mean = 0. Statistical heterogeneity was analyzed using the I2statistic and the chi-square test to obtain probability values; P < 0.05 was determined to indicate significant heterogeneity. We investigated the possible signs of a small study effect, displaying the studies on a funnel plot with the trim and fill algorithm.
RESULTS
The systematic search of the literature yielded 262 items. After eliminating duplicates,217 records were screened by title and abstract. 156 articles were included in the fulltext assessment, of which 15 studies met our predetermined eligibility criteria. An additional four articles included in the quantitative synthesis were found by checking the references of the originally identified articles (Figure 3).
The interpretation of cut-off values was not unified in the enrolled studies that investigated the effect of obesity in AP. As articles used different BMI grouping and not all articles contained data on all BMI subgroups, we decided to use several statistical approaches.
Severity
Nine articles[17-24,32]presented data on the mean BMI of the non-severe and severe patient groups (Figure 4). This meta-analysis showed that severe AP patients have a significantly higher BMI compared to those with moderately severe and severe AP(MD = 1.79, 95%CI: 0.89-2.70, P < 0.001). AP patients with a BMI > 25 are almost three times more likely to develop a severe disease than normal weight and underweight patients (OR = 2.87, 95%CI: 1.90-4.35, P < 0.001) according to the analysis of data from eight additional studies[5,19-20,25-29](Figure 5). Data from five articles[5,20,25,29-30]also made it possible to set a BMI of 30 kg/m2as a cut-off value in our severity analysis. There is a sharp difference between obese and non-obese patients in the chance for developing a severe disease: a patient with a BMI > 30 has an almost four times higher odds of SAP than one with a BMI < 30 (OR = 3.61, 95%CI: 1.56-8.36, P = 0.003) (Figure 6).
Comparing the normal BMI group to every other BMI category (< 18.5; 25-30; 30-35;> 35 kg/m²) in a summary effect analysis (Figure 7) showed that overweight and obese patients are more likely to develop a severe disease than patients in all other BMI categories (OR = 2.53, 95%CI: 1.64-3.90, P = 0.000 and OR = 2.99, 95%CI: 1.13-7.92,P = 0.028). Underweight compared to normal BMI also seems to increase the risk of severe AP (OR = 1.89, 95%CI: 0.52-6.87, P = 0.336); however, the differences are not significant. The reason behind the lack of significance may be the particularly low number of patients in the underweight subgroup (n = 184). Forming subgroups from each BMI category (underweight, normal weight, overweight and obese) confirmed the previously identified tendency: the higher the BMI, the higher the chance of developing severe AP (Figure 8).
Mortality
A total of ten[5,8,19-20,25-29,31]of the 19 enrolled studies were included in this part of the meta-analysis. While a BMI > 25 represents a higher chance of developing severe AP,it does not significantly increase the mortality of the disease (OR = 2.46, 95%CI: 0.78-7.79, P = 0.125) (Figure 9). However, obese patients are at a three-fold increased risk of mortality compared to those with a BMI < 30 (OR = 2.89, 95%CI: 1.14-7.36, P = 0.026)(Figure 10). One with a BMI < 18.5 is also at a significantly higher risk of mortality in AP than a normal weight patient (OR = 1.82, 95%CI: 1.32-2.50, P = 0.000) (Figure 11).Death rates among AP patients are the highest in the underweight and obese subgroups (Figures 12 and 13), while the chance of mortality is almost equal in the normal BMI and BMI 25-30 subgroups.
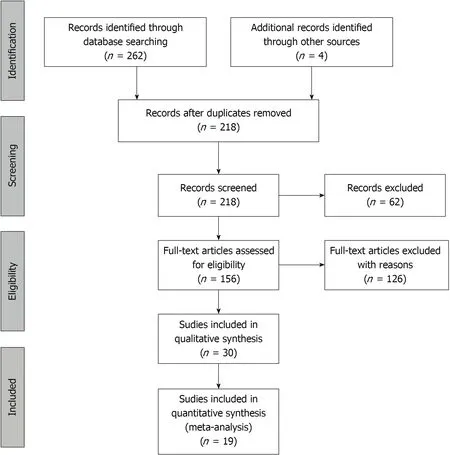
Figure 3 Flowchart of the study selection procedure.
DISCUSSION
The first meta-analysis[10]on the topic of AP and BMI was published by Martínez et al in 2004, concluding that obesity significantly increases the risk of local or systemic complications in AP. Since then, three more meta-analyses have also confirmed the prognostic role of BMI in the disease, leading to even more specific results. The first meta-analysis was updated two years later by the same author[11], confirming that obesity not only raises the risk of complications, but also increases the mortality in AP. In 2011, Wang et al[12]highlighted that overweigh (BMI > 25) also increases the incidence of SAP, while Hong et al[13]drew attention to the prognostic role of body weight in AP development in their meta-analyses.
The main purpose of the present meta-analysis was to precisely evaluate the predictive value of BMI in AP by assessing what is already known and confirmed by evidence and to offer guidance on its use in clinical practice.
Severity
Seven of the included articles in this meta-analysis found a clear correlation between overweight or obesity and the development SAP. Two studies showed no significant relation between BMI and disease severity in AP[5,32]. Three articles[17-18,22]analyzed the effect of BMI in comparison with other tools for measuring obesity. These studies stated that abdominal obesity (waist circumference), peripancreatic visceral adipose tissue and visceral fat-to-muscle ratio have a stronger correlation with SAP than BMI or body weight. We were also prepared to do an analysis of these data, but abdominal obesity is measured differently in each study[18,21-22,25,33], making a meta-analysis inapplicable. One of the enrolled studies compared the accuracy of different scoring systems in predicting the severity of AP[19], in which the addition of the obesity factor did not seem to improve the accuracy of the APACHE II scoring system. An interventional clinical trial[28]was also conducted in this area, resulting in the successful prevention of severe AP in obese patients with the intravenous administration of octreotide.
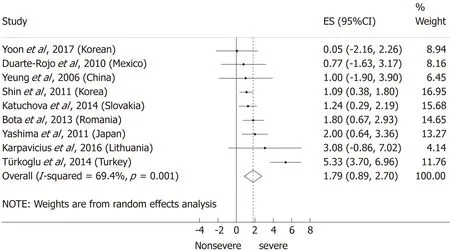
Figure 4 Forest plot of mean body-mass index in the non-severe and severe patient subgroups. Filled circles represent the mean difference derived from the studies analyzed. Horizontal bars represent 95%CI. Empty rhombuses show the overall, combined mean difference (point estimation is the middle of the rhombus and CIs are the edges). BMI: Body-mass index; CI: Confidence interval; OR: Odds ratio.
Although previous studies have already confirmed the relation between BMI and the major endpoints of AP, it is still not incorporated into the scoring systems that aim to predict disease outcome. A prospective study involving 186 consecutive patients published by Johnson et al[7]in 2004 resulted in the improved prediction of severity in AP by adding the obesity factor to the APACHE II scoring system (Admission APACHE-O > 9: sensitivity 82%, specificity 86%, PPV 74%, NPV 91% and accuracy 85%; admission APACHE II > 9: sensitivity 68%, specificity 84%, PPV 71%, NPV 81%and accuracy 80%). Prevalence of complications increased among patients with a BMI 26-30 (score = 1), while mortality rates were significantly higher among BMI > 30(score = 2) patients. Two years later, a prospective study of 101 patients[8]also stated that obesity is an independent risk factor for severe AP and that the APACHE-O scoring system is not significantly better, but it has a similar predictive ability compared to APACHE II (Admission APACHE-O > 9: sensitivity 84%, specificity 82%, PPV 52%, NPV 96% and accuracy 83%; admission APACHE II > 9: sensitivity 74%, specificity 85%, PPV 47%, NPV 93% and accuracy 80%). In 2012, a cross-sectional retrospective study by Guzman et al[9]added the BMI parameter to the Bedside Index of Severity in Acute Pancreatitis (BISAP) score and achieved higher diagnostic accuracy than the original scoring system (sensitivity 75%, specificity 96.4%, PPV 80%,NPV 95.2% and accuracy 92.3%).
Mortality
All the included articles found a correlation between BMI and mortality in AP. One study[31]identified underweight as another independent risk factor for a fatal disease outcome, and our meta-analysis confirmed this. However, the number of patients was very low in this subgroup.
Limitations
Overweight and obesity are often accompanied by other chronic diseases and metabolic derangements such as hypertension, diabetes and hypertriglyceridemia. As we did not take demographic factors and comorbidities into consideration, we cannot conclude if BMI is an independent or associated risk factor in AP, which is a limitation of this study.
Strengths
Our meta-analysis is much more comprehensive and detailed compared to the earlier ones. This work performs the first detailed analysis on all WHO BMI categories, by comparing the normal BMI subgroup to all other subgroups of BMI with regard to both severity and mortality in AP. Our subgroup analysis also investigated each BMI category, this way, we are now able to determine which BMI groups are most in danger of a severe or even fatal outcome in AP.
In conclusion, the findings of this meta-analysis demonstrated that a BMI above 25 increases the risk of severe AP, but not mortality, while a BMI > 30 raises the risk of both severity and mortality in AP. A BMI < 18.5 carries an almost two times higher risk of mortality in AP.
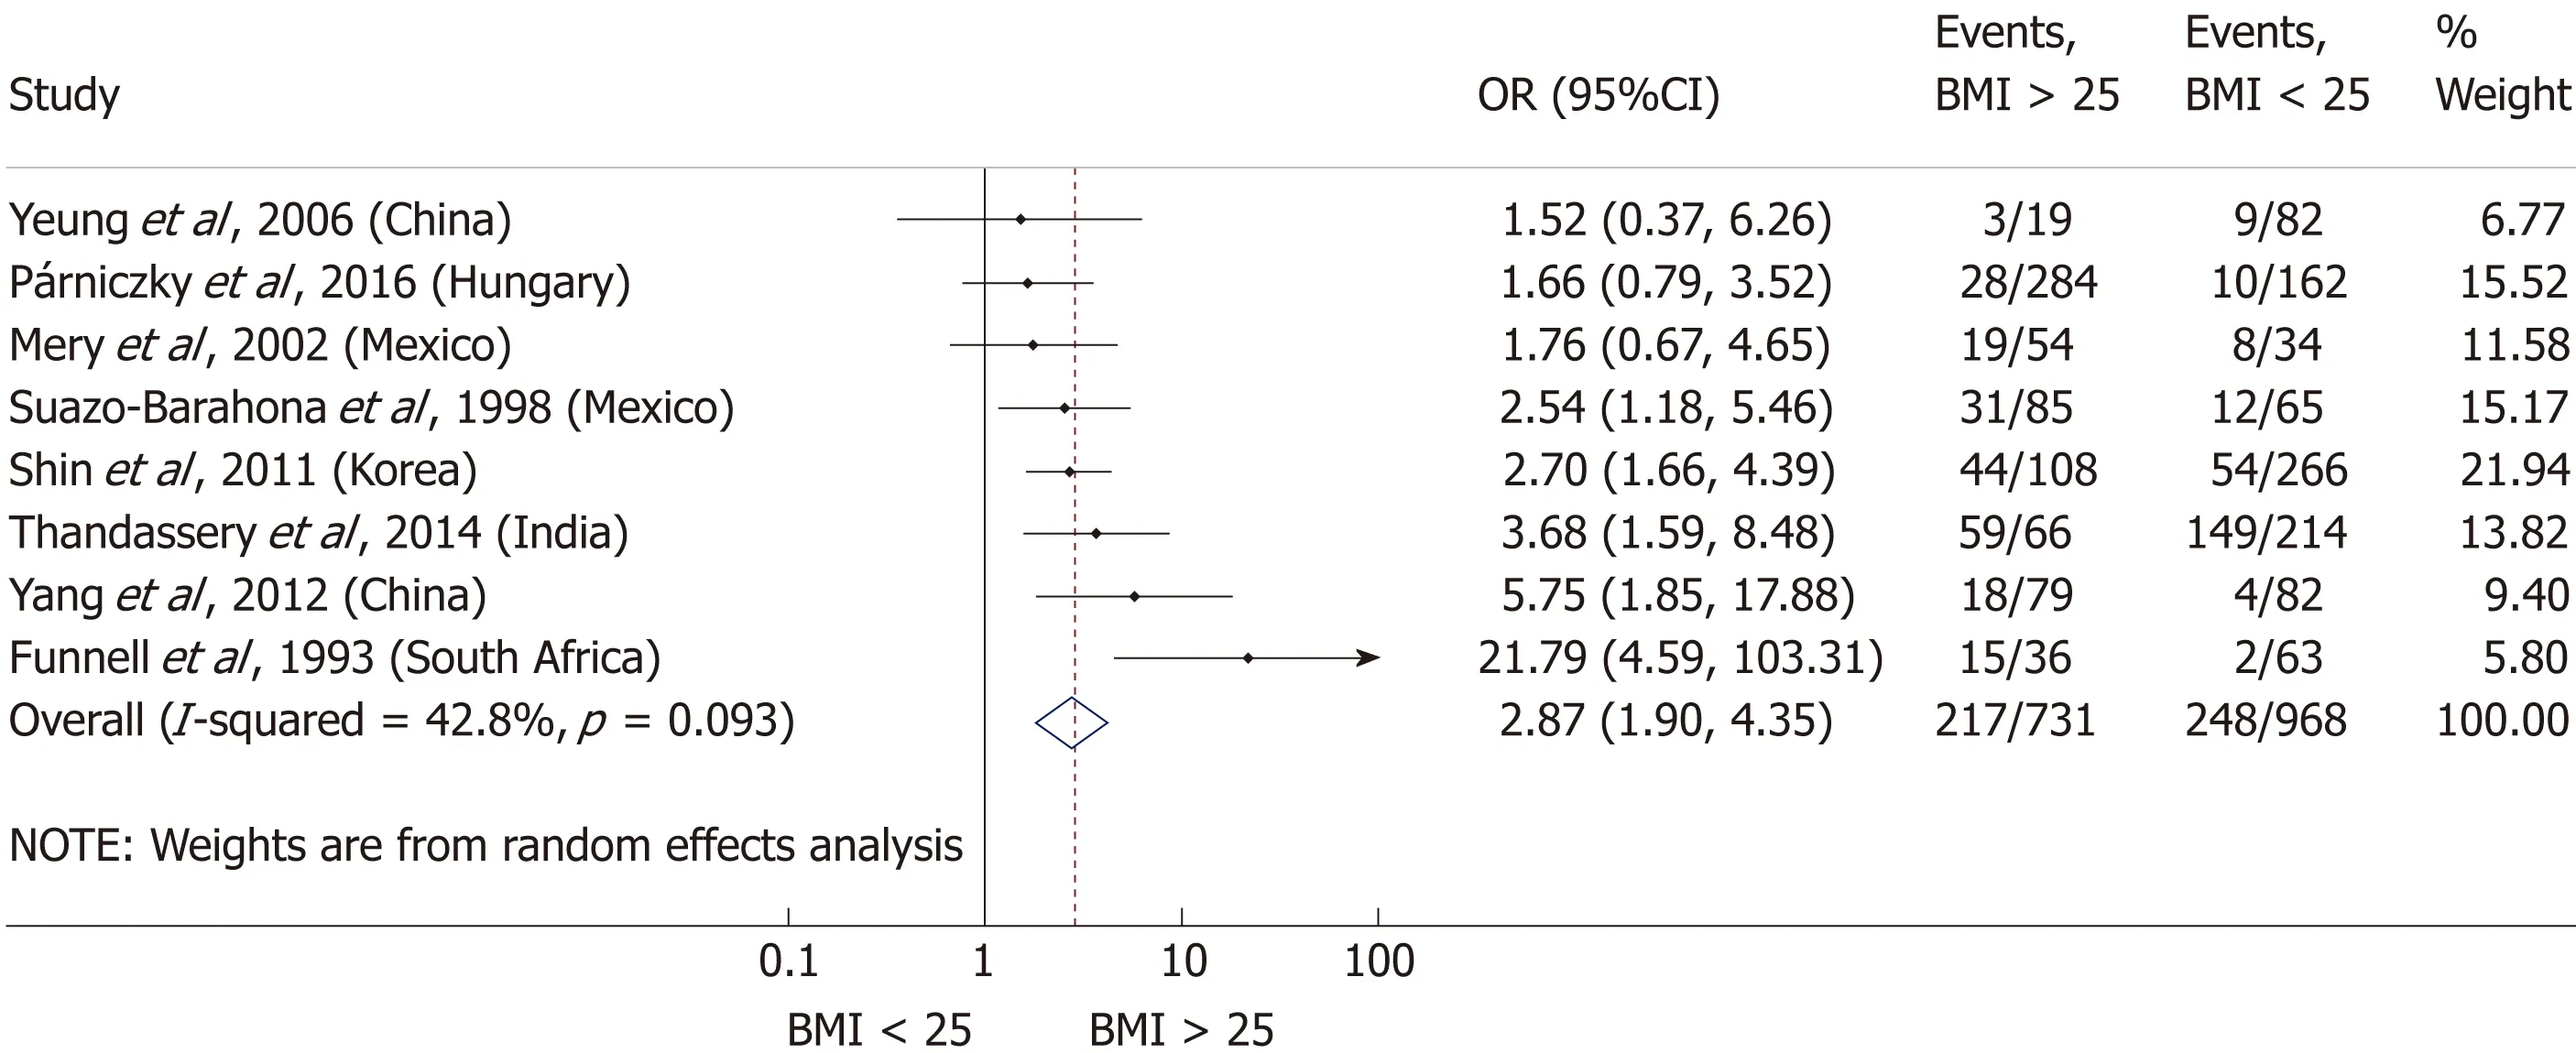
Figure 5 Forest plot of severe acute pancreatitis in the body-mass index < 25 and body-mass index > 25 subgroups. Filled circles represent the odds ratio derived from the studies analyzed. Horizontal bars represent 95%CI. Empty rhombuses show the overall, combined effect (OR is the middle of the rhombus and CIs are the edges). BMI: Body-mass index; CI: Confidence interval; OR: Odds ratio.
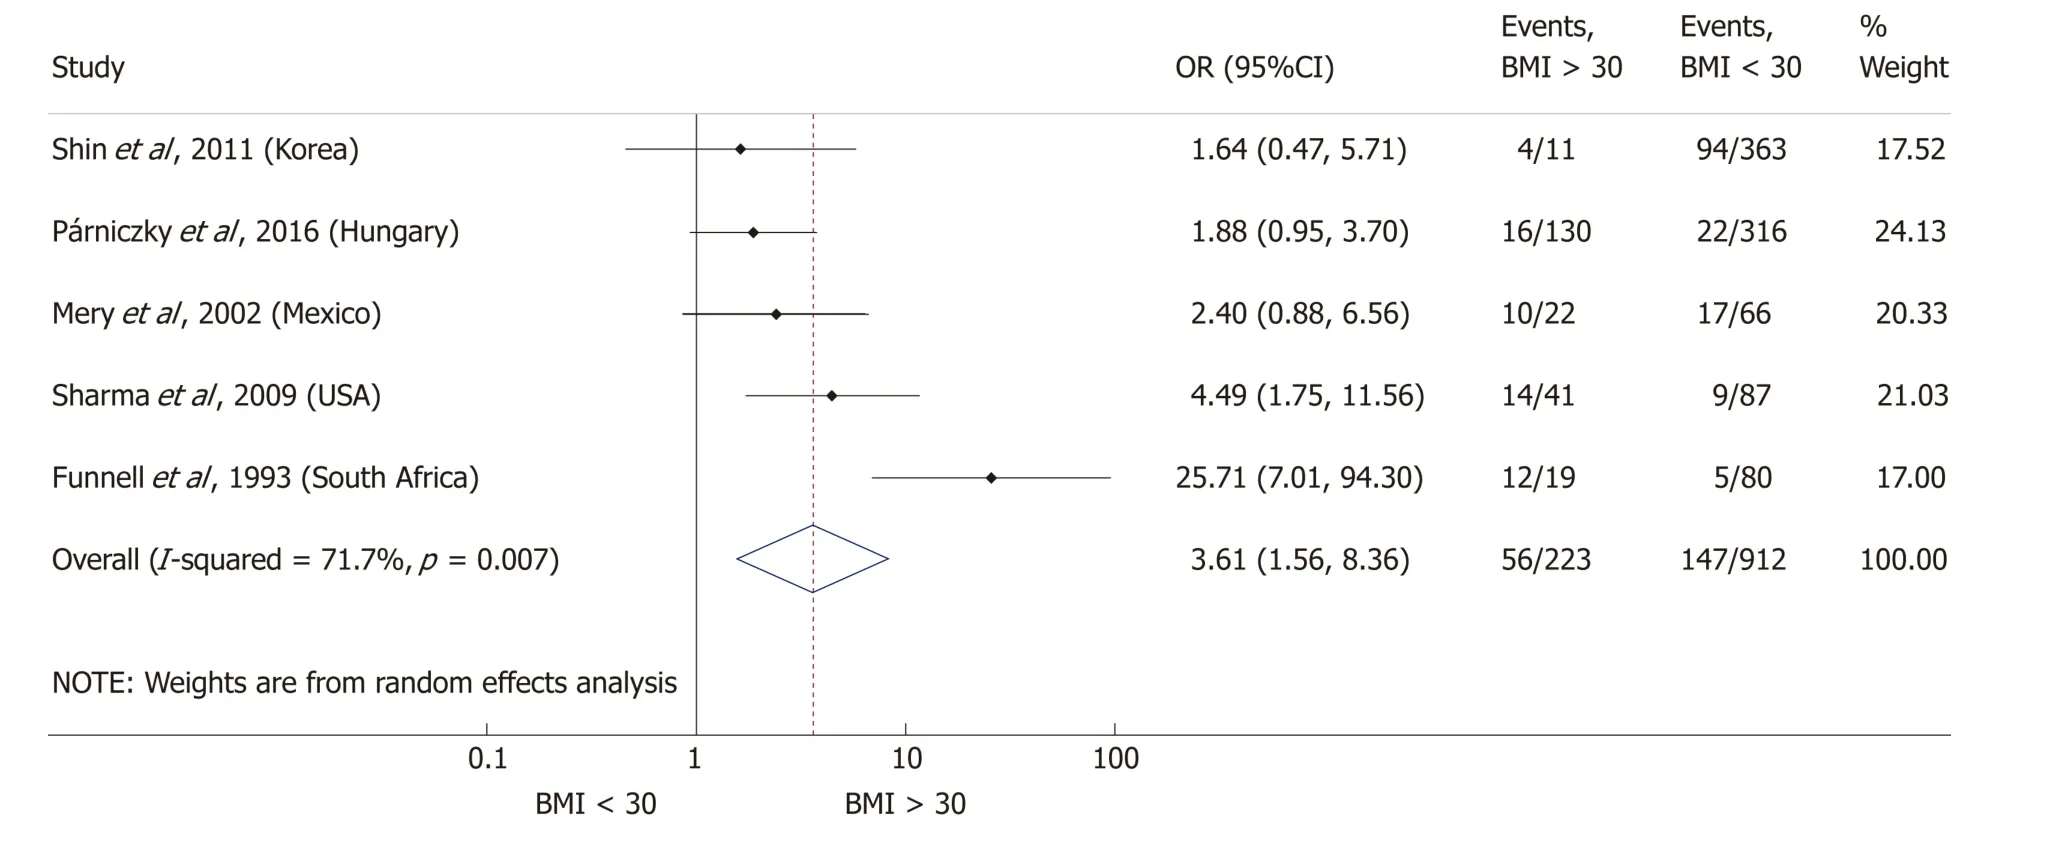
Figure 6 Forest plot of severe acute pancreatitis in the body-mass index < 30 and body-mass index > 30 subgroups. Filled circles represent the odds ratio derived from the studies analyzed. Horizontal bars represent 95%CI. Empty rhombuses show the overall, combined effect (OR is the middle of the rhombus and CIs are the edges). BMI: Body-mass index; CI: Confidence interval; OR: Odds ratio.
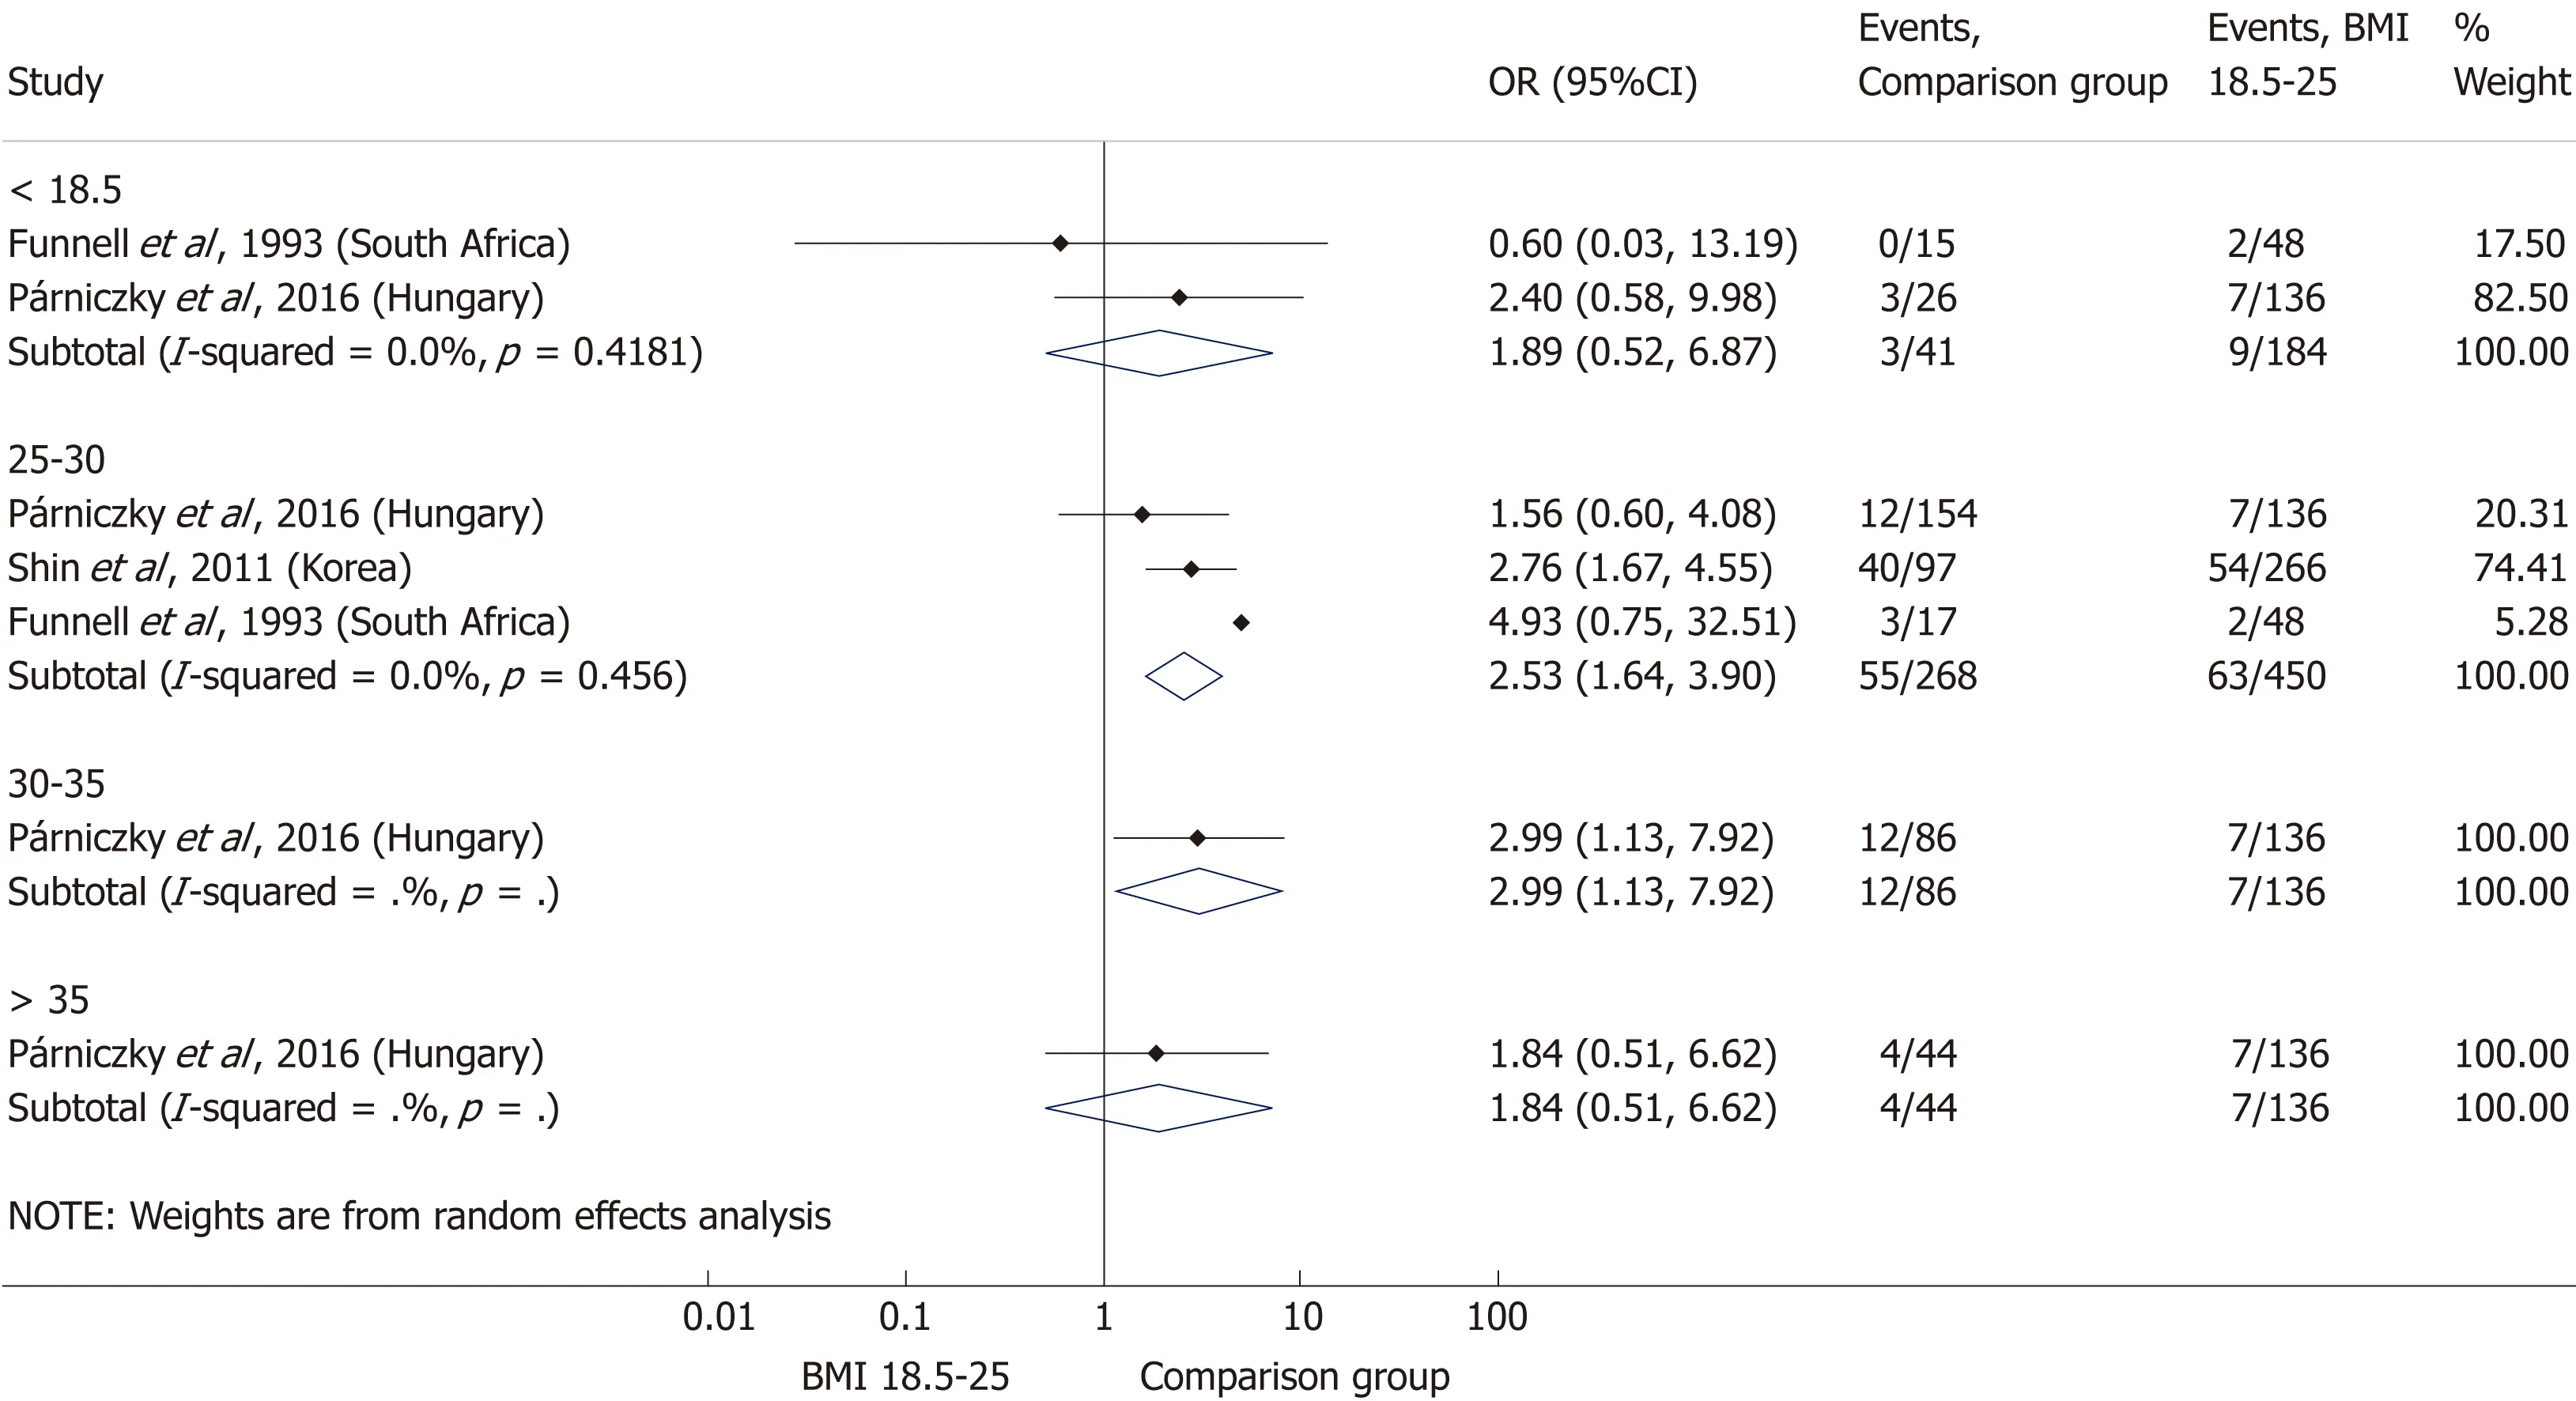
Figure 7 Forest plot of acute pancreatitis severity comparing the normal body-mass index group (body-mass index 18.5-25) to other body-mass index categories. Filled circles represent the odds ratio derived from the studies analyzed. Horizontal bars represent 95% CI. Empty rhombuses show the overall, combined effect (OR is the middle of the rhombus and CIs are the edges). BMI: Body-mass index; CI: Confidence interval; OR: Odds ratio.
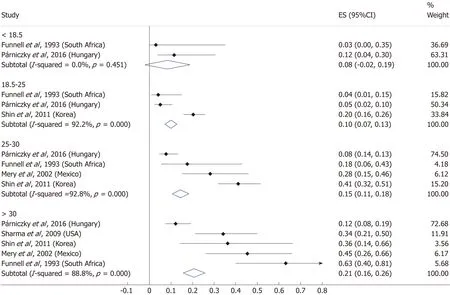
Figure 8 Subgroup analysis of body-mass index and acute pancreatitis severity displayed on forest plot. Filled circles represent the odds ratio derived from the studies analyzed. Horizontal bars represent 95%CI. Empty rhombuses show the overall, combined effect (OR is the middle of the rhombus and CIs are the edges).BMI: Body-mass index; CI: Confidence interval; OR: Odds ratio.
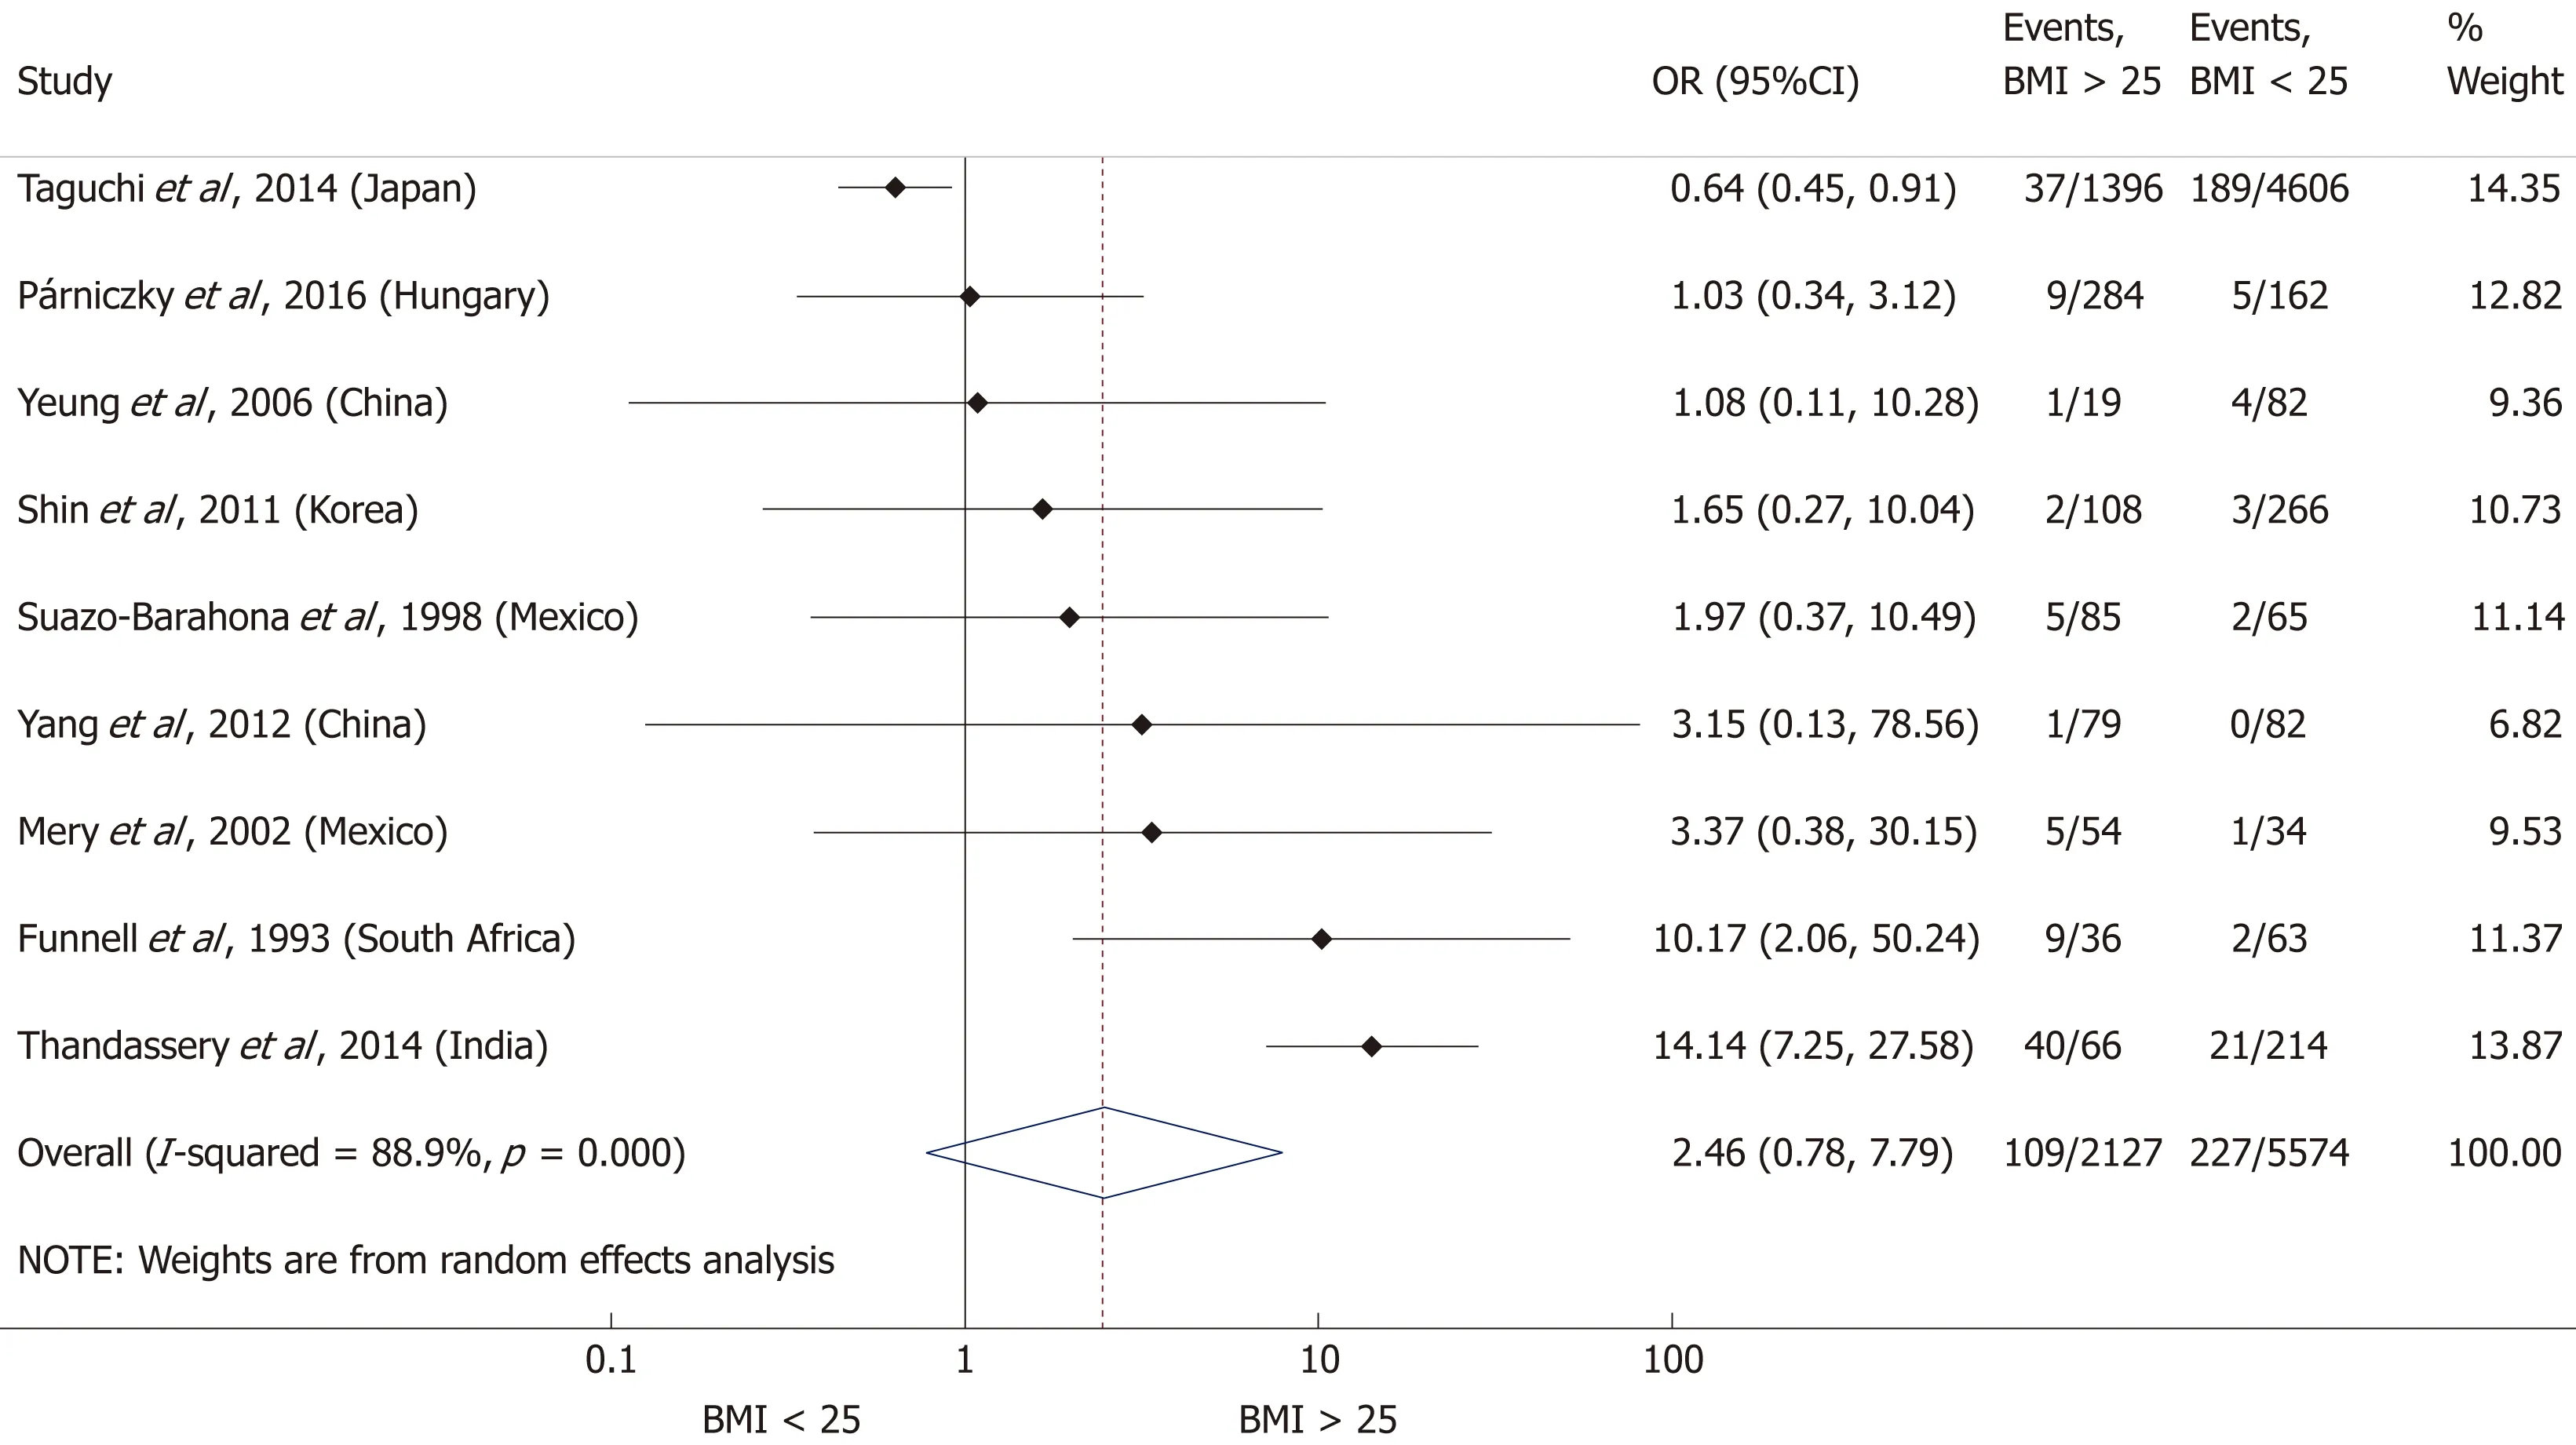
Figure 9 Forest plot of mortality comparing the body-mass index < 25 and body-mass index > 25 subgroups. Filled circles represent the odds ratio derived from the studies analyzed. Horizontal bars represent 95% CI. Empty rhombuses show the overall, combined effect (OR is the middle of the rhombus and CIs are the edges). BMI: Body-mass index; CI: Confidence interval; OR: Odds ratio.
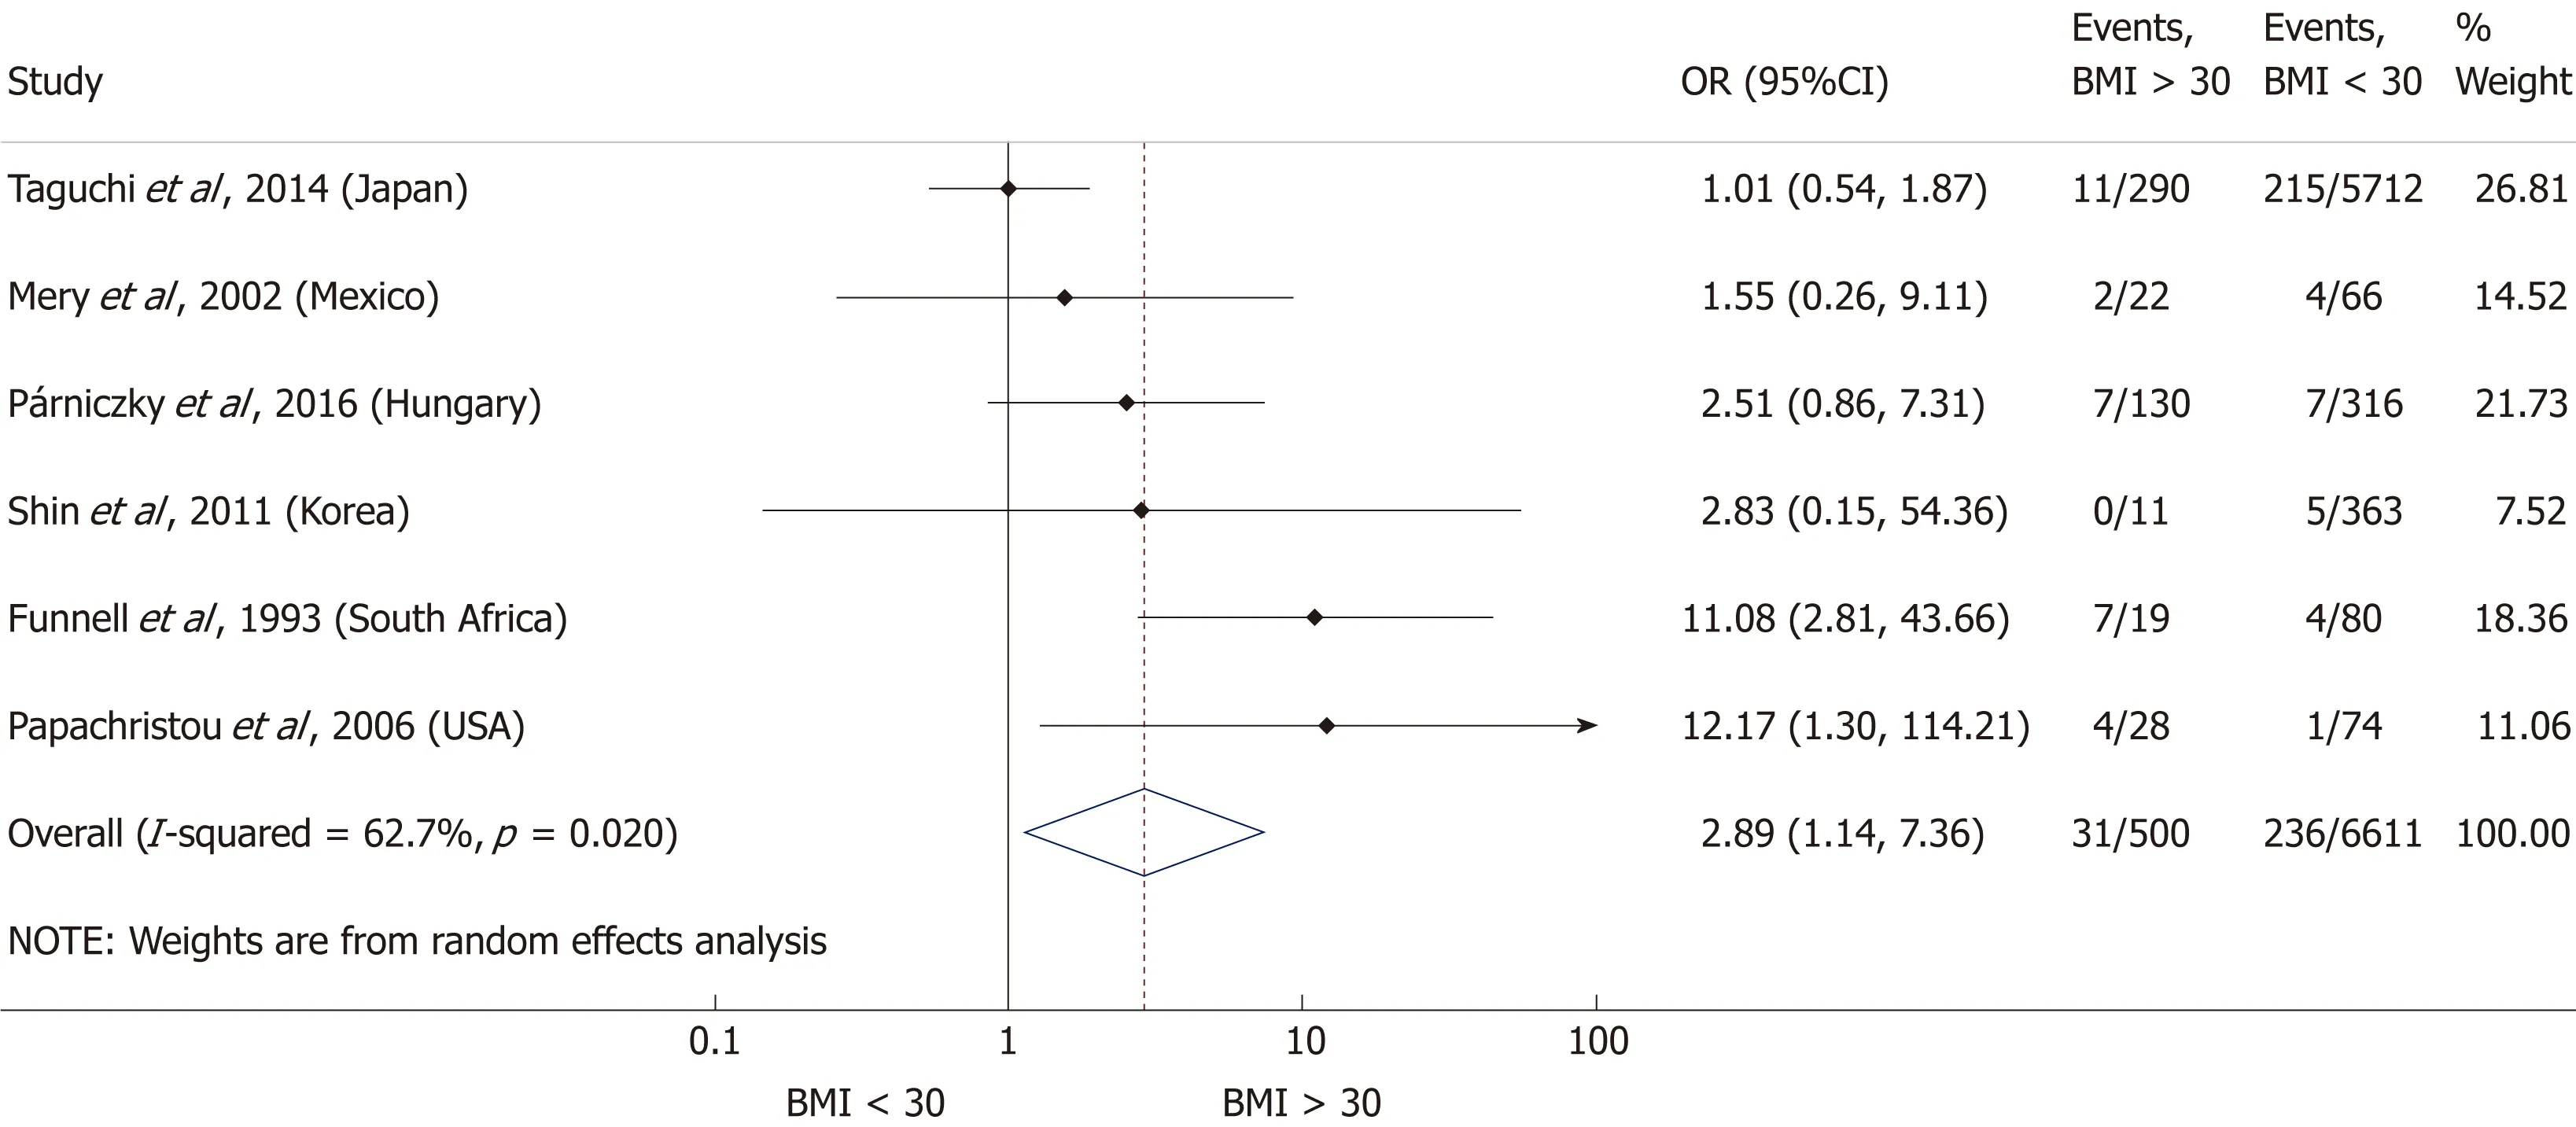
Figure 10 Forest plot of mortality comparing the body-mass index < 30 and body-mass index > 30 subgroups. Filled circles represent the odds ratio derived from the studies analyzed. Horizontal bars represent 95%CI. Empty rhombuses show the overall, combined effect (OR is the middle of the rhombus and CIs are the edges). BMI: Body-mass index; CI: Confidence interval; OR: Odds ratio.
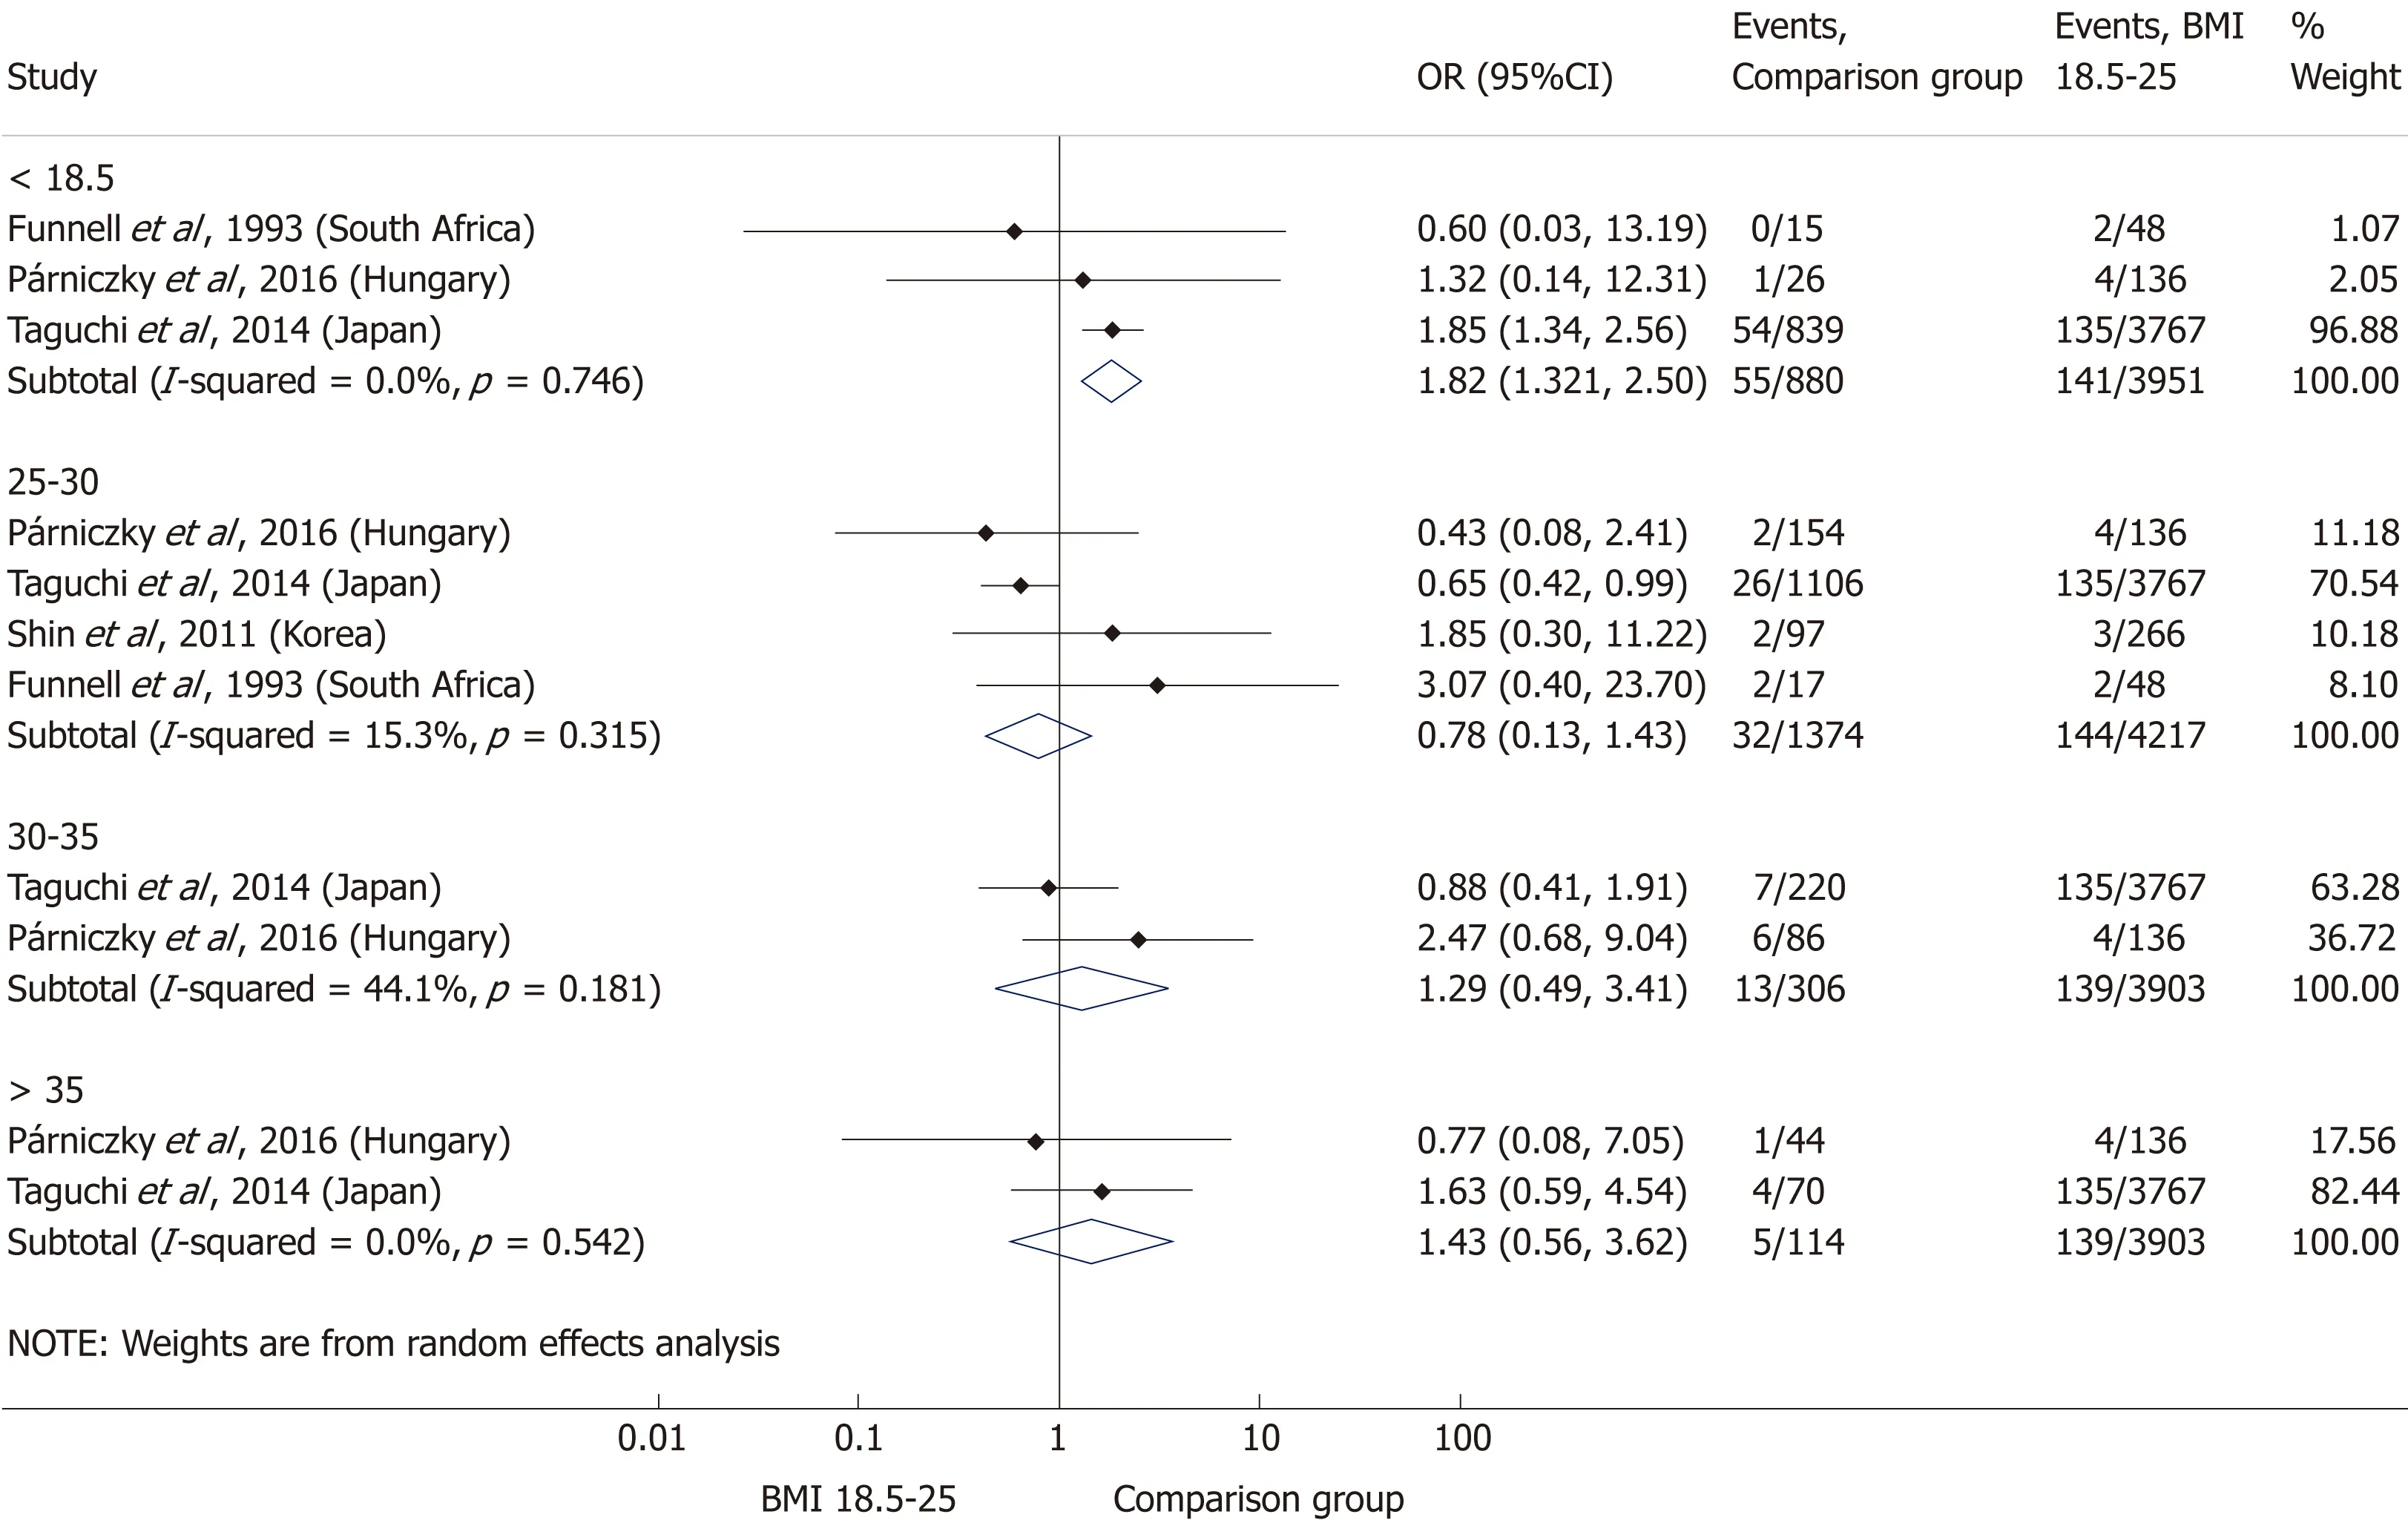
Figure 11 Forest plot of mortality comparing the normal body-mass index group (body-mass index 18.5-25) to other body-mass index categories. Filled circles represent the odds ratio derived from the studies analyzed. Horizontal bars represent 95% CI. Empty rhombuses show the overall, combined effect (OR is the middle of the rhombus and CIs are the edges). BMI: Body-mass index; CI: Confidence interval; OR: Odds ratio.
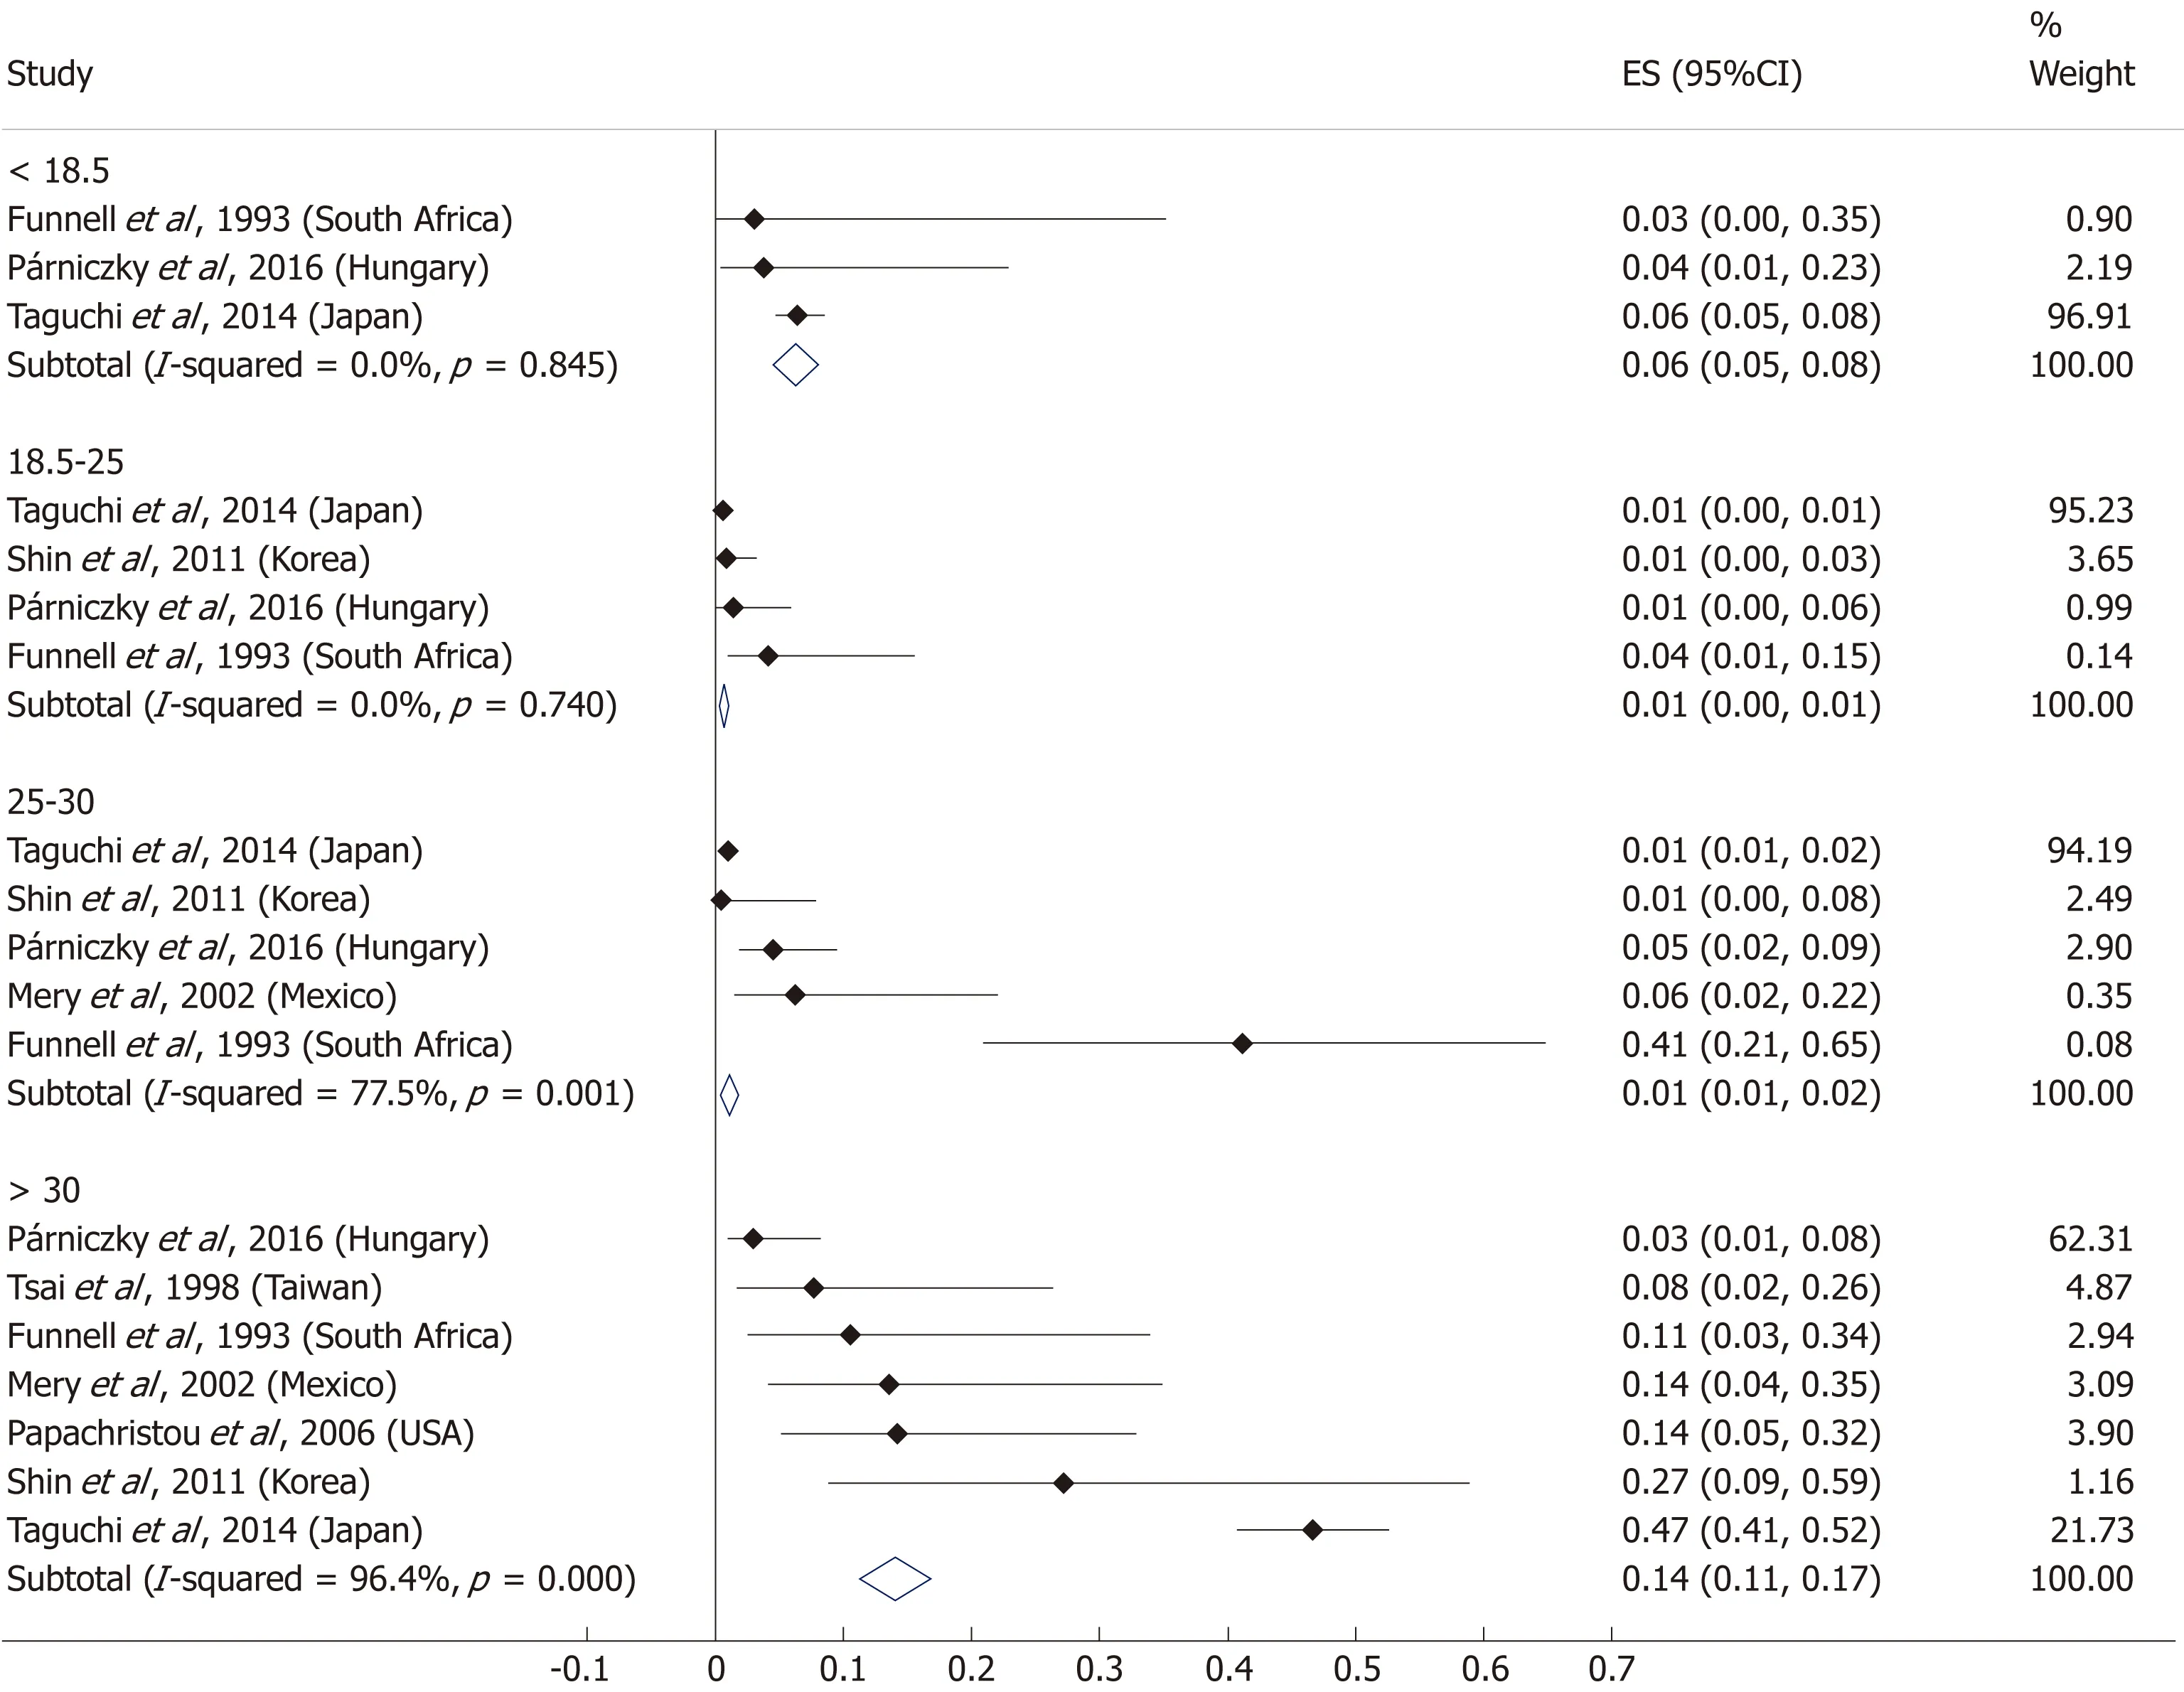
Figure 12 Subgroup analysis of body-mass index and acute pancreatitis mortality displayed on forest plot. Filled circles represent the odds ratio derived from the studies analyzed. Horizontal bars represent 95%CI. Empty rhombuses show the overall, combined effect (OR is the middle of the rhombus and CIs are the edges).BMI: Body-mass index; CI: Confidence interval; OR: Odds ratio.
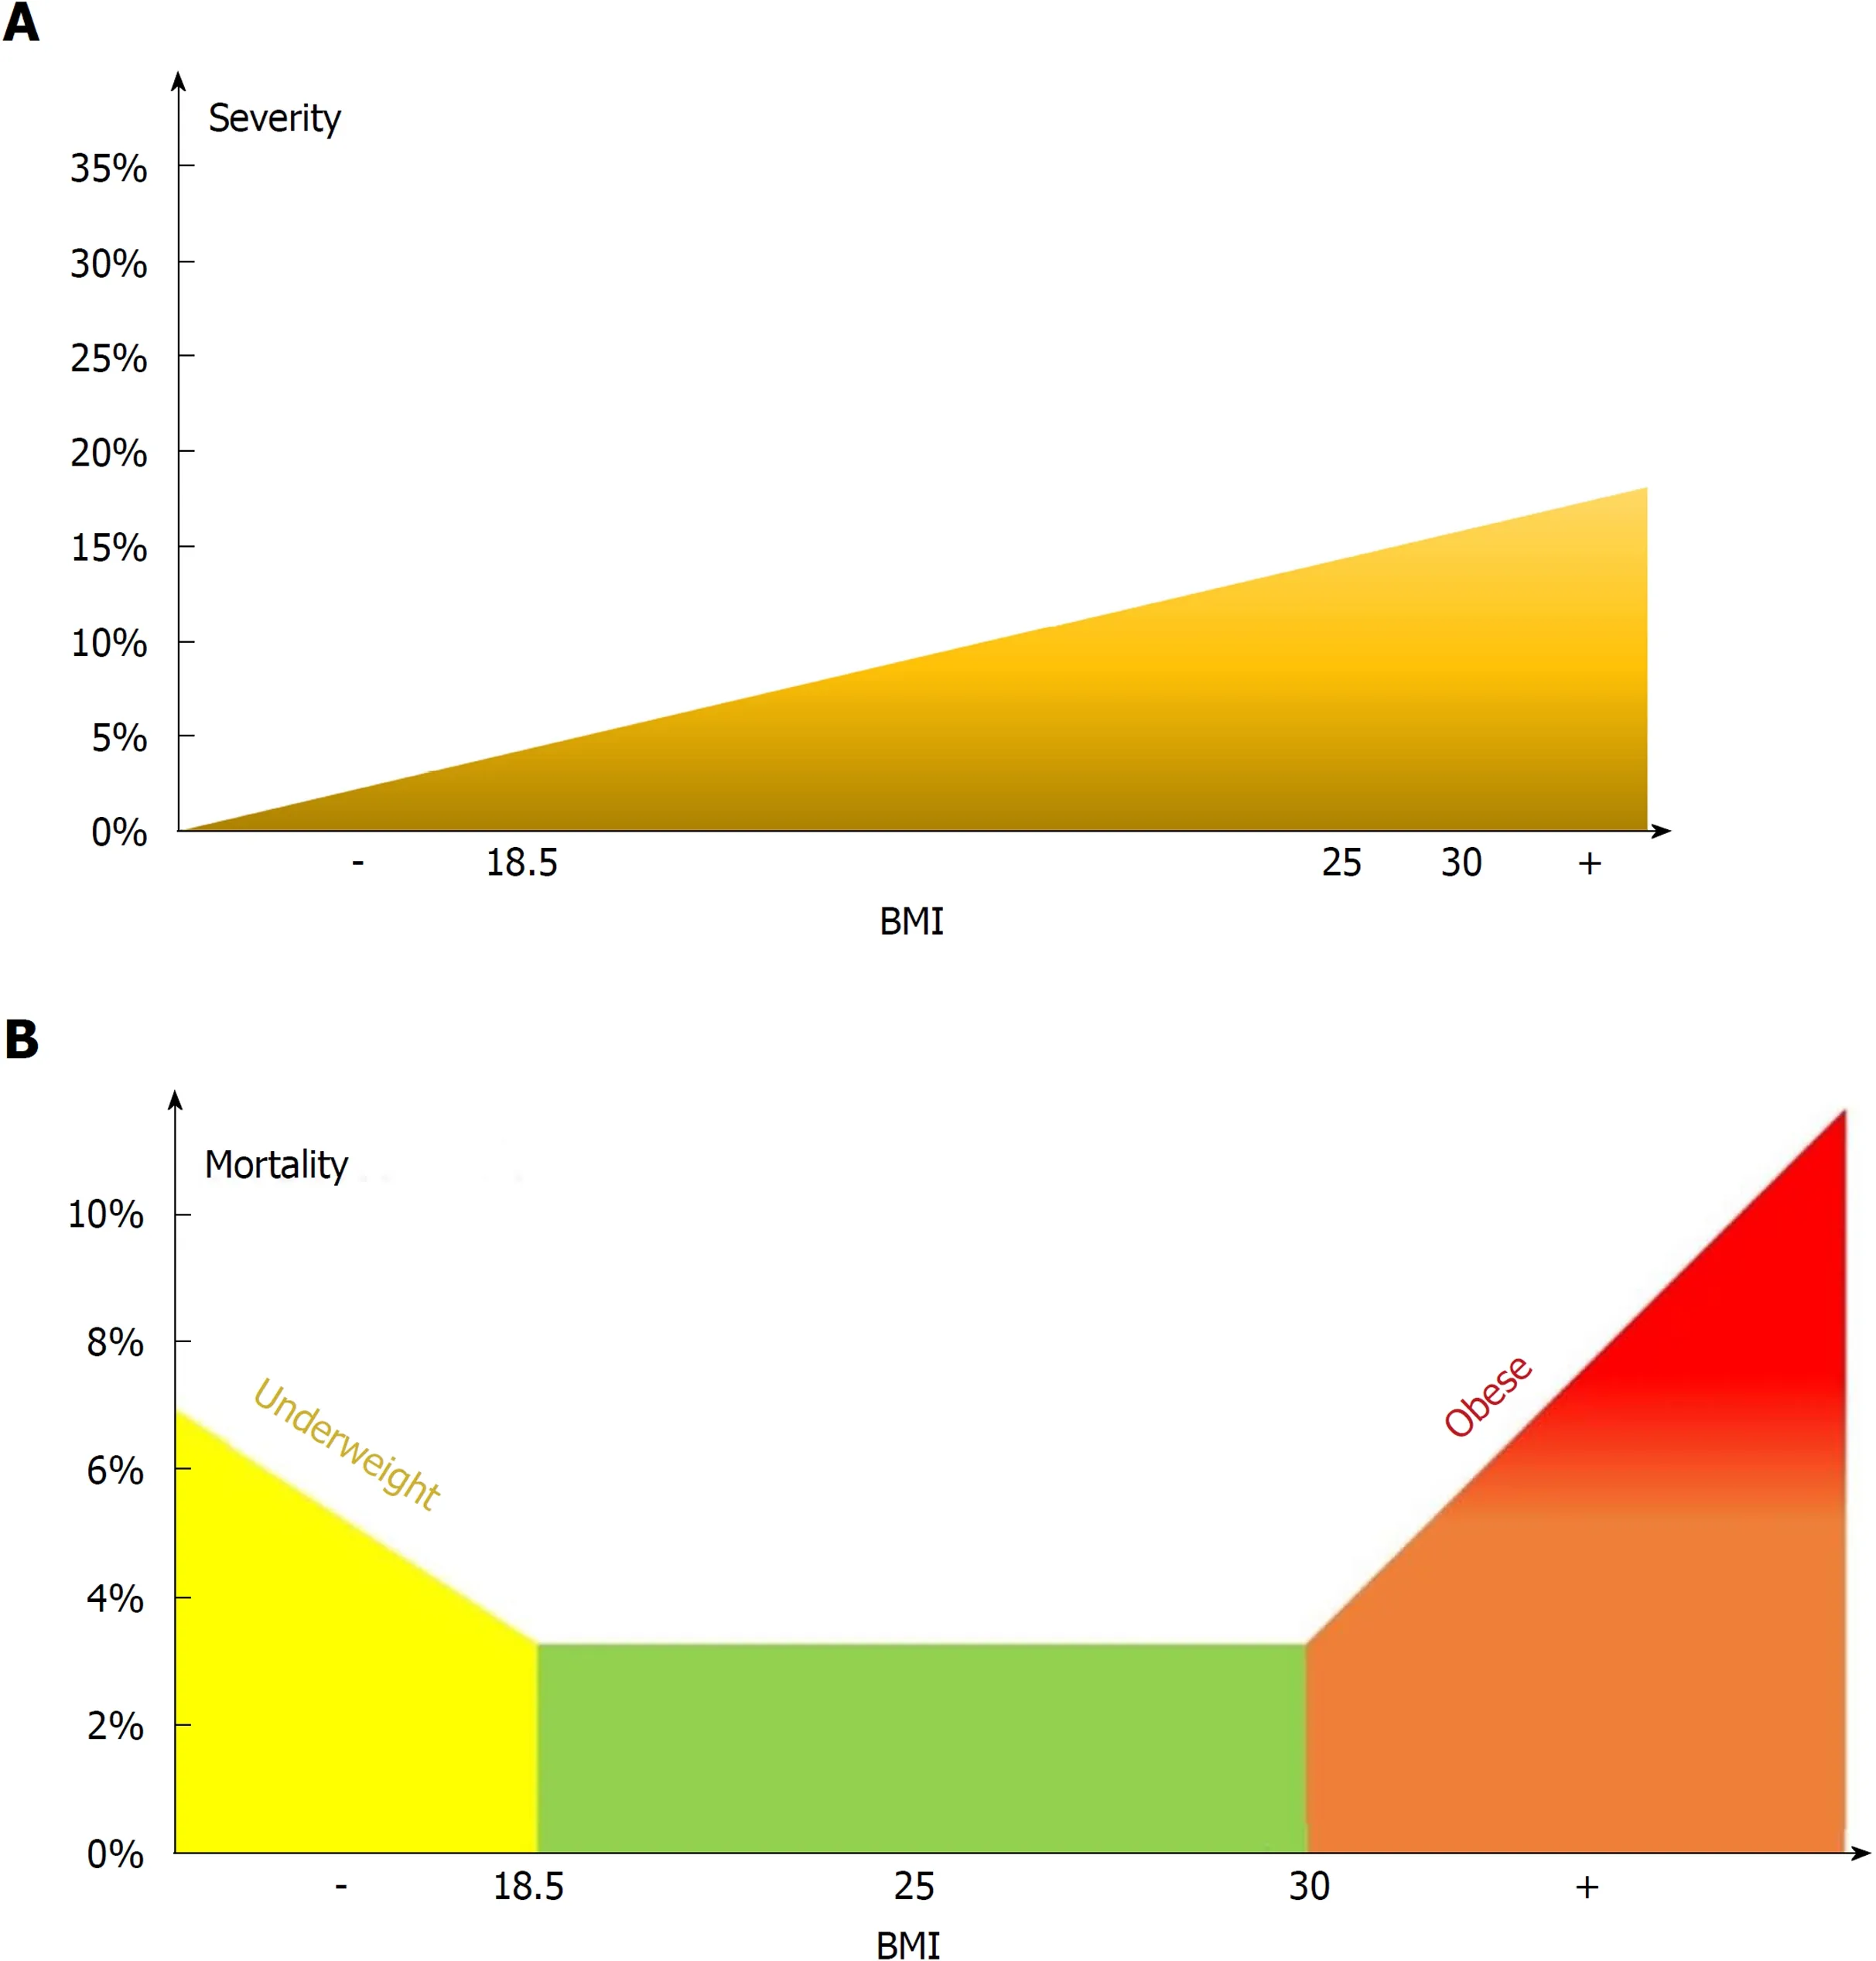
Figure 13 Model for the effect of body-mass index on severity (A) and mortality (B).
ARTICLE HIGHLIGHTS
Research background
The worldwide incidence of obesity is increasing and previous studies stated that it worsens the outcome of AP.
Research motivation
We wanted to provide detailed guidance on the clinical use of BMI in prognostic scoring.
Research objectives
To exactly identify which BMI subgroups are most in danger of a severe or even fatal disease outcome in AP.
Research methods
A systematic search was carried out in PubMed, Embase and Cochrane Library databases for studies investigating the effect of BMI on the outcome of AP. We used the PRISMA protocol,registered our project in PROSPERO and assessed the quality of the included articles by using a modified version of the Newcastle-Ottawa Scale. The statistical calculations were performed with Stata 11 SE, using the random effects model (DerSimonian-Laird method).
Research results
9997 patients with acute pancreatitis were included (19 articles) in this analysis. We found that AP patients with a BMI > 25 have a significantly increased risk of SAP with an OR of 2.87. A BMI> 30 means a significantly increased risk of mortality (OR = 2.89) while one with a BMI < 18.5 is also at a significantly higher risk of mortality compared to normal weight patients with an OR of 1.82.
Research conclusions
The new findings of this study identified that a BMI above 25 increases the risk of severe AP, but not mortality, while a BMI > 30 raises the risk of mortality. A BMI < 18.5 carries an almost two times higher risk of mortality in AP. It is the first meta-analysis that performs a detailed analysis on all WHO BMI categories with regard to both primary endpoints of AP. This helps to determine which BMI groups are at the highest risk of severe or even fatal outcome in AP.
Research perspectives
Our results give the opportunity for researchers to prepare the guidelines and scoring systems more precisely.
杂志排行
World Journal of Gastroenterology的其它文章
- Evolving role of magnetic resonance techniques in primary sclerosing cholangitis
- Cancer risk in primary sclerosing cholangitis: Epidemiology,prevention, and surveillance strategies
- Artificial intelligence in medical imaging of the liver
- Effect of Sheng-jiang powder on multiple-organ inflammatory injury in acute pancreatitis in rats fed a high-fat diet
- Preoperative rectosigmoid endoscopic ultrasonography predicts the need for bowel resection in endometriosis
- Short- and long-term outcomes of endoscopically treated superficial non-ampullary duodenal epithelial tumors
