Research on Stress Intensity Factors for the Deflected Crack of CTS Specimen
2019-01-09HUANGRuxuWANZhengquan
HUANG Ru-xu,WAN Zheng-quan
(1.China Ship Scientific Research Center,Wuxi 214082,China;2.State Key Laboratory of Deep-sea Manned Vehicles,Wuxi 214082,China)
Abstract:The closed-form SIFs solutions of compact tension shear(CTS)specimen are used to investigate the mixed-mode I/II fracture behavior,but they are not applicable for the deflected crack.In this study,three dimensional fracture analyses of CTS specimen for mixed-mode I/II loading are performed using finite element method(FEM).To simulate the real conditions,the contacts between the contact surfaces of the loading device,specimen and the pins are defined.Comparison between the FEM results and the solutions for SIFs of CTS specimen was done for verification of the proposed simulation method.The crack growth paths of the CTS specimen for all loading angles are simulated following the MTS criterion.The SIFs of the crack front with the crack growth length were given,and the reason of the crack growth paths not perpendicular with the direction of the traction force was found.Finally,the closed-form SIFs solutions for the deflected crack of CTS specimen were proposed,which can be used for the mixed mode I/II fracture behavior research.
Key words:fracture;mixed mode I/II;compact tension shear specimen;crack growth path;SIF
0 Introduction
Fracture mechanics that focusing initially on mode I fracture problems is widely used as an effective tool to predict and prevent catastrophic failures of many structural components which are under developing and growing cracks during their service life.By taking mode I conditions into account,the safety and damage tolerance of structures in practice can be analyzed successfully[1-3].However,there are still problems that are subjected to a combination of mode I and mode II loading in many practical situations,for which mode I analysis approaches are not sufficient.Thoroughly understanding of mixed mode I/II fracture behavior is necessary for accurate assessment of the residual lifetime of the cracked structures.The compact tension shear(CTS)specimen is one of the favorite test samples for testing the mixed mode I/II fracture behavior in the literature[4-9].The CTS specimen is designed by Richard[10]originally used for the determination of fracture toughness under mode I loading,mode II loading and mixed mode I/II loading of different engineering materials and then used for the investigation of the mixed mode I/II crack growth rate by many researchers[11-16].
The stress intensity factors(SIFs)that characterize the stress and strain fields around the CTS specimen crack front are the key for the determination of the mixed mode I/II fracture limit curve and crack growth rate.The closed-form SIFs solutions proposed by Richard[17]can be used directly to determine the fracture limit curve.The mentioned formulas are valid only for the slant crack before crack deflection,they are no longer adequate for the deflected crack and cannot be used for the determination of the mixed mode I/II crack growth rate.Several finite element simulation models were analyzed to obtain both KIand KIIunder mixed mode I/II loading by some researchers[6-8,12,15].The real boundary conditions of the CTS specimen cannot be taken into account accurately by the simplified models[6-7,12,15-16]composed of the CTS specimen alone.Although there were simulation models[8]composed of the whole testing components,no closed-form solutions were given to calculate the SIFs for the deflected crack.
In this study,three dimensional fracture analyses of the mixed-mode I/II test system composed of CTS specimen,loading device and pins using finite element method(FEM)are presented.To simulate the real conditions,the contacts between the contact surfaces of the loading device,specimen and the pins are defined.The crack growth paths of the CTS specimen for all loading angles are simulated following the maximum tangential stress(MTS)principle.The SIFs of the crack front with the crack growth length were given,and the reason of the crack growth paths not perpendicular with the direction of the traction force was found.Finally,the closed-form SIFs formulas used for calculation of deflected crack of CTS specimen were proposed.
1 Mixed mode I/II fracture testing system
The loading device,illustrated in Fig.1(a),allows applying pure mode I loading,pure mode II loading as well as other five mixed mode I/II loading combinations to the CTS specimen using a uniaxial fatigue testing machine.The testing system is consisted of CTS specimen,CTS-pins,holders,u-pins,u-clevises and loading rods as shown in Fig.1(a).Depending on the loading angle α as shown in Fig.1(b),pure mode I(α=0°),pure mode II(α=90°),and mixed mode loading(α=15°,30°,45°,60°and 70°)can be obtained.The loading axis is designed to pass through the center of the CTS specimen under different loading angles.
The closed-form SIFs solutions of the CTS specimen in the range from 0.45≤a/W≤0.7 for different loading angles and initial crack orientation are proposed by Richard[17]as:


Fig.1 The testing system for mixed-mode I/II loading
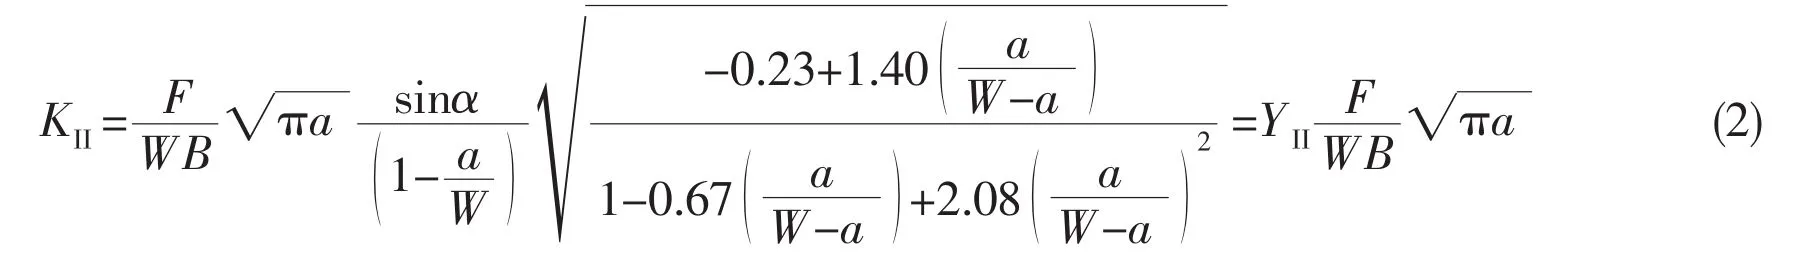
where F is the applied traction force,W is the width of the specimen,B is the thickness of the specimen,a is the crack length,α is the loading angle,YIis mode I dimensionless geometry factor and YIIis mode II dimensionless geometry factor.
The configuration of the CTS specimen used in this study with length of 153 mm,width of 90 mm and thickness of 20 mm is shown in Fig.2.The initial crack length is 45 mm with a notch length of 42.5 mm and a pre-cracked length of 2.5mm under mode I loading.The initial a/W is 0.5.
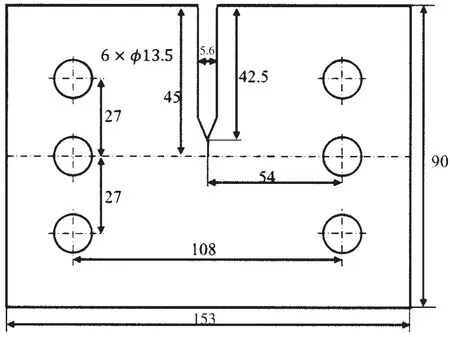
Fig.2 The configuration of the CTS specimen
The ratio of mode I and mode II is presented by a dimensionless parameter called mixed mode I/II mixity factoras

2 SIFs numerical estimation
The formulas(1)and(2)are valid only for the slant crack before crack defection,they are no longer adequate for the deflected crack.As shown in Fig.4,both the direction of crack and the stress fields will be changed after the initial crack changing its orientation.Eqs.(1)and(2)only can be used to validate the accuracy of SIFs numerical method.

Fig.3 Variations of the mixity factor with the loading angle α
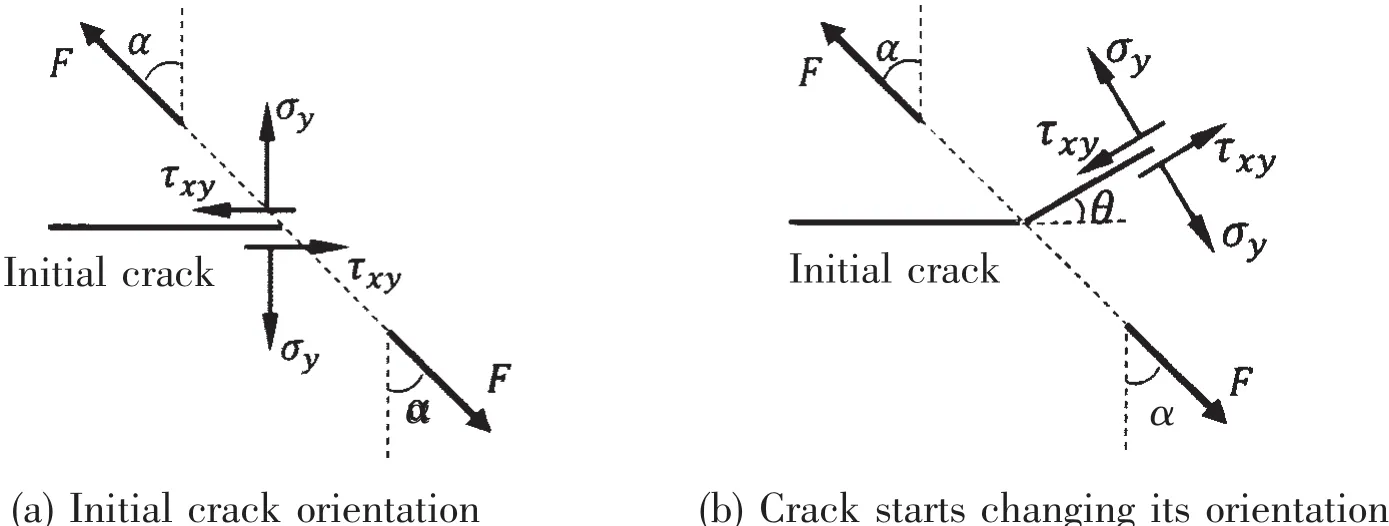
Fig.4 The direction of crack and the stress fields around the crack front
2.1 Finite element models of the testing system
An alternative method for the determination of SIFs is by means of FEM which has been widely used in fatigue fracture behavior study.Modeling,meshing,loadings,boundary conditions and contacts,the solution of the testing system are performed by using ANSYS.Geometry models of mixed-mode I/II test system for different loading angle α are shown in Fig.5.In contrast with the simplified method using in Refs.[6,7,12,15-16],contacts are defined to simulate the real boundary conditions in order to get accurate SIFs results.

Fig.5 Geometry models of mixed-mode I/II test system for different loading angle α
The 20-node SOLID95 elements were selected to model the finite element models.The FE models of mixed mode I/II testing system are shown in Fig.6.

Fig.6 The finite element models of mixed mode I/II test system for loading angles α=0°,45°,90°
At the first ring elements around the crack front,the 20-node collapsed triangular quarter-point elements were utilized to produce thesingularity of stress and strain fields in the vicinity of crack front and the displacement extrapolation method was used to calculate the SIFs[18-19].The TARGE170 element and CONTA174 element were selected to simulate the target surfaces and contact surfaces respectively.Bonded contact type was used for the contact mechanics analysis.In order to simulate the actual conditions in the fatigue test machine,the bottom loading road surface nodes are constrained in all directions and the upper loading rod surface nodes are allowed to move along loading axis only as shown in Fig.7(a).Fig.7(a)is a representative for α=45°,all the other loading angles’ boundary conditions and traction force applying are similar to α=45°.The traction force is applied at the upper loading rod surface.The detailed mesh used for the holders,u-clevis,CTS-pin,u-pin and CTS specimen are shown in Fig.7(b).Five rings around the crack front with 8 elements mesh for each ring were adopted to model the crack.

Fig.7 Boundary conditions and mesh used for the holders,u-clevis,CTS-pin,u-pin and CTS specimen
There are two contact pairs of the mixed mode I/II test system.Contact and target pairs between CTS-pins,CTS specimen and holders are shown in Fig.8.Contact and target pairs between u-pins,u-clevis,holders are shown in Fig.9.

Fig.8 Contact and target pairs between CTS-pins,CTS specimen and holders

Fig.9 Contact and target pairs between u-pins,u-clevis,holders
2.2 SIFs results
The material was assumed to be homogeneous,isotropic with linear elastic behavior.The Young’s modulus E and Poisson’s ratio υ of the material are 208 GPa and 0.3,respectively.Stress distributions of mixed mode I/II CTS testing system under 100kN for the loading angle α=45°are shown in Fig.10.

Fig.10 Stress distributions of mixed mode I/II CTS test system under 100 kN for α=45°
The linearity between the applied traction force and the SIFs is verified firstly by loading 10 kN,100 kN,200 kN,300 kN,400 kN and 500 kN to the FE models for α=o°,45°,90°.It can be clearly seen from Fig.11 that there is a linear relation between the SIFs and the applied force.The absolute values of SIFs increase linearly by increasing the applied traction force which is in consistent with the Richard closed-form solutions.

Fig.11 Analyses to investigate the relationship between the applied loads and SIFs results
The results of geometry factors YIand YIIcalculated from the SIFs KIand KIIgiven by Richard closed-form solutions and the proposed simulation method for the CTS specimen of a/W=0.5 are shown in Fig.12(a)and Tab.1.The very good agreement of YI,YIIresults is found between Richard solutions method and presented method.The mixed mode I/II mixity parameterresults of Richard solutions method and presented simulation method are in good agreement as shown in Fig.12(b).The agreement which is observed between the two sets of results of geometry factors and mixity factor can be considered as a validation for the presented simulation method.

Fig.12 Comparison between the FEM results and Richard results for a/W=0.5

Tab.1 Dimensionless geometry factor under different loading angle
Variations of KIand KIIalong crack front for all loading angles are shown in Fig.13.It is clearly seen that KIdecreases with increasing loading angle while KIIincreases.The reason of nonzero values of KIfor α=90°is that the whole test system is an elastic body whose Young’s modulus is finite.

Fig.13 Variations of KIand KIIalong crack front for all loading angles(F=100 kN,a/W=0.5)
The linearity between the specimen thickness and the SIFs results is verified by the numerical analysis of 20 mm-thick specimen and 9 mm-thick specimen under 100 kN load.Variations of KIand KIIalong crack front for the 20 mm-thick specimen and 35mm-thick specimen under 100 kN are shown in Fig.14.The KIvalues at the center of the crack front for the 20 mm-thick specimen and 9 mm-thick specimen are 1 291.6 MPaand 2 691.7 MPa,respectively.The KIIvalues at the center of the crack front for the 20 mm-thick specimen and 9 mm-thick specimen are-587.9 MPaand-1 305.6 MParespectively.It is concluded that the absolute values of SIFs are inversely proportional to the specimen thickness which is in consistent with the Richard closed-form solutions.
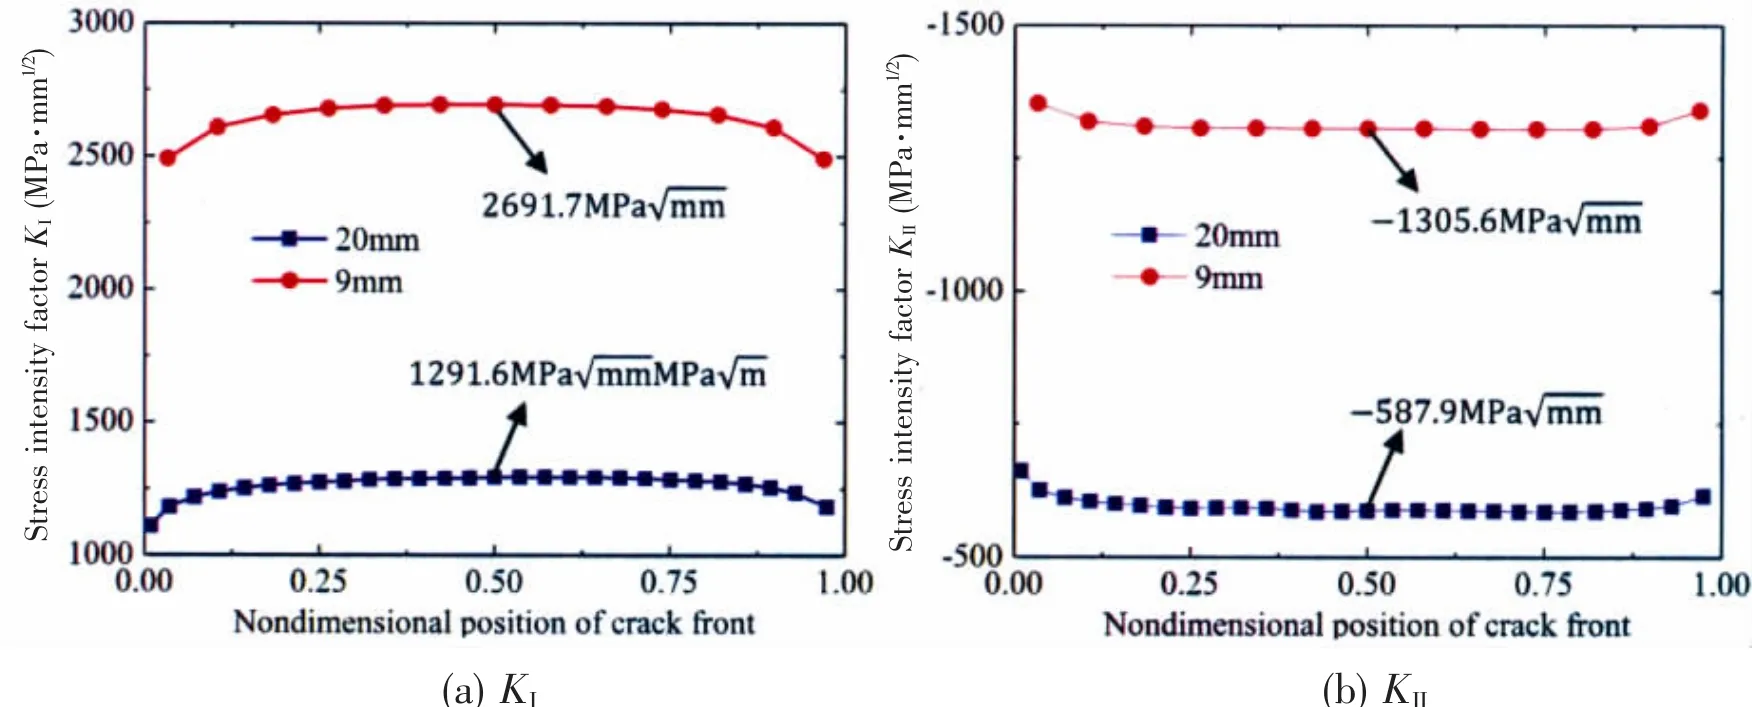
Fig.14 Variations of KIand KIIalong crack front(a/W=0.5,α=45°,F=100 kN)
3 Fatigue crack growth paths simulation
In the literature,several criteria such as the maximum tangential stress(MTS)criterion[20],minimum strain energy density(SED)criterion[21],maximum energy release rate(G)criterion[22]and Richard criterion[23]have been proposed to understand the mixed mode I/II fracture behavior.Comparisons of predicted crack deflection angles of CTS specimen for a/W=0.5 are shown in Fig.15.The predicted crack angles based on the presented simulation method are slightly higher than the theoretical results.

Fig.15 Comparisons of predicted crack deflection angles of CTS specimen for a/W=0.5
Some studies[7,12,16,23]have proved that the crack growth of steel follows the MTS criterion.The crack growth paths of the 20 mm-thick CTS specimen under 100 kN for all loading angles are simulated by the presented simulation method.It can be seen from Fig.16 that crack growth directions of the CTS specimen for all loading angles will keep almost steady after the initial deflection.
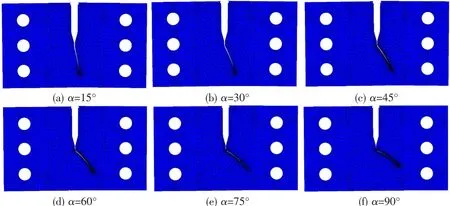
Fig.16 Crack growth paths of CTS specimens for loading angles except α=0°
A Cartesian coordinate system(see Fig.17)was introduced to define the crack length under mixed mode loading.The horizontal x-axis is in the same direction of the initial crack orientation,and the vertical y-axis starts at the initial crack tip.Since the crack length is increased both in x and y direction simultaneously,the crack growth increment Δaiis defined as

Fig.17 Crack length of a deflected crack

The crack length is defined as the sum of initial crack length a0and the extended crack length aewhich is calculated from the initial crack tip to the final crack tip as shown in Fig.17.

The crack growth paths simulations were performed at crack increment of 0.5 mm for total 20 steps.The SIFs results of the middle node of the crack front for each step are shown in Fig.18(a)and(b).The absolute values of KIIreduce immediately to near zero once the crack starting to kink,while the absolute values of KIincrease gradually during crack propagation.As seen in Fig.18(c),the mixed mode I/II mixity factorsof all loading angles approximately approach to 1 which means that the propagating crack will no longer change its direction according to Fig.15(a).

Fig.18 Variations of SIFs andof the middle node of crack front with the crack length under 100 kN load
The least square approach is applied to get the quadratic polynomial fit equation of KIwith the dimensionless parameter a/W for each loading angle.The equation is defined as

Quadratic polynomial fit curves of KIwith a/W are shown in Fig.19.The quadratic polynomial coefficients A0,A1,and A2for every loading angle are listed in Tab.2.Fig.19 shows that the quadratic polynomial fit is perfect with R2=1.
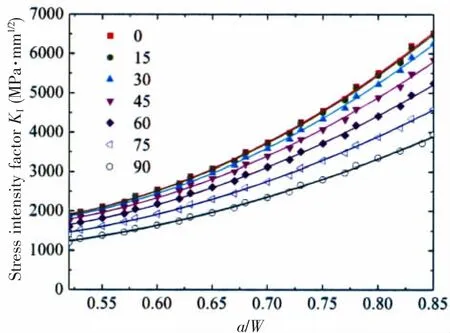
Fig.19 Quadratic polynomial fit curve of KIwith a/W
Tab.2 Coefficients of quadratic polynomial equation of

Tab.2 Coefficients of quadratic polynomial equation of
?
The quartic polynomial fit equation of the coefficients A0,A1and A2with the loading angle.The equation is defined as

Quartic polynomial fit curves of A0,A1and A2with the loading angle are shown in Fig.20.The quartic polynomial coefficients B0,B1,B2,B3and B4are listed in Tab.3.Fig.19 shows that the quartic polynomial fit is perfect with R2=0.98.

Fig.20 Quartic polynomial fit curve of A0,A1and A2with the loading angle

Tab.3 Coefficients of quartic polynomial equation of coefficients Ai(i=0,1,2)
The SIF KIfor the deflected crack of the 20-mm thick CTS specimen under 100 kN can be calculated by the following equation.

As for the SIF KII,it can be calculated through the cubic polynomial equation(Eq.9)of the average KIIvalue for the propagated crack(see Fig.18(b))with the loading angle.
Cubic polynomial fit curve of KIIwith the loading angle is shown in Fig.21,the fitting correlative coefficient R2=0.974.
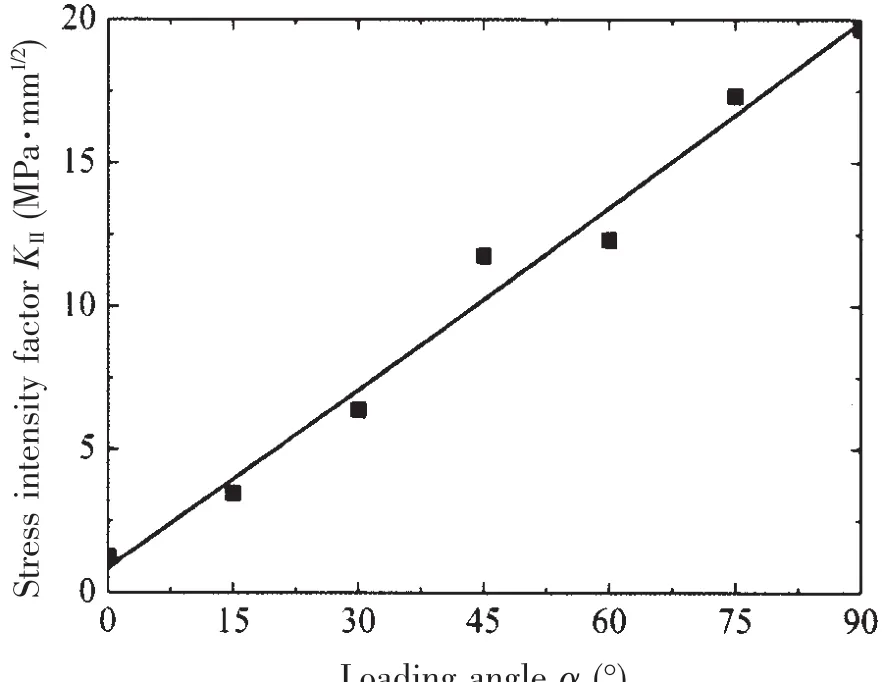
Fig.21 Cubic polynomial fit curve of KIIwith loading angle α
Eqs.(8)and(9)are based on the SIFs results of 20 mm-thick CTS specimen with initial crack length ratio a/W=0.5 under 100 kN load.As discussed before,the SIFs values of the proposed simulation method are inversely proportional to the specimen thickness and directly proportional to the applied load,the SIFs for the defected crack of the CTS specimen will be defined as

where

4 Summary and conclusion
In this study,the closed-form solutions for the defected crack of CTS specimen are proposed.Details of modeling CTS specimen mixed mode I/II fracture testing system,mixed mode I/II fracture numerical analyses and fatigue crack growth paths simulations are presented.The SIFs results obtained by the presented simulation method were validated by comparing with the Richard closed-form solutions results.The crack growth paths of the CTS specimen for all loading angles are simulated followed MTS criterion.The absolute values of KIIreduce immediately to near zero once the crack starting to kink,while the absolute values of KIincrease gradually during crack propagation.The propagating crack will no longer change its direction after the initial deflection for the reason that the mixed mode I/II mixity factorsof all loading angles approximately approach to 1.Finally,the closed-form SIFs formulas used for calculation of deflected crack of CTS specimen were proposed.
杂志排行

船舶力学的其它文章
- Measurement Method of Sound Impedance of Acoustic Coating in Water-tube without Back Layer
- Buckling of Multi-segment Egg-shaped Pressure Hull
- Effect of Rib Stiffness on Stability of Submerged Ring-stiffened Functionally Graded Cylindrical Shells
- Fatigue Crack Growth Properties of 18Ni(250)and 18Ni(350)Used for Full-Ocean-Depth Pressure Hull
- Strength Characteristics of Maraging Steel Spherical Pressure Hulls for Deep Manned Submersibles
- 3D Nonlinear Hydroelastic Response and Load Prediction of A Large Bulk Carrier in Time Domain